Today, we are pleased to present a guest contribution written by Valerio Ercolani and Filippo Natoli, both of the Directorate General for Economics, Statistics and Research of the Bank of Italy. The views presented in this note represent those of the authors and not necessarily reflect those of the Bank of Italy.
After the economic downturn that followed the outbreak of the Covid-19 crisis, private forecasters see a rebound in the third quarter of 2020 both in the US and worldwide. While this appears as the most plausible scenario assuming lockdown and social distancing measures are soon relaxed, a recessive dynamics through the end of the year cannot be ruled out. A simple probit model augmented with market volatility, which reached its maximum last March, forecasts a more prolonged recession in the United States. Historically, turmoil in financial markets informed us that the associated recessions were not close to the end.
Private forecasters currently see a deep fall of US and global GDP in 2020:Q2, a big economic rebound in the third quarter and a still significant growth in the following two quarters (see, among others, Barclays, 2020 and JP Morgan, 2020). This entails that already in three to four months from now, positive GDP growth should materialize. While this appears as the most plausible scenario assuming lockdown and social distancing measures are soon relaxed, a recessive dynamics through the end of the year cannot be ruled out a-priori.
Useful insights into this can be offered by economic indicators that are fast-moving and forward-looking, i.e., financial prices. In March, implied volatility in the US stock market, captured by the “fear gauge” VIX index, rose to its highest level, further realized volatility reached a historical peak (Figure 1). Baker et al. (2020) stress that current uncertainty is greater than the levels associated with (i) the financial crisis of 2008-09 and (ii) past epidemics like Ebola and SARS.
Figure 1: Indicators of financial volatility over time (daily frequency)
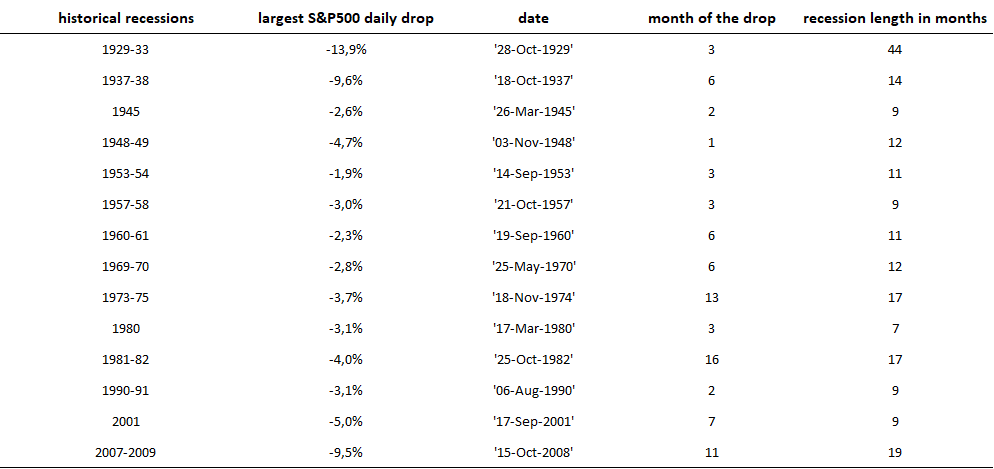
Market volatility could convey some information about the timing and shape of the expected recovery. In 2 out of the 3 recessions occurred since 1990, when its availability begins, the VIX reached its peak at least 6 months before a positive turning point shows up (Table 1). Moreover, historical data since the Great Depression show that the largest stock price drops within recessions – as the one of last March – occurred much before recessions ended: in roughly 65% (87%) of the actual recessions, daily returns reached their low at least 6 (3) months before the end of the recession (Table 2).

Table 1: peaks of the VIX index during past recessions, in US

Table 2: largest stock price drops during past recessions, in US
We try to use the information conveyed by the VIX, augmenting a standard forecasting model based on the slope of the yield curve. Slope-only predictive models have performed well in the past as leading indicators of incoming recessions, but there are reasons to believe that such predictive ability has diminished after the global financial crisis: in particular, both secular forces and large-scale intervention by the Fed have contributed to depress long-term yields.
We therefore run an otherwise standard probit model, in which the probability of the economy being in recession is regressed on the yield curve plus the VIX:

where the dependent variable is a dummy equal to one (zero) if the US economy is (is not) in a NBER recession (Rec) at time t+h, h being the forecast horizon; the yield curve slope (slope) is proxied by the 10-year vs. 3-month yield spread; the VIX index is the one-month implied volatility of S&P500 options; is a constant and F(.) denotes the standard normal cumulative distribution function. The model is estimated by maximum likelihood using monthly data from January 1990 to March 2020. In principle, we do not yet know whether or not the US economy was in recession in the first months of the current year: however, in accordance with recent nowcasts (e.g., those produced by the Federal Bank of New York) we set March 2020 as it was in a recession state.
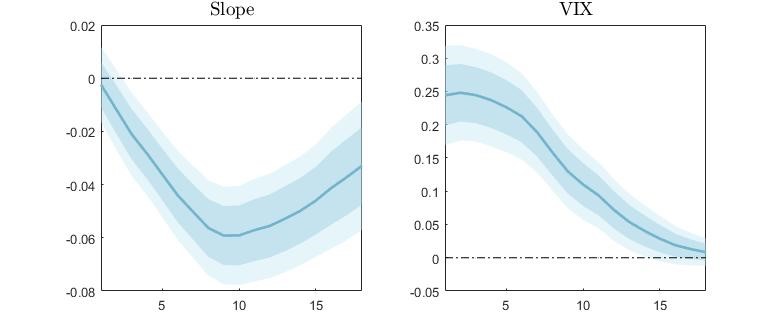
The VIX index shows up as a significant predictor of recession: the marginal effects of the model reveals that higher market volatility increases the probability of recession from 1 up to, at least, 12-month horizon (Figure 2). The negative sign of the slope is also expected: a flatter yield curve decreases the probability of recession.

Figure 2: Average marginal effects from 1 to 18-month horizons of the VIX-augmented model, with associated 68% and 90% confidence bands.
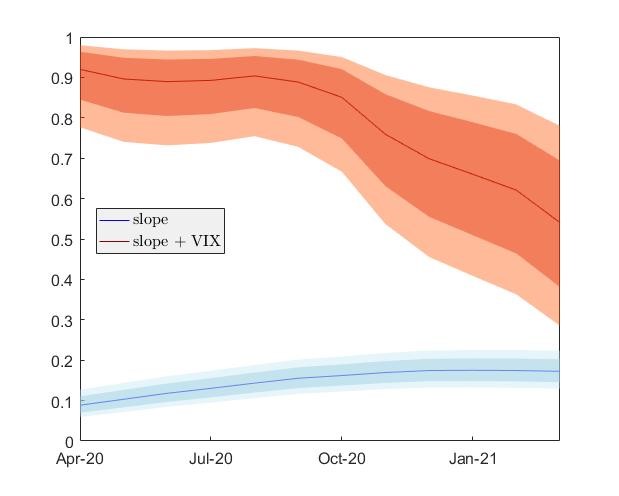
We then make out-of-sample forecasts from April 2020 to March 2021, i.e., with h going from 1 to 12. As Figure 3 shows, recession probabilities generated by the augmented model (red line) stay at 90% until September 2020, i.e., the end of the third quarter; only subsequently they start falling, but still remaining above 50%, 12 months from now. For comparison, recession probabilities associated to the standard slope-only model (blue line) never go above 20%. It is important to point out that the VIX-augmented model performs much better than the model with the slope alone at any horizon according to standard goodness-of-fit statistics such as Pseudo R2 (as in Estrella, 1998), BIC (as in Wright, 2006) and AUROC (as in Berge and Jordà, 2011). Taken at face value, market volatility is signaling that the current recession may go well beyond the second quarter of 2020.

Figure 3: Out of sample forecasts: probabilities of recessions from 1 to 12-month horizons, with the associated 68% and 90% confidence bands.
We are not the only ones to raise concerns that the current recession could persist well beyond the second quarter. For example, Fornaro and Wolf (2020), within a New Keynesian framework, show that the Covid-19 shock could give rise to an expectation-driven stagnation trap, where agents might coordinate in an equilibrium where output remains permanently low featuring a prolonged recession. Further, Baker et al. 2020 use US stock market information to calibrate first- and second-moment aspects of the COVID-19 shock within the Baker et al. 2019 disaster model. They find a peak year-on-year US GDP contraction of 11% in the last quarter of this year, followed by anemic growth in 2021. More than half of the projected output contraction is caused by Covid-19-induced uncertainty. Similarly, Ludvigson et al. (2020) show that the negative effects of the crisis would persist for at least the next 10 months, with macroeconomic uncertainty being one of the drivers of the crisis. The role of stock-market uncertainty in the last two analyses is causal, and should not be confounded with the role it plays in a purely forecasting exercise such as ours. Yet, and sadly so, they also point to a more protracted contraction than many observers currently presage.
This is a time when traditional macroeconomic data, available with lags, are less helpful than usual in making forecasts. Furthermore, the standard macro models used for processing that information may not be up to the task, given the very unusual nature of the current shock and the difficulty of modelling how its effects will play out going forward. Therefore, the need emerges to combine those data and models with additional information and approaches. Looking at higher-frequency data is warranted, and trying to exploit financial markets is another, potentially informative effort. Our admittedly simple approach suggests, unfortunately, that a turning point may have to wait for longer than some observers believe.
Bibliography
Baker I., N. Bloom, S. Davis and S. Terry (2019). “Does uncertainty reduce growth? Using disasters as natural experiments”, mimeo Stanford, http://people.bu.edu/stephent/files/BBT.pdf
Baker I., N. Bloom, S. Davis and S. Terry (2020). “COVID-induced economic uncertainty”, VoxEu Column, 13 April
Barclays (2020), “Global Economic Weekly”, April 2020,
Berge and Jordà (2011), “Evaluating the Classification of Economic Activity into Recessions and Expansions”, American Economic Journal: Macro, 3 (2)
Estrella, A. (1998), “A new measure of fit for equations with dichotomous dependent variables”, Journal of business & economic statistics 16 (2)
Fornaro, L., and M.Wolf (2020). “Coronavirus and macroeconomic policy”, VoxEu Column, March 10, 2020
JP Morgan (2020), “Global Data Watch”, April 2020
Ludvigson S., S. Ma and S. Ng. (2020). “COVID19 and the macroeconomic effects of costly disasters” NBER Working Papers 26987
Wright (2006), “The Yield Curve and Predicting Recessions”, Federal Reserve Board
This post written by Valerio Ercolani and Filippo Natoli.


