Last Updated on
Most traders will tell you to stay away from indicators.
They give you reasons like:
- It lags the market
- It gives you late entries
- It can’t predict what the markets will do
Nope, those are excuses.
Want to know the real reason why traders lose money with indicators?
Here’s why…
You got conned into the “indicators game”
Many traders don’t know how this game is supposed to be played.
They believe the answer lies in the “right” combination of indicators that will make them rich.
So they buy the latest trading indicators to help them crack the code.
And after many failed attempts, they wonder why they lose money with trading indicators.
Do you want to know why?
Here’s the truth…
Indicators are a derivative of price. They simply indicate to you what has happened, not what will happen.
So, no matter how many different combinations you try, you’ll never be a profitable trader if you solely rely on trading indicators to make your decisions.
Trading indicators are meant to aid your decision-making process, not be the decision-maker.
Trading indicators: Do you make this mistake?
Look at the chart below…
Now, you might be thinking…
“Look how strong the signal is.”
“All three indicators are pointing in the same direction.”
“The market is about to move higher.”
Sorry to burst your bubble.
But that’s the wrong way to use trading indicators.
Why?
Because the RSI, CCI, and Stochastic indicator belong to the same category (otherwise known as Oscillators).
This means the values of these indicators are calculated using similar mathematical formulas — which explains why their lines move in the same direction.
So don’t make the mistake of thinking a signal is “strong” because multiple indicators confirm it. Chances are, they are indicators from the same category.
You blindly copy what others do
Here’s the thing:
There are profitable traders out there who use indicators in their trading.
And you’re probably thinking:
“Since they are making money with these indicators, why don’t I just copy them?”
So, that’s what you do.
You follow the same indicators, settings, instructions, etc.
But, you still lose money with trading indicators.
Why?
Because what you see is only the surface, not the complete picture.
Here’s an example:
Let’s say Michael is a profitable trader who relies on trading indicators to time his entries and exits.
Now, the reason why Michael finds success with indicators is not that he found the “perfect” settings or whatsoever.
Rather, it’s because he knows how to switch gears and use different indicators for different market conditions.
So if you were to blindly follow what he does, then when the market changes, your trading indicators will stop working and that’s when the bleeding starts.
How professional traders use indicators (it’s not what you think)
At this point, you’ve learned that trading indicators shouldn’t be the basis of your analysis and why you shouldn’t copy other traders.
So now the question is, how do you use trading indicators the correct way?
The secret is this…
You want to classify trading indicators according to their purpose, then use the appropriate trading indicators for the right purpose.
So, what’s the purpose of trading indicators?
Well, you can use them to:
- Filter for market conditions
- Identify areas of value
- Time your entries
- Manage your trades
Let me explain…
#1: How to use trading indicators and filter for market conditions
Here’s the thing:
All trading strategies can work some of the time.
But no trading strategy can work all the time.
Thus, you must know the market conditions where your trading strategy will perform and avoid market conditions where it will underperform.
And here’s how trading indicators can help…
Moving Average
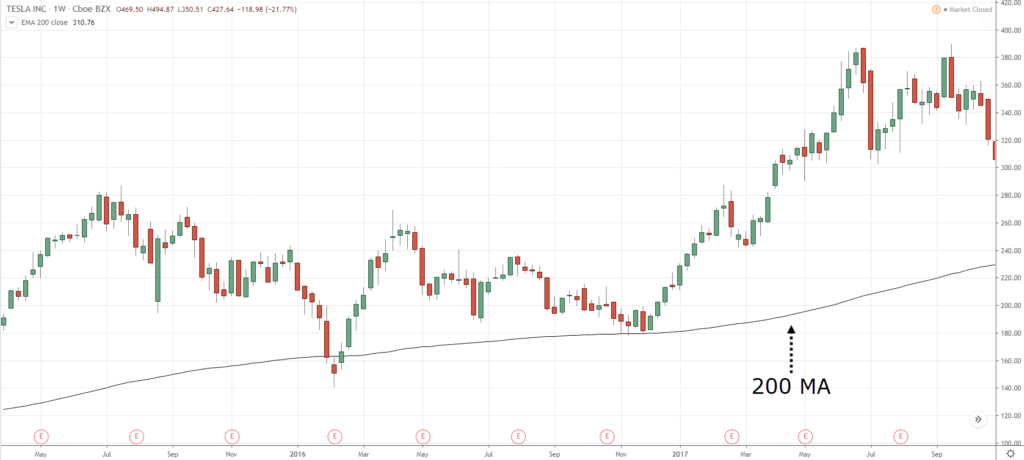
Moving Average is a Trend Following indicator that can be used to filter for trends in the market.
For example, if the price is above the 200-day Moving Average, then the market is in a long-term uptrend.
Here’s what I mean…
Average True Range (ATR)
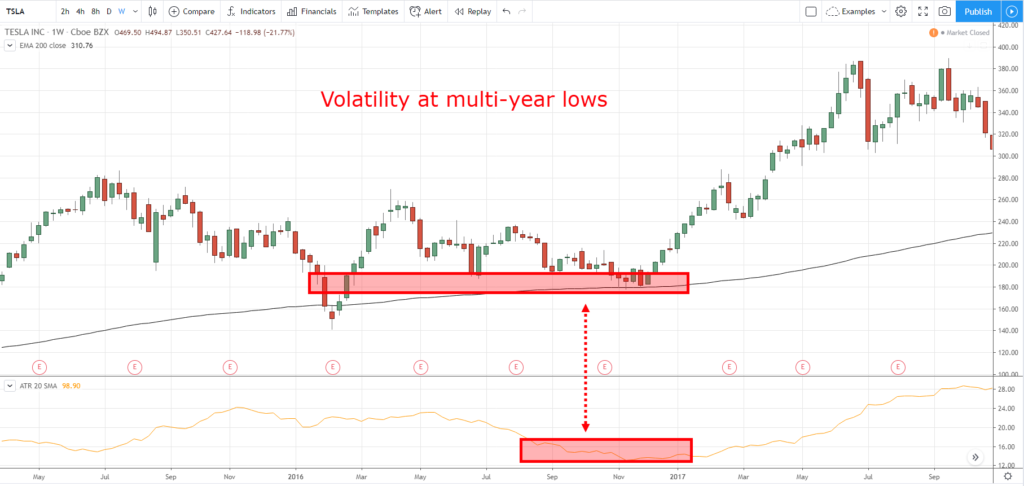
Average True Range measures volatility in the markets and can be used to identify low or high volatility market conditions.
For example, if your trading strategy works well in a low volatility environment, then look for ATR values trading at 52-week lows.
Here’s what I mean…
#2: How to use trading indicators and identify an area of value
You’re probably wondering:
“What’s an area of value?”
Well, this is an area on your chart where potential buying or selling pressure could step in.
For example, price action traders use Support and Resistance, Trendlines, Channels, etc. to define an area of value.
However, it’s not the only way because you can use indicators as well. Here’s how…
Relative Strength Index (RSI)
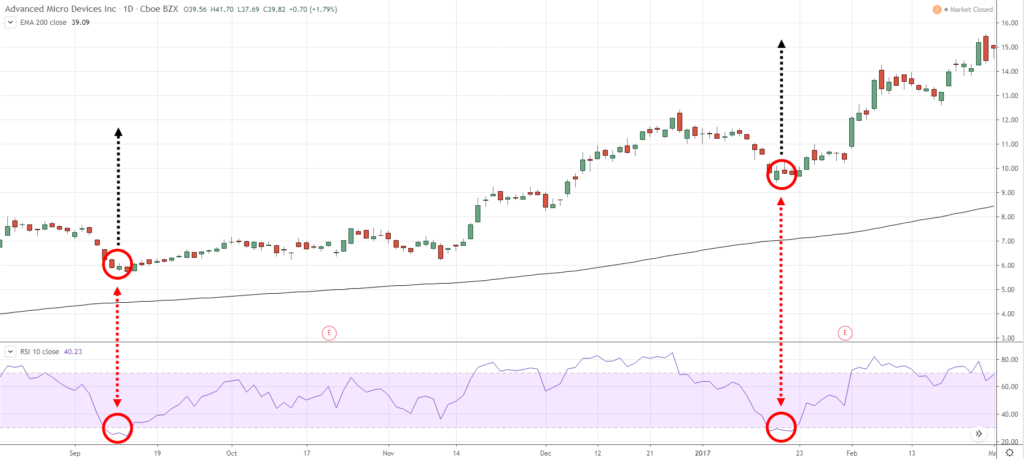
The RSI is a momentum indicator that measures average gains to losses over a period of time.
And it’s useful to identify an area of value for the stock markets which has a mean-reverting behaviour.
This means when stock prices fall, it tends to “bounce” higher and continue the long-term uptrend.
So, one way to time the “bounce” is to look for trading setups when the 10-day RSI crosses below 30.
Here’s an example…
Pro Tip:
This technique won’t work for all markets, it’ll only work for those with a mean-reverting behaviour like stocks.
Moving Average
Does this indicator seem familiar?
You bet!
Because it’s been mentioned earlier on how you can use it to filter for trending market conditions.
So, the point is this…
One trading indicator can have multiple purposes just like the Moving Average.
And the only way to know what purposes it can be used for is to understand how it works (the math and logic behind it).
So now, how does a Moving Average help you identify an area of value?
Here’s how…
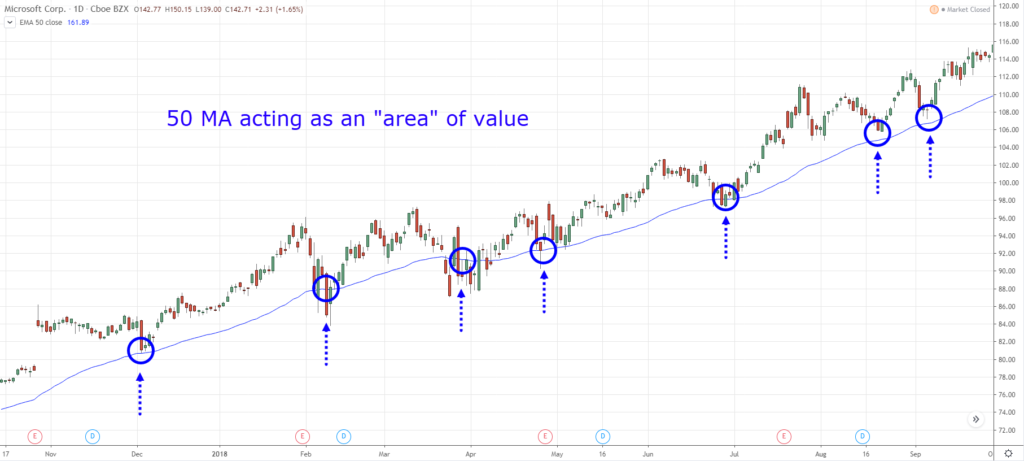
In a trending market, the price rarely re-tests previous Support or Resistance. So that’s where Moving Average comes into play.
For example:
In a healthy trend, it tends to find an area of value near the 50-Period Moving Average.
Here’s what I mean…
Pro Tip:
In a strong trend, the market tends to find an area of value near the 20-Period Moving Average.
In a weak trend, it tends to find an area of value near the 200-Period Moving Average.
#3: How to use trading indicators to time your entry without second-guessing yourself
Most traders are familiar with their trading setup.
For example, you know how to trade a breakout, a pullback, a reversal, or whatsoever.
But when the time comes to pull the trigger, you hesitate because the “price action” doesn’t look convincing.
- Perhaps the candle is not big enough.
- Perhaps the candle didn’t close strongly
- Perhaps the upper wick is too long.
- And etc.
The solution?
You want an objective entry trigger so you never have to second-guess yourself.
Stochastic indicator
The Stochastic is a momentum indicator (similar to the RSI).
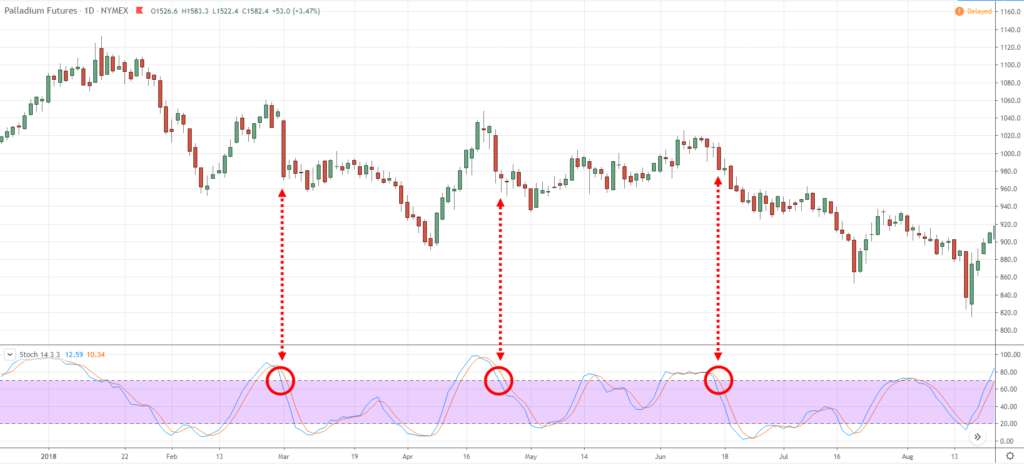
When its value crosses above 30, it’s telling you bullish momentum is stepping in and it can serve as a bullish entry trigger to buy.
And if it crosses below 70, bearish momentum is stepping in and it can act as a bearish entry trigger to sell.
Here’s what I mean…
Pro Tip:
Trading setup and entry trigger are two different things. You must have a valid trading setup first, then look for an entry trigger to enter a trade — not the other way round.
Donchian Channel
The Donchian Channel is a Trend Following indicator developed by Richard Donchian (a pioneer in Trend Following).
By default, it plots the 20-day high and low so it’s easy for you to identify the highest/lowest price over the last 20 days.
This is useful for breakout traders as you can time your entry when the price reaches the upper Donchian Channel, or sell when it reaches the lower one.
Pro Tip:
You can adjust the Donchian Channel to trade any length of a breakout.
Want to trade a 200-day breakout? No problem. You can adjust it accordingly.
#4: How to use trading indicators to manage your trades from start to finish
Trade management isn’t a sexy topic but, it’s an important one.
Because you can have the best entries, but with poor trade management, you’ll still end up with a losing trade.
So in this section, you’ll discover how to use trading indicators to set a proper stop loss and exit your winning trades.
Average True Range (ATR)
When you set your stop loss, it cannot be too tight or you’ll get stopped out from random fluctuations in the market.
Instead, you want to give it some buffer and here’s how…
- Identify the nearest price structure (like Support and Resistance, Trendline, etc.)
- Set your stop loss 1 ATR away from the price structure
An example…
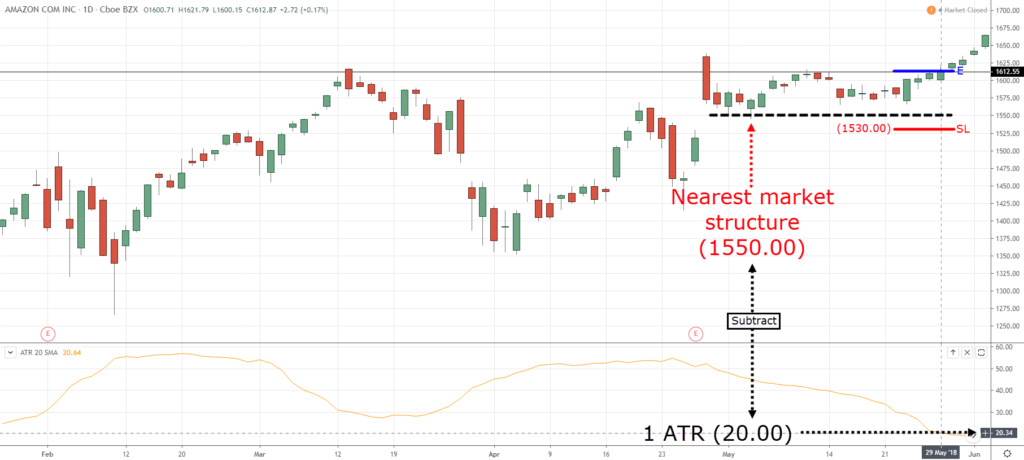
Here’s the logic behind it…
The price structure acts as a “barrier” to prevent the market from moving against you.
However, this “barrier” is not a specific price level and you’ve no idea how much further the market can “squeeze” you.
That’s why you’ll use the ATR indicator to give your trade some buffer.
Chandelier Exit
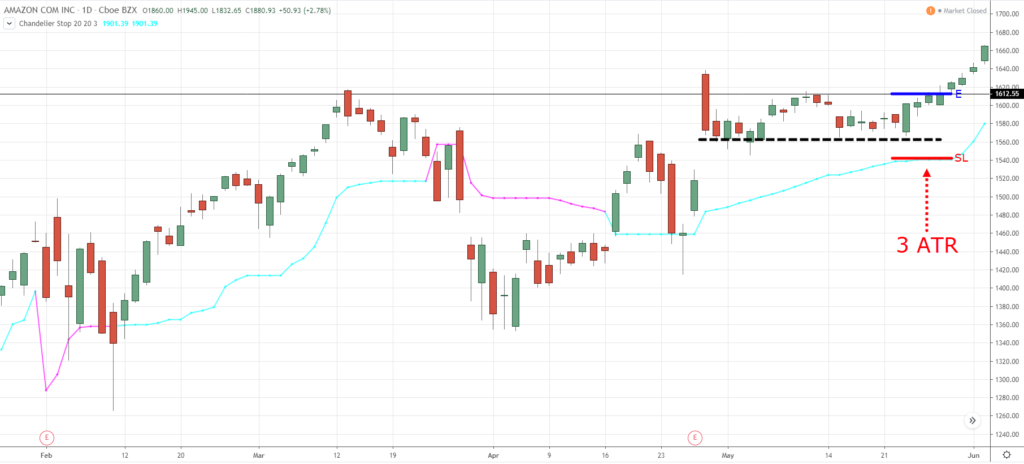
The Chandelier Exit is a trailing stop loss indicator. It calculates the current ATR value and multiplies it against a factor.
The factor can be any number you want, 3, 4, 5, 10, etc.
For example: if you choose a factor of 3, then the Chandelier Exit will be plotted 3 ATR away from the high/low.
And if the price closes below the Chandelier Exit, you’ll exit your trade.
Here’s an example…
Pro Tip:
If you want to ride a longer-term trend, use a higher factor value like 5, 6, or 7. And if you want to ride a shorter-term trend, use a lower factor value.
How to combine trading indicators like a pro
At this point:
You’ve learned that every trading indicator has a purpose, whether it’s for identifying market conditions, entry trigger, trade management, etc.
So now the question is…
How do you combine them and get better trading results?
Well, here are two guidelines to follow:
- Every indicator on your chart must have a purpose
- Have only one indicator for each purpose
I’ll explain…
Every indicator on your chart must have a purpose
A mistake almost all new traders make is to add many indicators onto their charts, regardless of whether the indicators have a purpose, or not.
But as you know, having more indicators doesn’t mean a thing. Instead, they only add “noise” to your trading and make things more confusing.
So, the first rule is this:
Every trading indicator on your chart must have a purpose.
For example…
If you want to identify the trend, then you can consider the Moving Average.
If you want to time your entry, you can consider Stochastic or RSI.
If you want to trail your stop loss, you can consider Chandelier Exit or Moving Average.
So, if there’s an indicator on your chart and you can’t find a purpose for it, exterminate it.
Next…
One indicator for each purpose
Recall:
You don’t want to have multiple indicators from the same category because they are correlated and doesn’t provide any new information.
That’s like trying to get your wife pregnant in one month by “firing” incessantly. It doesn’t work.
And it’s the same for trading.
So, the second rule is this:
Have only one indicator for each purpose.
I’ll explain…
If you want to trail your stop loss, you can use either the Moving Average or Chandelier Exit — but not both.
Or if you want to time your entry, you can use either the RSI indicator or Stochastic, but not two together because they have the same purpose.
Does it make sense?
Conclusion
So here’s what you’ve learned today:
- Indicators are a derivative of price. They simply indicate to you what has happened, not what will happen
- Don’t follow the indicator settings of other traders because you’ve no idea what their indicators are used for
- Don’t make the mistake of having multiple trading indicators from the same category because they are correlated and they give the same signals
- Every trading indicator on your charts must have a purpose, whether it’s to define the trend, identify the area of value, trail your stop loss, etc.
Now it’s your turn…
How do you use indicators in your trading?
Leave a comment below and share your thoughts with me.


