Today, we are fortunate to present a guest contribution written by Laurent Ferrara (SKEMA Business School and QuantCube Technology), Alice Froidevaux (QuantCube Technology) and Thanh-Long Huynh (QuantCube Technology).
On July 17, 2020, the National Bureau of Statistics of China published its preliminary quarterly accounts for the second quarter of 2020. After a drop of -6.8% in 2020q1, the China’s GDP bounced-back in positive territory to 3.2% (expressed in year-over-year growth), against a background of government expenses and cut in lending rates and banks’ reserve requirements. While much below its pre-Covid dynamics, China’s GDP annual growth was above expectations according to a Reuters poll done few days before.
Official GDP figures often come with some skepticism about their reliability. While Chinese authorities have decided to give up the strategy of having a GDP target (see explanations in this OECD blog), this time is no exception. There are only few China’s GDP nowcasts publicly available on the market. The San Francisco Fed has released a China Cyclical Activity Tracker but as today it stops in 2019Q2. But various public and private institutions have also developed their own China’s GDP nowcasts. Within QuantCube Technology, we have put forward nowcasting tools to track in real-time the Chinese productive economic activity, by using various sources of alternative data. We recently highlighted in an Econbrowser post that, especially during crisis periods, alternative data are extremely useful to complement official economic data to assess economic activity.
The first source of information is the international trade of goods and commodities. The QuantCube International Trade Index that we have developed tracks in real-time the evolution of official China’s external trade numbers by analyzing shipping data from ports located all over the world and by taking into account the characteristics of those ships. Recent results are presented in Figure 1 below. They show that, at beginning of July, the annual growth rate of China’s international trade is still very negative at -7.6%, reflecting thus a persistently low world demand.
Figure 1: International trade index for China (year-over-year growth). Source: QuantCube Technology
The second tool that we developed is a proxy of the job market created by aggregating the job offers per sectors available on websites. This index tracks China’s job openings by scraping data from various websites. It shows that the activity on the job market at beginning of July is still below the level estimated one year before. Interestingly, the index points out that after a recovery following the trough in February 2020, it seems that the job market is again slowing down since May 2020, reflecting some new concerns about the evolution of the Covid-19 virus within China.
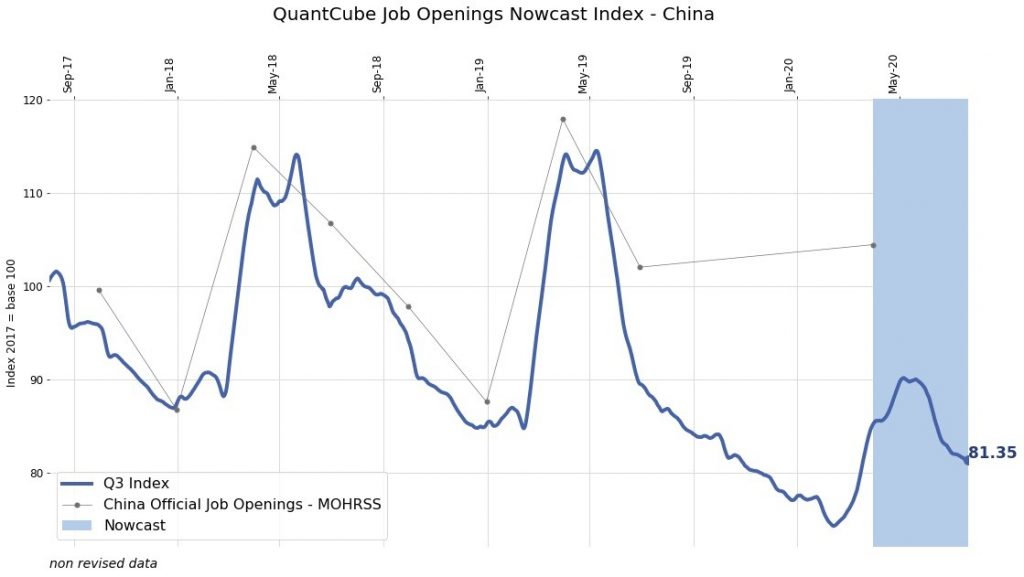
Figure 2: Job openings index for China. Source: QuantCube Technology
The third index is an index of China’s total private consumption based on on-line queries for some specific keywords related to household consumption. We identified that China’s household consumption is driven by few important sectors such as luxury, retail sales, services or leisure. Consequently, we created indexes for each component of the consumption index using related search queries retrieved by means of the Google Trends and Baidu applications. The overall consumption index expressed in year-over-year growth is presented in Figure 3 below. It shows that the index is still negative at -3.4% at beginning of July, in spite of a recovery since the trough in February 2020. This index reflects a still sluggish internal demand in China, also in line with the weak labor market .
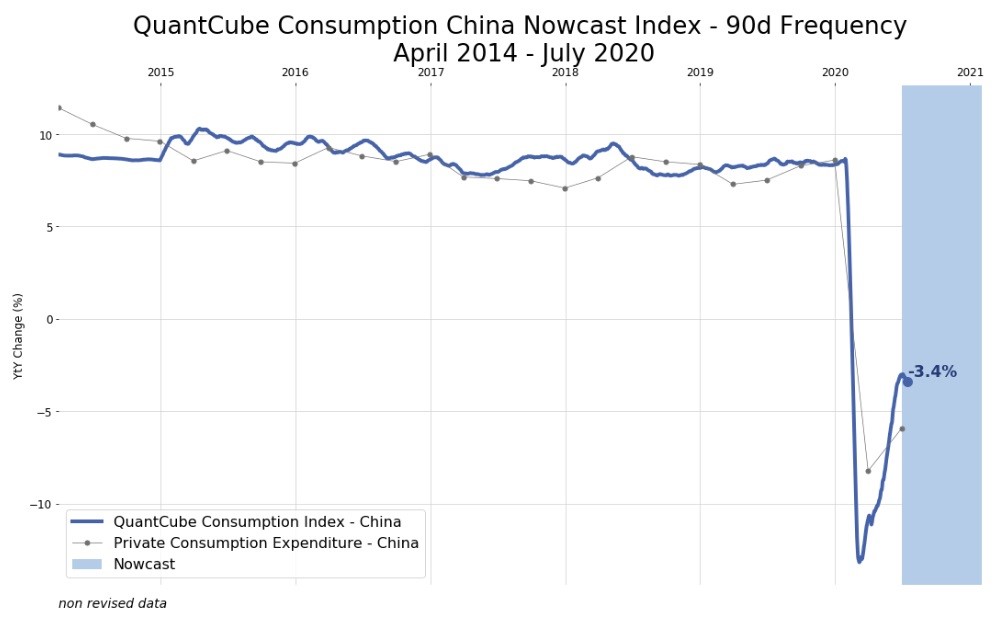
Figure 3: Private consumption for China (year-over-year growth). Source: QuantCube Technology
Overall those alternative indexes that we developed tend to suggest that the China’s productive economic activity is currently likely to grow at a lower annual rate than 3.2%, the official GDP annual growth rate for 2020q2 released by the National Bureau of Statistics.
This post written by Laurent Ferrara, Alice Froidevaux and Thanh-Long Huynh.