Learning to spot technical patterns before prices begin to move is one of the most critical aspects of day trading.
Yes, predicting the market with perfect accuracy is impossible, but if you trade long enough, you’ll start picking up on different patterns that could signal an upcoming price movement.
Head and shoulders, cup and handle, and pennants are some of the more common patterns traders use to identify trends, whether it’s a continuation or a reversal.
Today, we’ll be looking at the pennant pattern.
What is a Pennant Pattern?
If you’ve ever been to a baseball game (or at least watched one on TV), you’ve likely seen triangular flags hanging past the outfield that signify the home team’s accomplishments. They might say 2008 World Series Champions, or 2011 NL East champions, but they’re all the same size and shape.
These flags are called pennants and Major League Baseball has been giving them out for nearly 150 years – but sharp-eyed traders have also started noticing them in stock charts, often after a period of consolidation.
Traders use pennant patterns to learn when a cooling trend may be ready to reignite.
Pennant patterns are identified by the flag-shaped candles following large moves up or down. The initial leg up is the flagpole of the pattern – a period of strong price movement in one direction. But when the large price movement subsides, a period of consolidation could begin.
Pennant Pattern
This consolidation often looks like a flag, with the stock making lower highs but higher lows. Two trend lines form simultaneously, one slanting downward signifying resistance with the other slanting upward signifying support.
Pennant patterns can be bullish or bearish, depending on the direction of the trend.
But the crucial element is the flagpole.
Plenty of stock charts will show candles that look to be in the form of a pennant or flag, however be sure to locate the flagpole too. The rapid move up or down at the initial stage of the formation must be present for the pennant pattern to be confirmed.
This pattern is primarily used by swing traders looking for stocks that are currently “taking a breather” from their current trend progression. Once the pattern breaks, the signal sounds the alarm for an entry point.
However, day traders can use smaller time frames and attempt to trade the pennant pattern as well.
Breaking Down the Pennant Pattern
The pennant pattern is recognized by the V-shaped trend lines that accompany it. These trend lines appear set to convergence, meaning the stock is making higher lows and lower highs in an ever-shrinking range.
The breakout occurs when the price breaks one of these two converging trend lines.
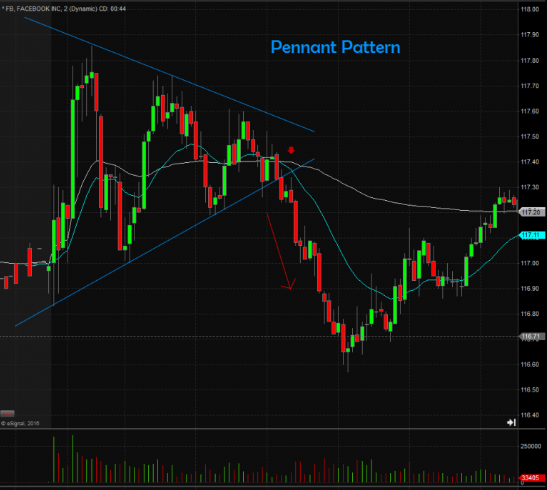
In a bearish pattern, the pennant shape will be broken when the price breaks through the support trend line and rapidly moves lower. The breakout often occurs with large volume and the price movement can be steep.
Likewise, in a bullish pennant pattern, the trend resumes when the trend line forming resistance is broken as the stock begins to ascend higher. The image below shows a bearish pennant pattern right before the support line was breached and the stock sped lower.

Finding examples of the pennant pattern after the fact isn’t a difficult process, but locating them before they happen is tricky.
The pennant pattern isn’t as common in stocks as other technical trading tools and finding a clean looking pennant with a solid flagpole is rare.
However, the pennant pattern is an important one to take note of. Pennant patterns are often precursors of large price movements that traders can quickly leverage for plentiful profits.
Example 1: Penn National Gaming (PENN)
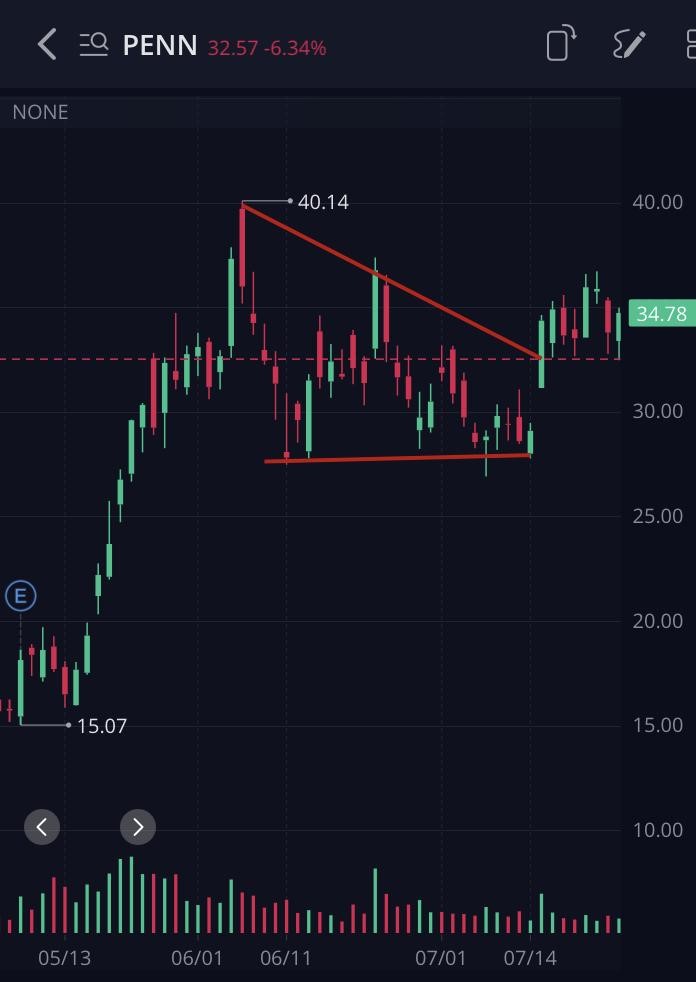
PENN was one of the hardest hit stocks in the initial phase of the COVID crisis, plummeting down under $5 per share.
However, with professional sports gearing back up and casinos reopening across the country, PENN has rebounded strongly.

PENN stalled around the $40 mark and traded in a range for the next few weeks, making lower highs but holding steady on the low end. A nice pennant formed from this price movement and PENN exploded back over the $30 mark by mid-July.
The flagpole and pennant trend lines were easily identifiable in this trade – it won’t always be so obvious though.
Example 2: NASDAQ 100 ETF (QQQ)
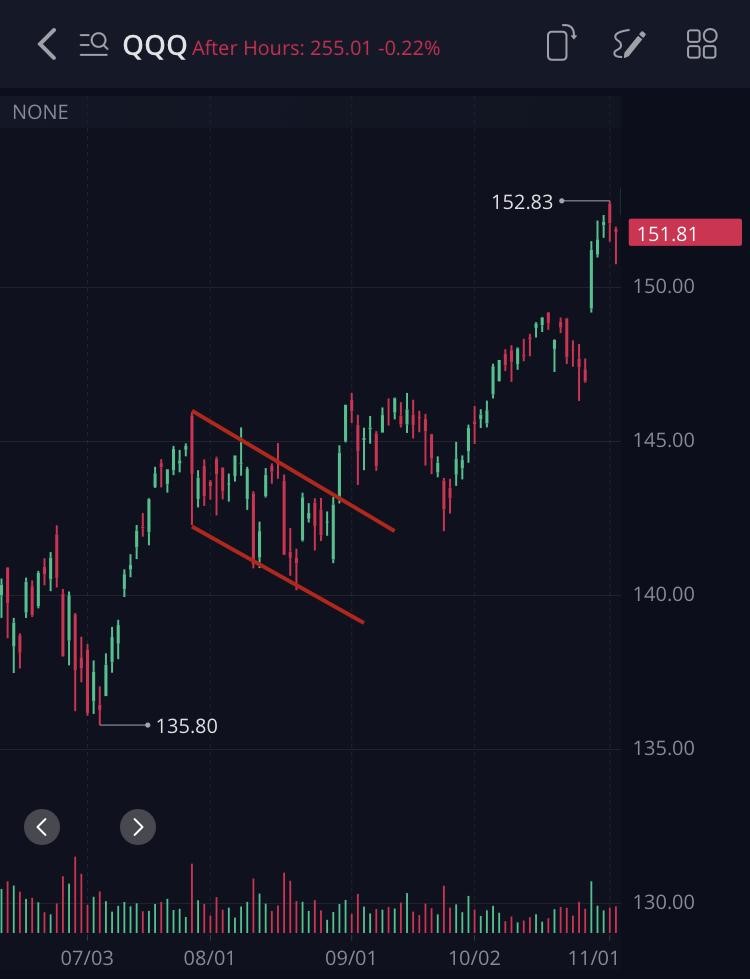
Volatile stocks aren’t the only ones making flag and pennant patterns. Check out this price movement from QQQ back in the summer of 2017.

After a big leg up in July, the ETF cooled in August, forming a flag pattern with two declining trend lines.
By September, the consolidation phase of the trend ended when the resistance level was broken in a series of three straight sessions with big gains. QQQ continued to move higher until the early months of 2018.
Example 3: Square, Inc. (SQ)
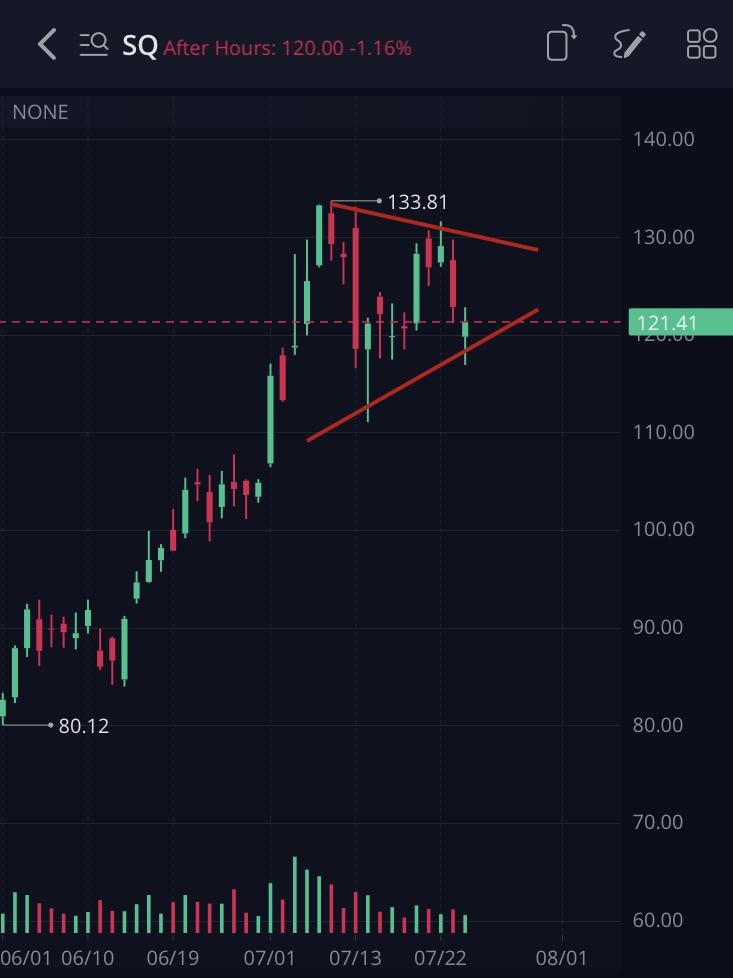
Here’s an example that’s yet to play out as of this writing.
One stock that has blown through any COVID concerns is mobile payments company Square, which made several new all-time highs in the early summer of 2020. After rocketing from the $80 range up through $133, the stock began to stall and consolidate.
A pennant pattern has been forming as shares record high lows and lower highs along the trend lines.

This could be a good opportunity to get into Square shares and ride the continuing wave of this stock. The trend is definitely still pointing up and the shares may only be taking a breather before the next move upward.
Tips for Trading the Pennant Pattern
Trading the pennant pattern isn’t a slam dunk – you’ll still need to remember a few rules and be cautious of false patterns. When you’re looking for something, it’s easier to see it when it’s not really there.
Keep these tips in mind while trading.
- Watch the volume – If the breakout you’ve anticipated occurs with high volume, it’s a good sign that you’ve found a profitable trade. Always keep an eye on volume levels when trading technical patterns.
- Have profit and loss targets – Don’t just blindly jump in a trade when you notice a pennant forming. Identify a good entry point, write down your goals of the trade, and be sure to sell when your profit target is reached. At the same time, cut bait quickly if the trade turns against you.
- Stick to the plan – Is there no defined flagpole on the pennant pattern you’re watching? Is volume drying up instead of increasing? Sometimes the best trade is the one you DON’T make. Never go against your strategy just because you’re antsy to trade. Keep calm and remember your goals at all times.
Bottom Line
The pennant pattern is one of the most recognizable technical trading signals, but that doesn’t mean automatic profits follow its every appearance.
Like any other type of technical analysis, the pennant pattern is one tool in the vast toolbox of trading knowledge. Never use a single pattern or signal as your sole reason for trading – always use technical analysis techniques in conjunction with one another.
Ideas like volume, support and resistance, and breakouts all flow together to form competent trading styles.


