1. Are your plots relevant to the current price?
Alright, look.
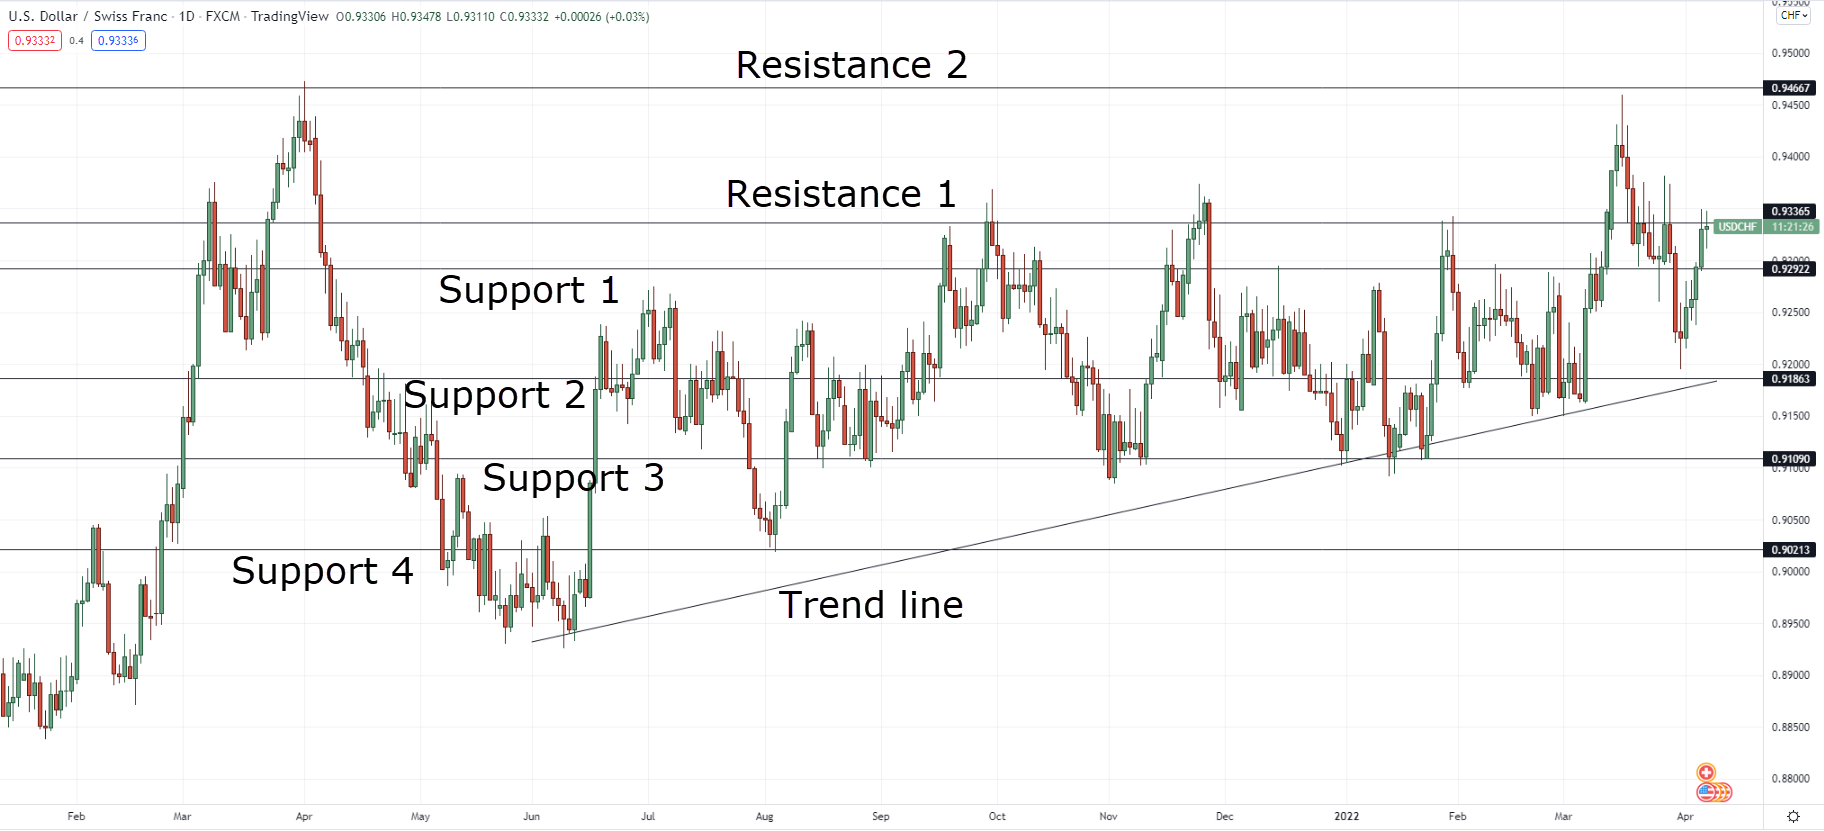
If the current market price is here:
There’s no point in plotting every single support & resistance and trend line you see.
Why?
Because by the time you get out of your trade, there’s a low chance that price is likely to reach those levels anyway!
Also, having too much “information” on your chart gives you too many unnecessary options when deciding when to enter a trade, therefore degrading the outcome of your trading decisions.
Instead…
Keep your charts clean and know why your lines are there.
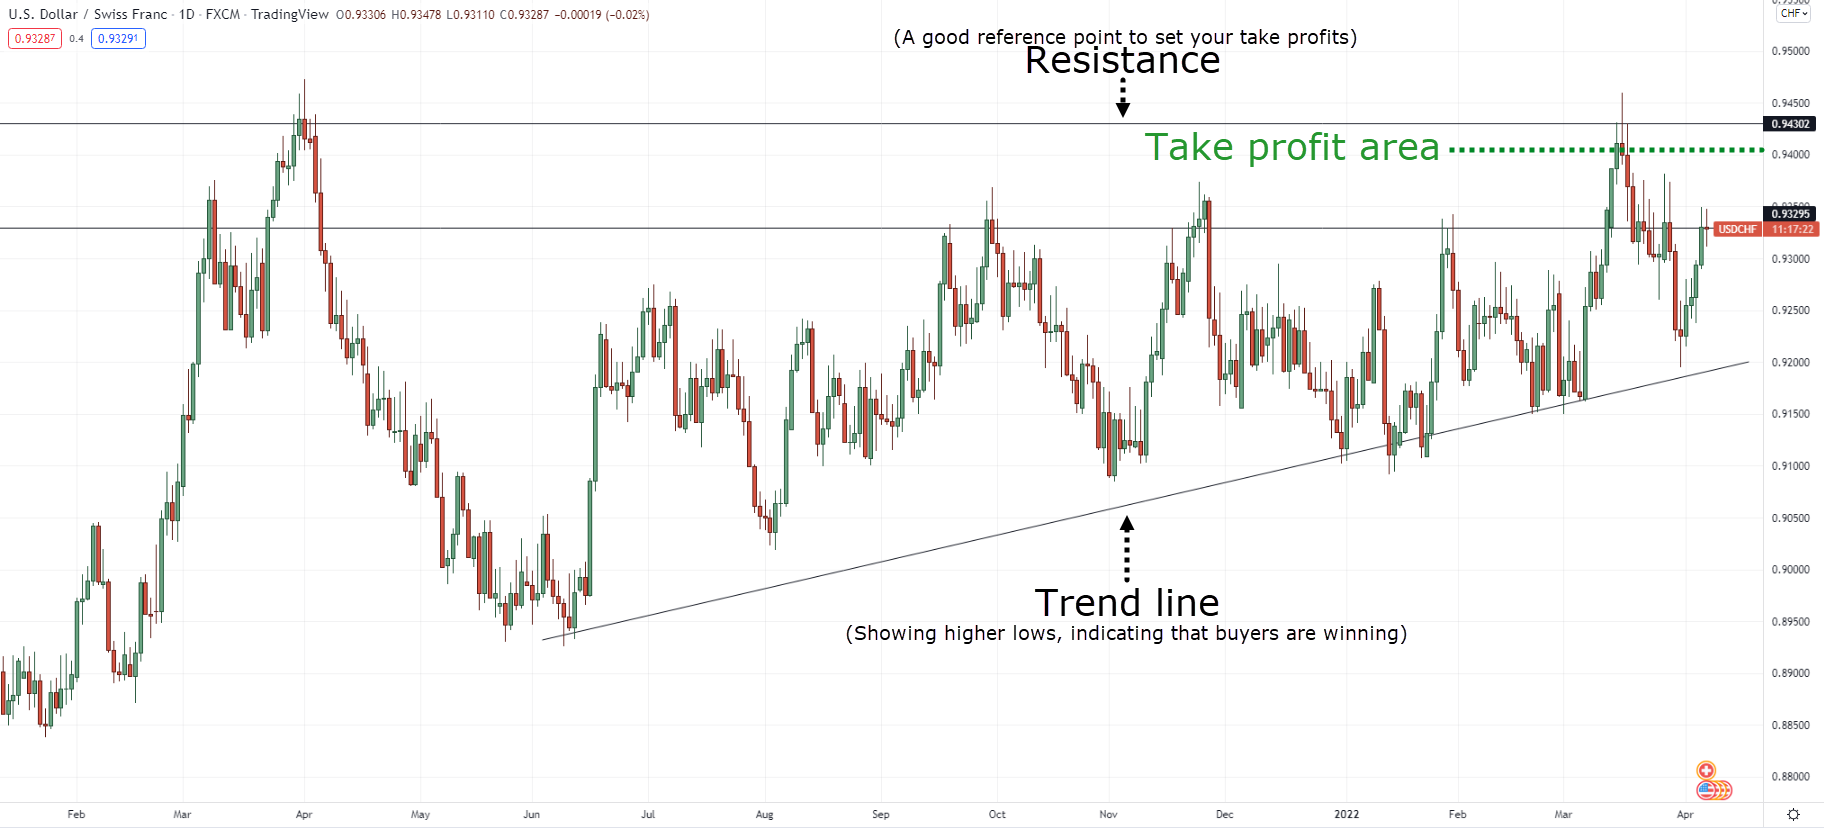
So clean, so good, am I right?
2. Is your trading setup simple and relevant to the current market condition?
After you’ve plotted relevant lines on your chart, what’s next?
Know whether it’s in an uptrend, downtrend, or range.
Looking at GBPJPY on the daily timeframe:
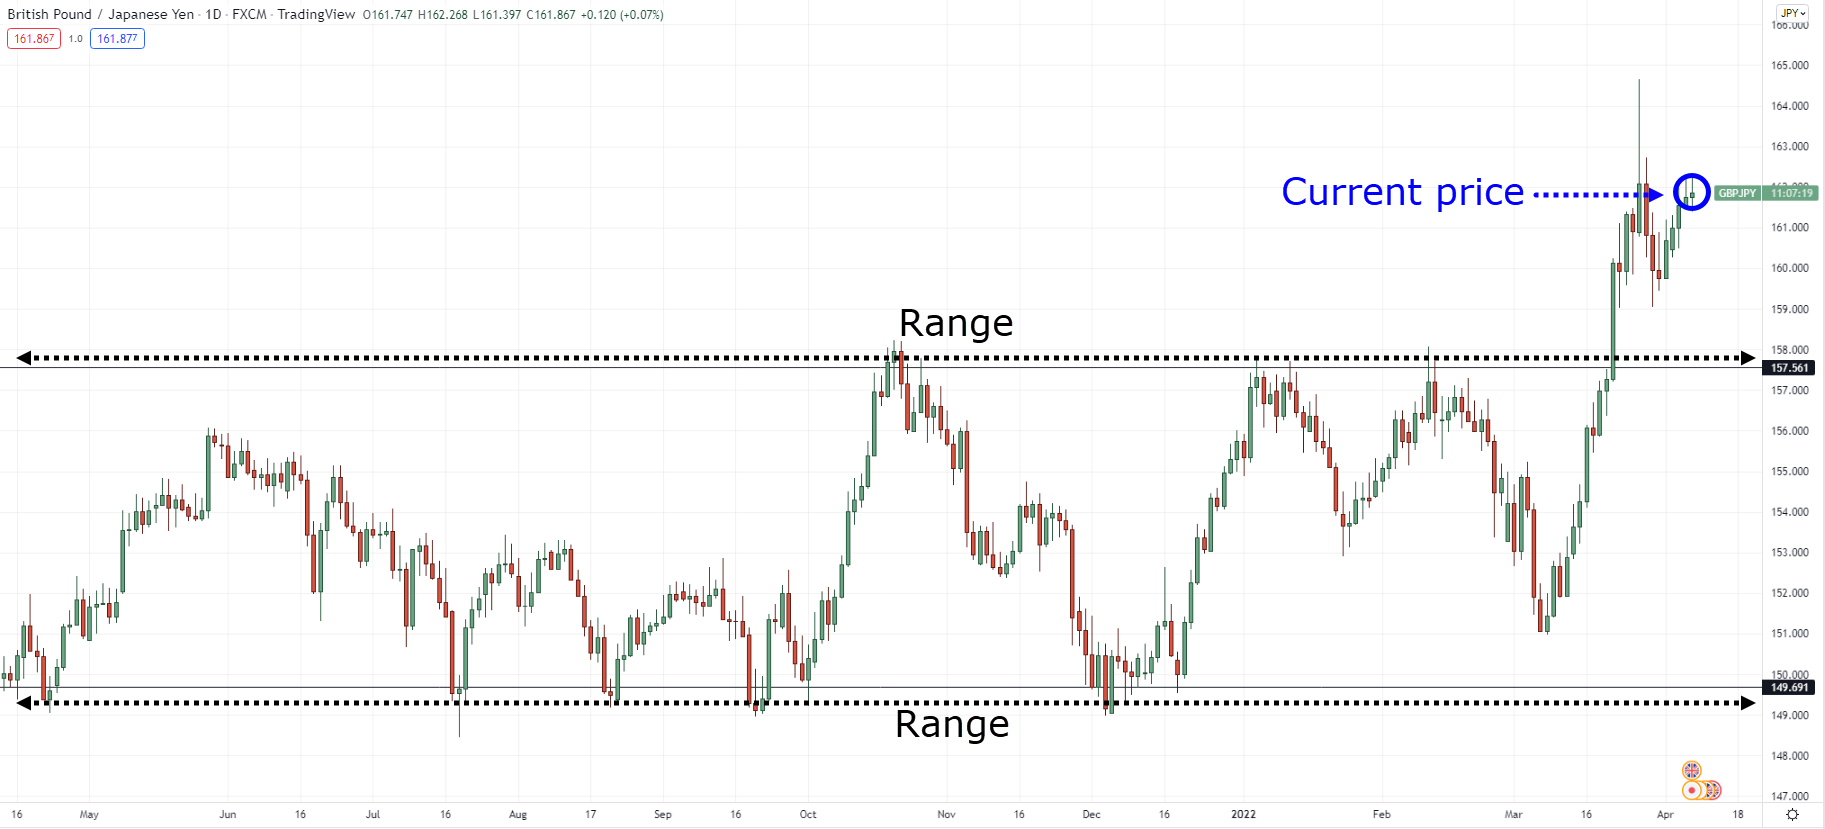
You can see that the price has broken out of its range.
Now, looking at the current price, what is the “current” state of this forex pair?
Well?
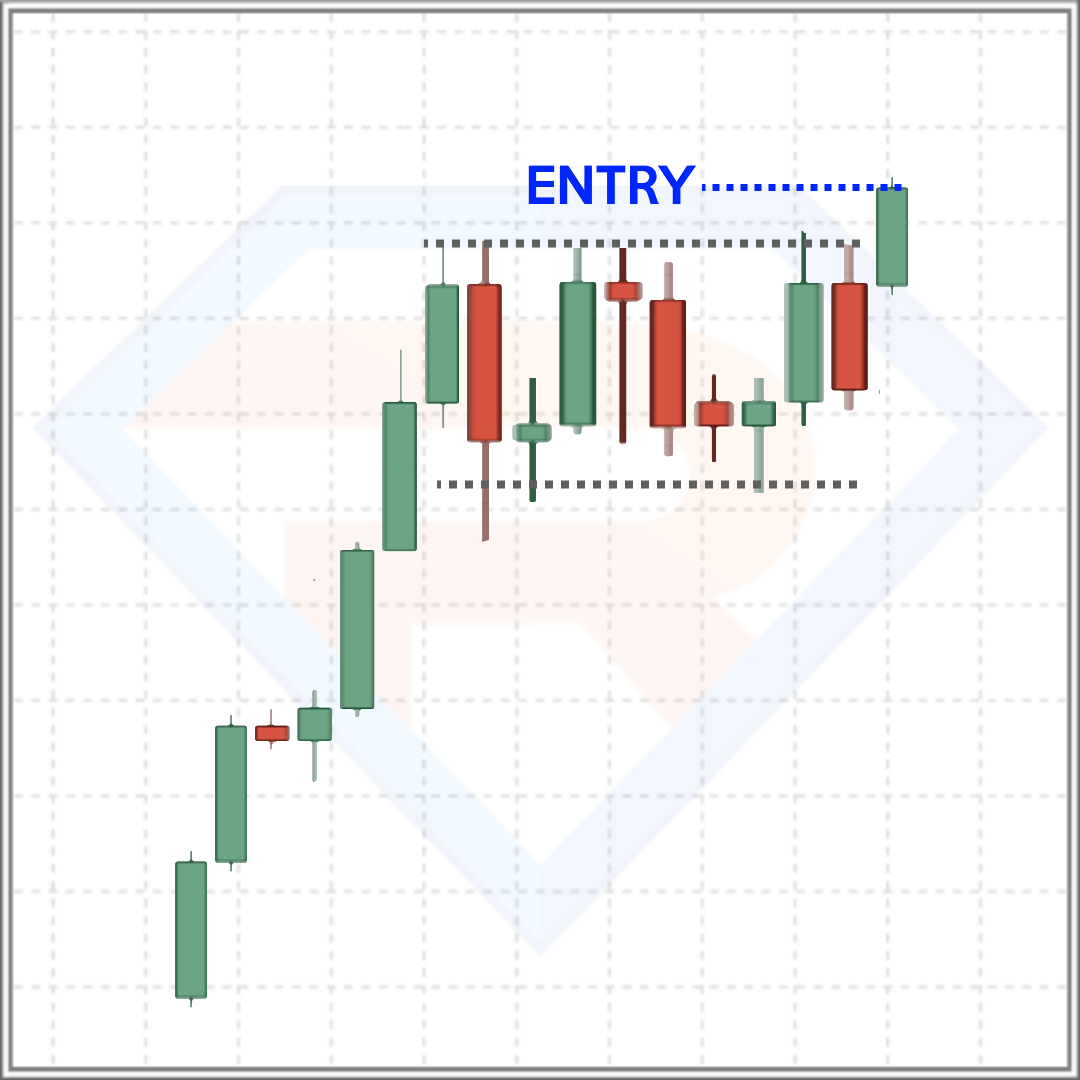
It’s about to be in an uptrend, so if you want to hop onto the trend, then having a breakout setup can be your superpower:
Want one more example?
Sure.
Here’s EURCHF on the 4-hour timeframe: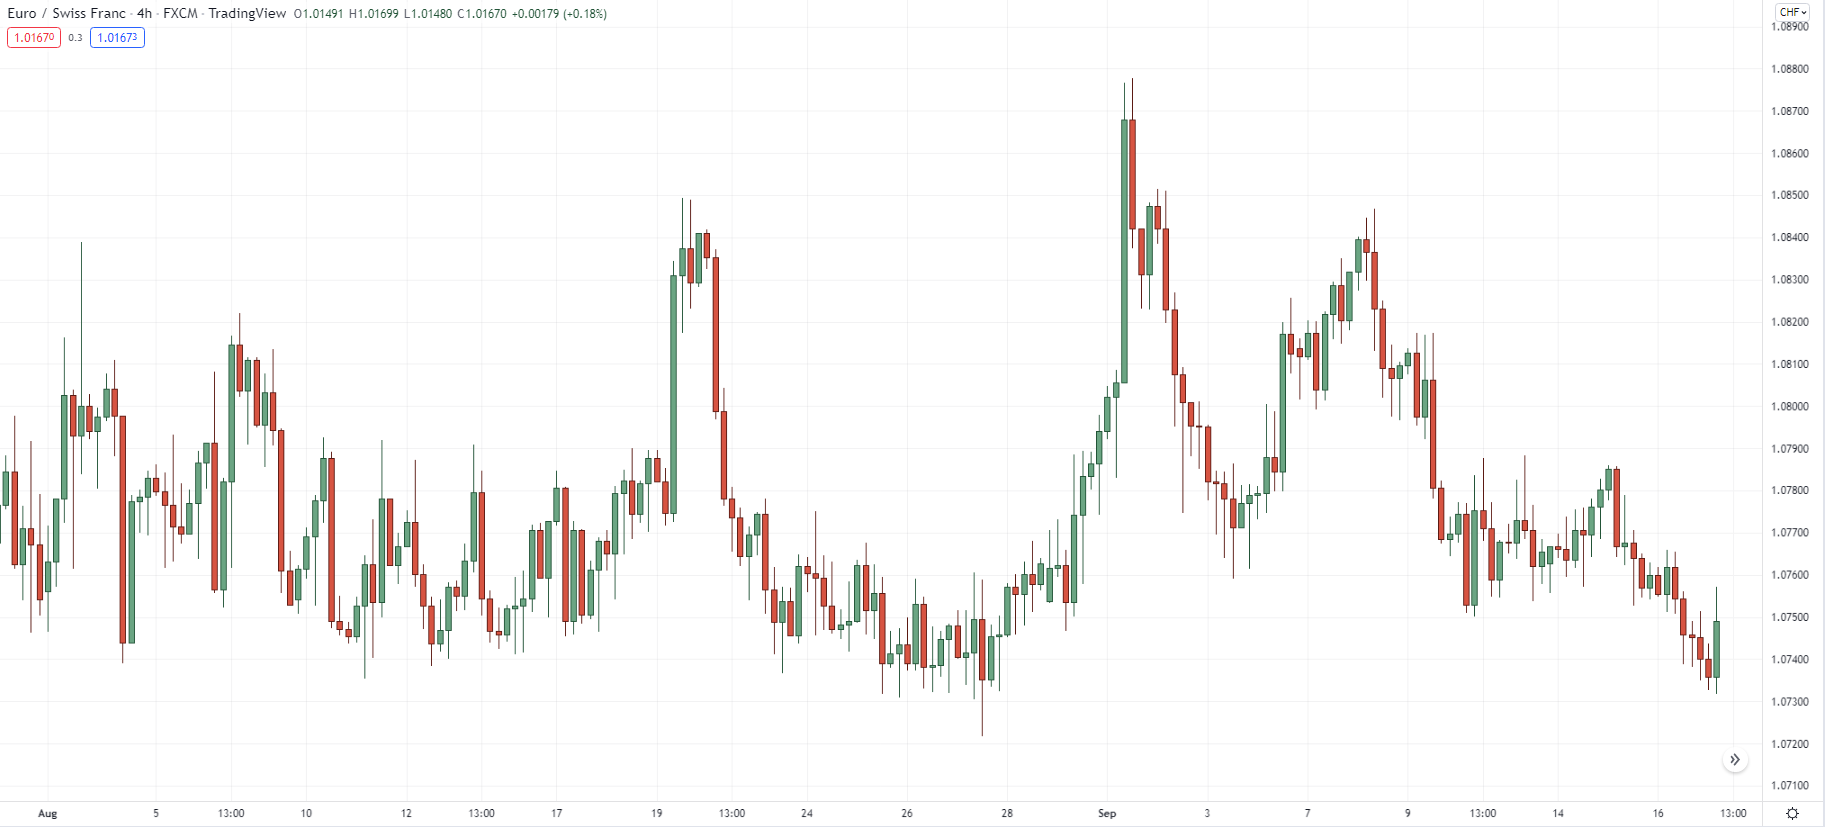
Now that’s one choppy market.
But what’s the first thing you should do?
Correct, plot out relevant lines!
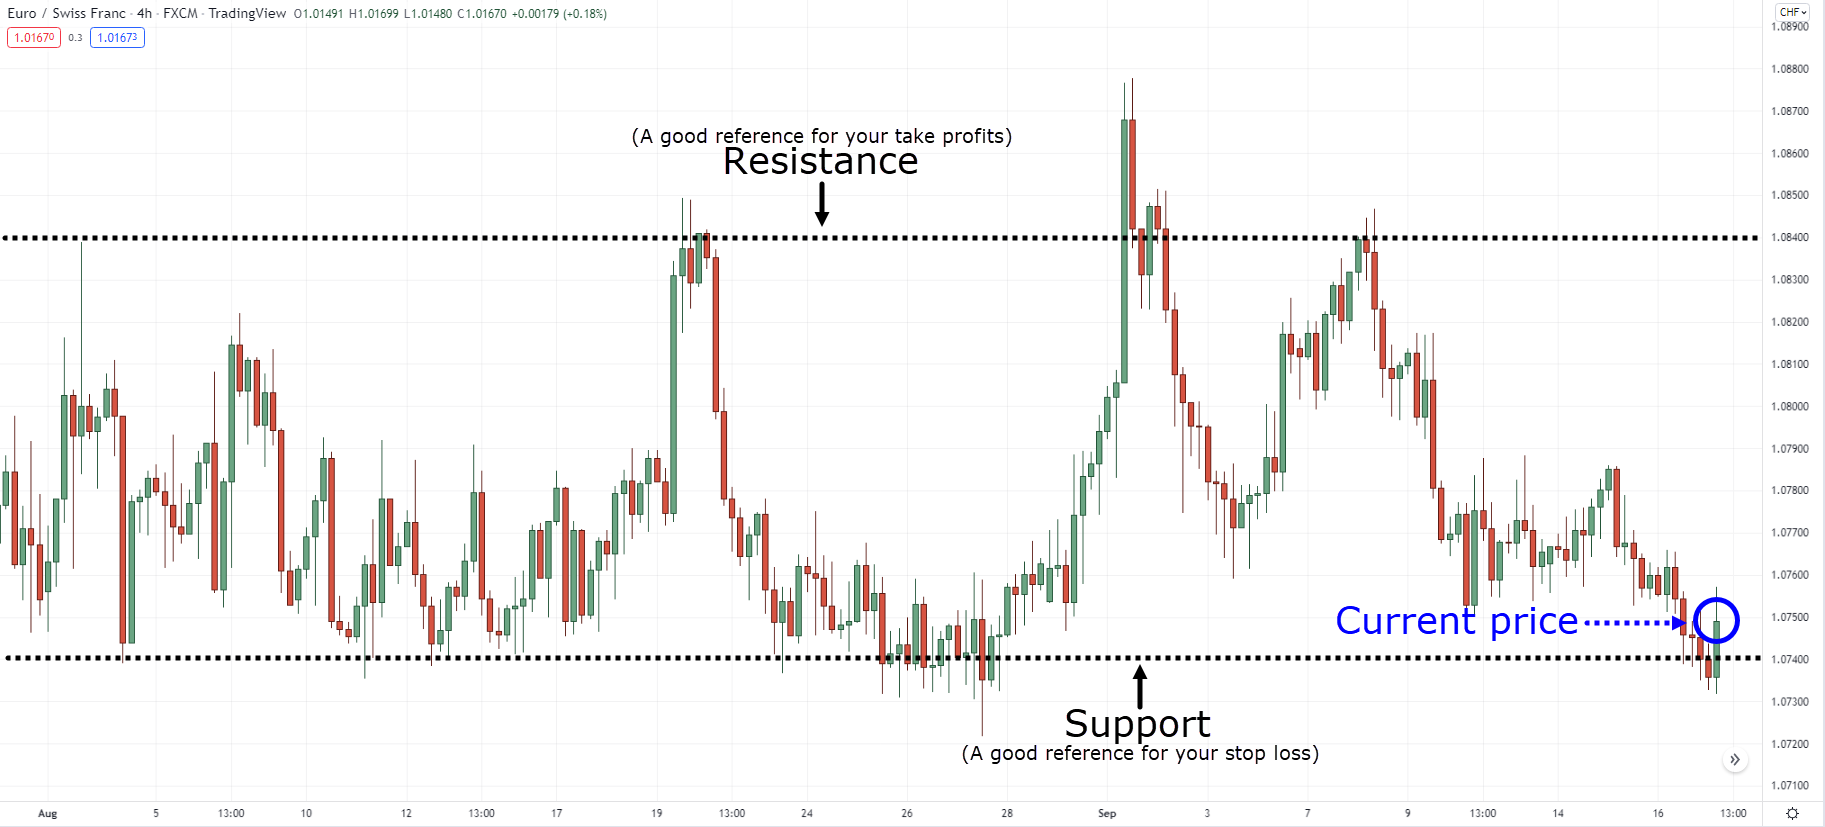
Next, what trading setups are appropriate for this kind of market condition?
That’s right, entering on pullbacks (buying at support, and selling at resistance):
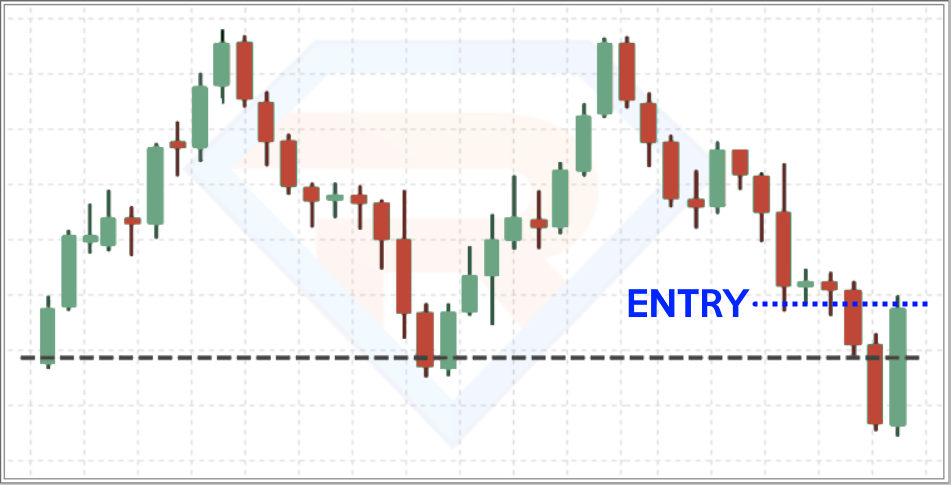
There you go!
3. Are there barely any conflicting information about your trade?
To be honest…
You’re all set with the first two.
However, not only you must know when to enter trades, but also how to ignore them.
Yes, in every single chart that you will see, you must have the “walk-away” power.
What does that mean?
It means that when you’re in doubt, you won’t hesitate to stay out and skip the trade (even if it might go in your favor).
Let me share with you an example…
As you can see on USDZAR on the daily timeframe:
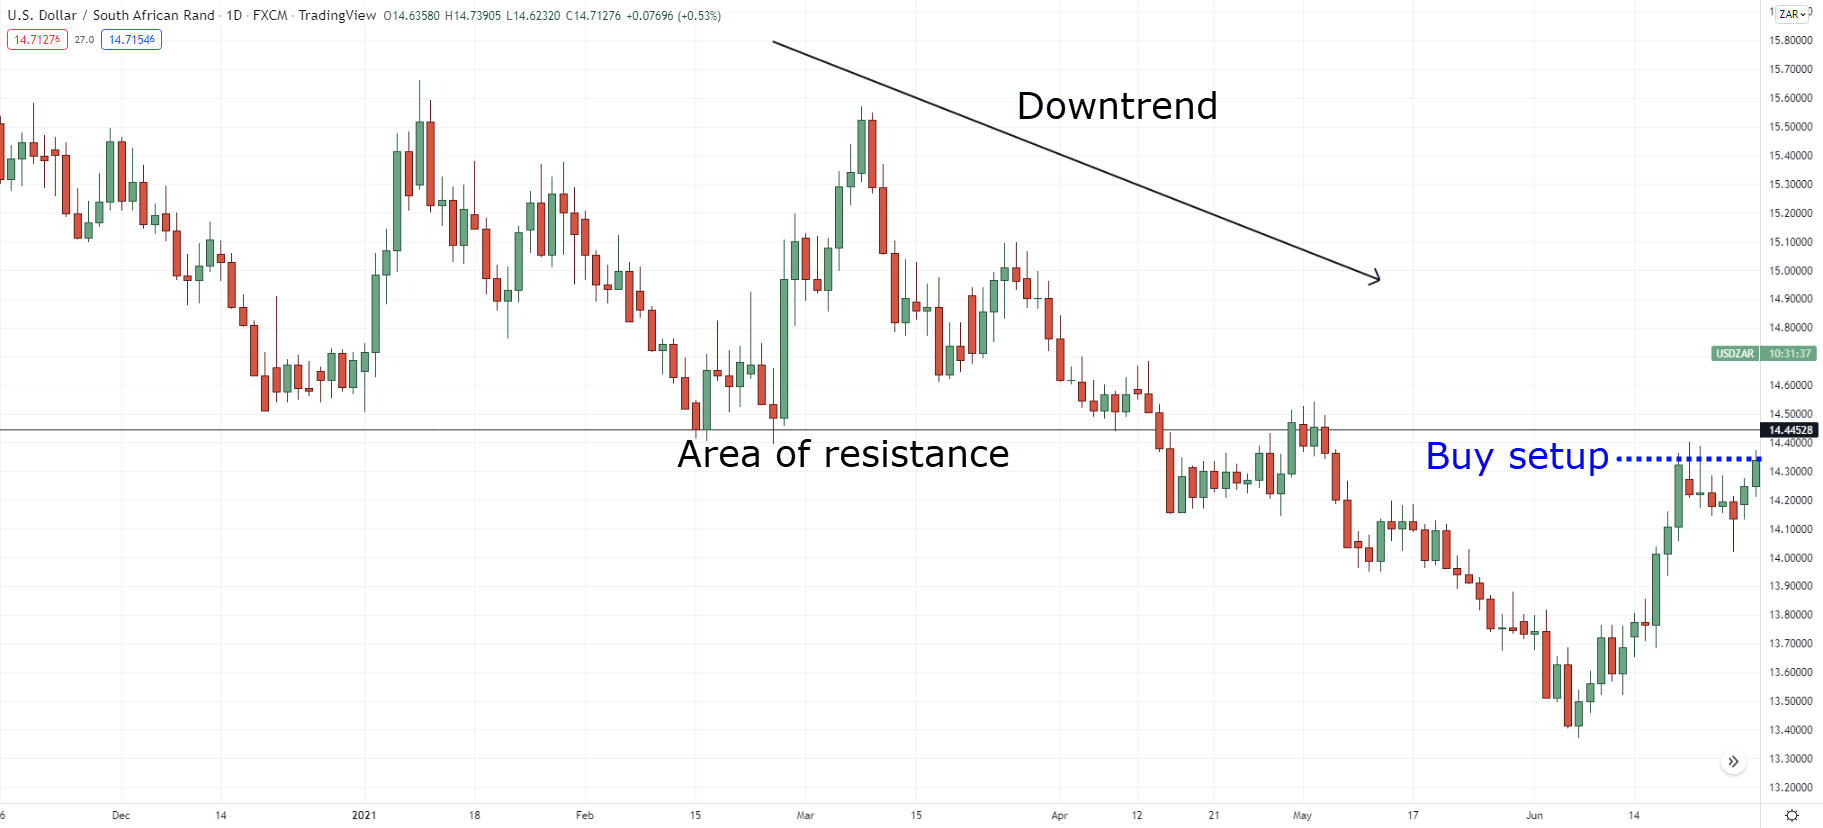
You have spotted a nice breakout signal.
However, the price is currently approaching an area of resistance (a place where potential sellers might come in) while the general direction of this market is in a downtrend.
So right now, you can see that there are multiple factors “against” your trading idea.
What do you do?
Correct. Ignore the trade and stay out!
Good trades happen when decisions are made swiftly without hesitation.
Remember that!
So with that said…
What’s next?
How do you “test” this?
One word…
Repetition.
Yes, I’ve shared with you a lot of charts today.
But in the real world of trading, every chart you see will greatly vary from each other.
It’s why I’ve shared with you a 3-step framework to make decisions better as a price action trader.
So, as you are now looking at past prices (backtesting) here’s what you need to do next.
Screenshot your trades and review your thought-process
Taking a screenshot as you enter your trade is helpful as it encapsulates your thought process when selecting trades (and also it helps you test the framework that I have shown you).
Each screenshot doesn’t have to be complicated for each trade, it can be as simple as this:
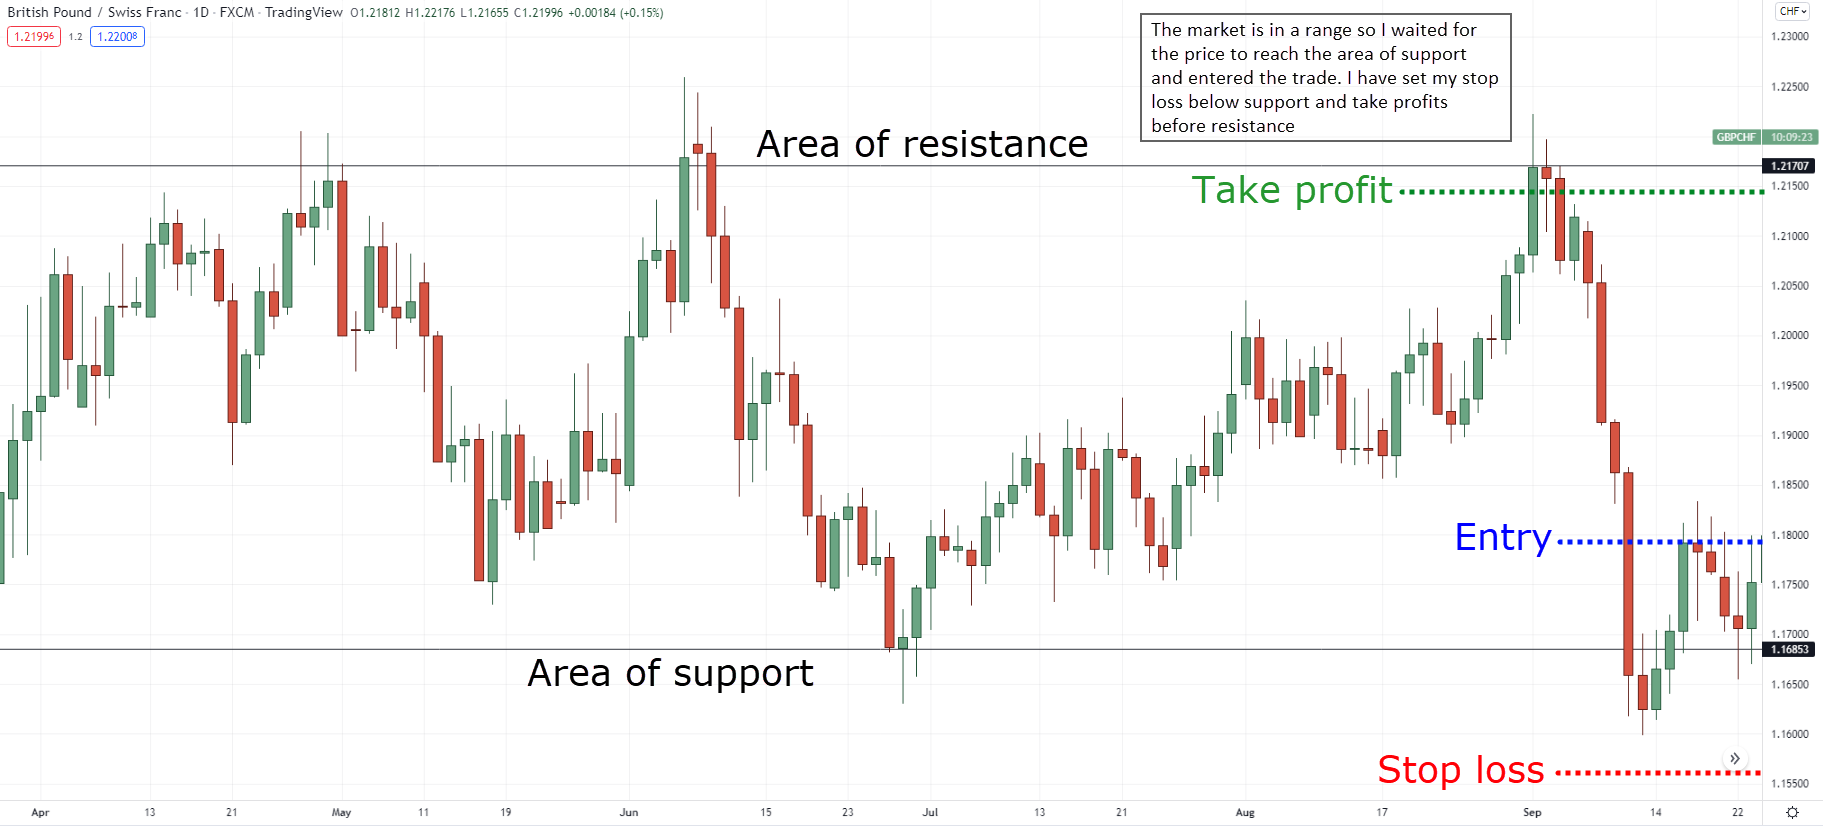
Simple and clean!
Now as a general guideline, I highly suggest you at least:
- Produce more than 100 historical trades with screenshots of your thought process
- A maximum of 10 trades per market (so that you’re able to be exposed to different types of the market)
- Have a trading software or platform that hides prices by default (to avoid being biased)
There you go!
But before I end…
Let me share with you a couple of trading tools that you can use to manually practice the 3-step framework that I’ve shared with you.


