3 things you must know about reversal chart patterns that nobody tells you
Here’s the deal:
Every reversal chart pattern has 3 components to it.
If you know what they are, then you can tell when the market is about to make a reversal without memorizing a single chart pattern.
Cool?
Then let’s get started…
#1: Trending and retracement moves
Trending move: The “stronger leg” of an uptrend that moves in the direction of the trend.
Here’s an example:
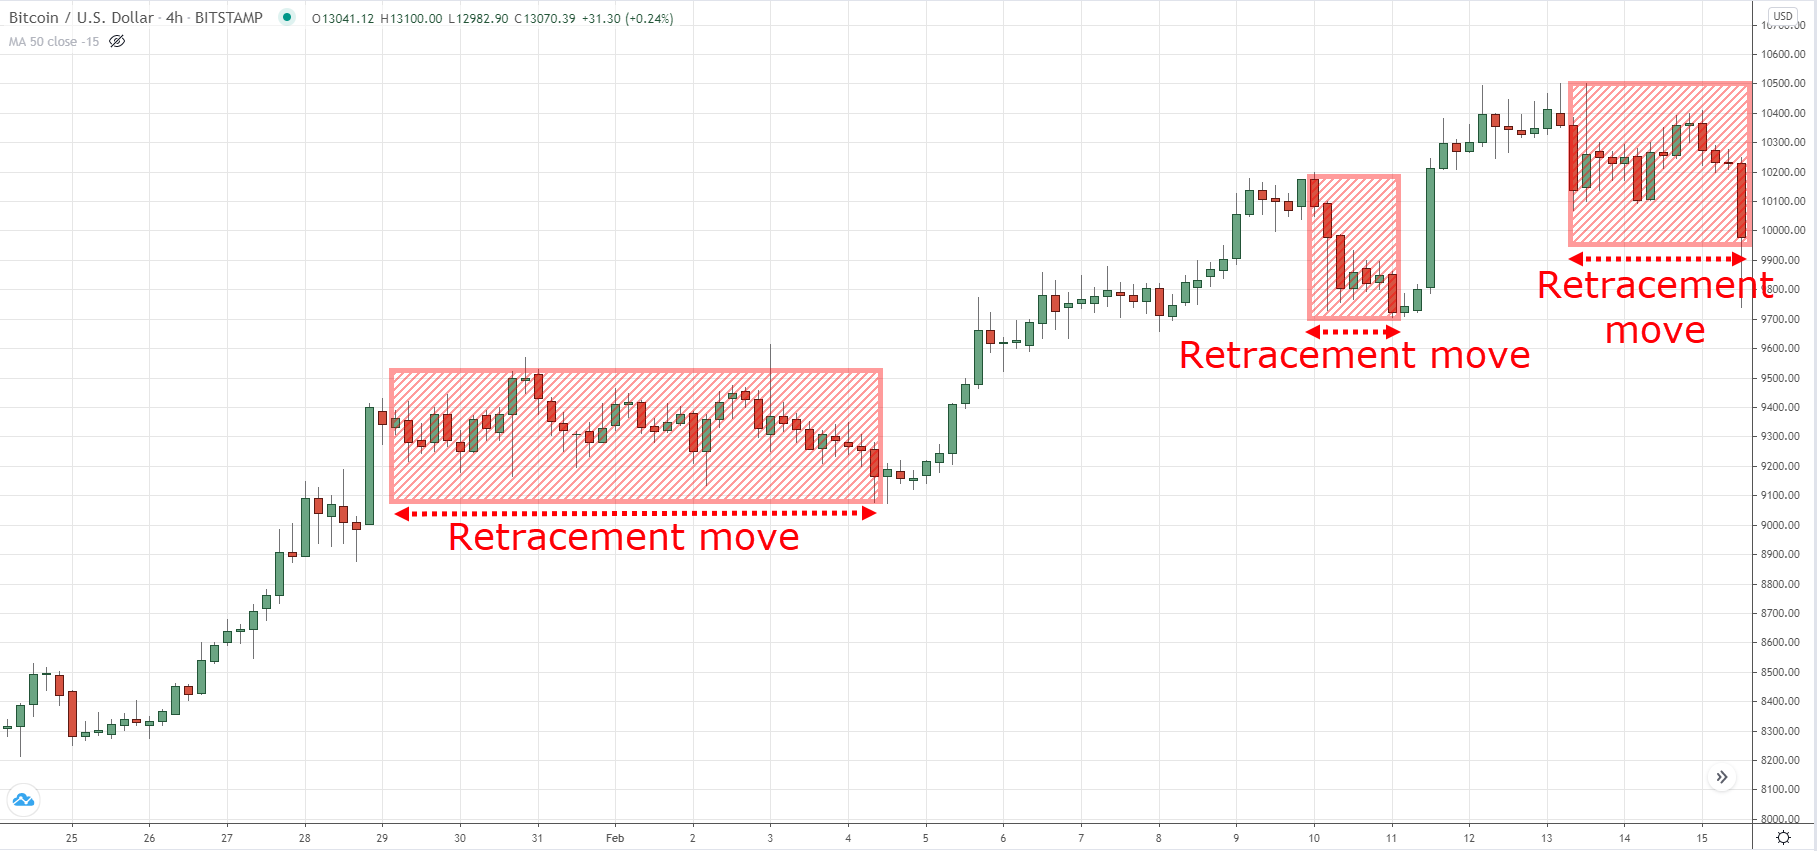
Retracement move: The “weaker leg” of an uptrend, otherwise known as a pullback or retracement.
Here’s an example:

Now you might be wondering:
“Why do I need to know trending and retracement moves?”
That’s because it gives you a clue into the strength & weakness of a market.
For example:
In a healthy trend, you should expect the trending move to consist of bullish candles which are larger than the retracement move.
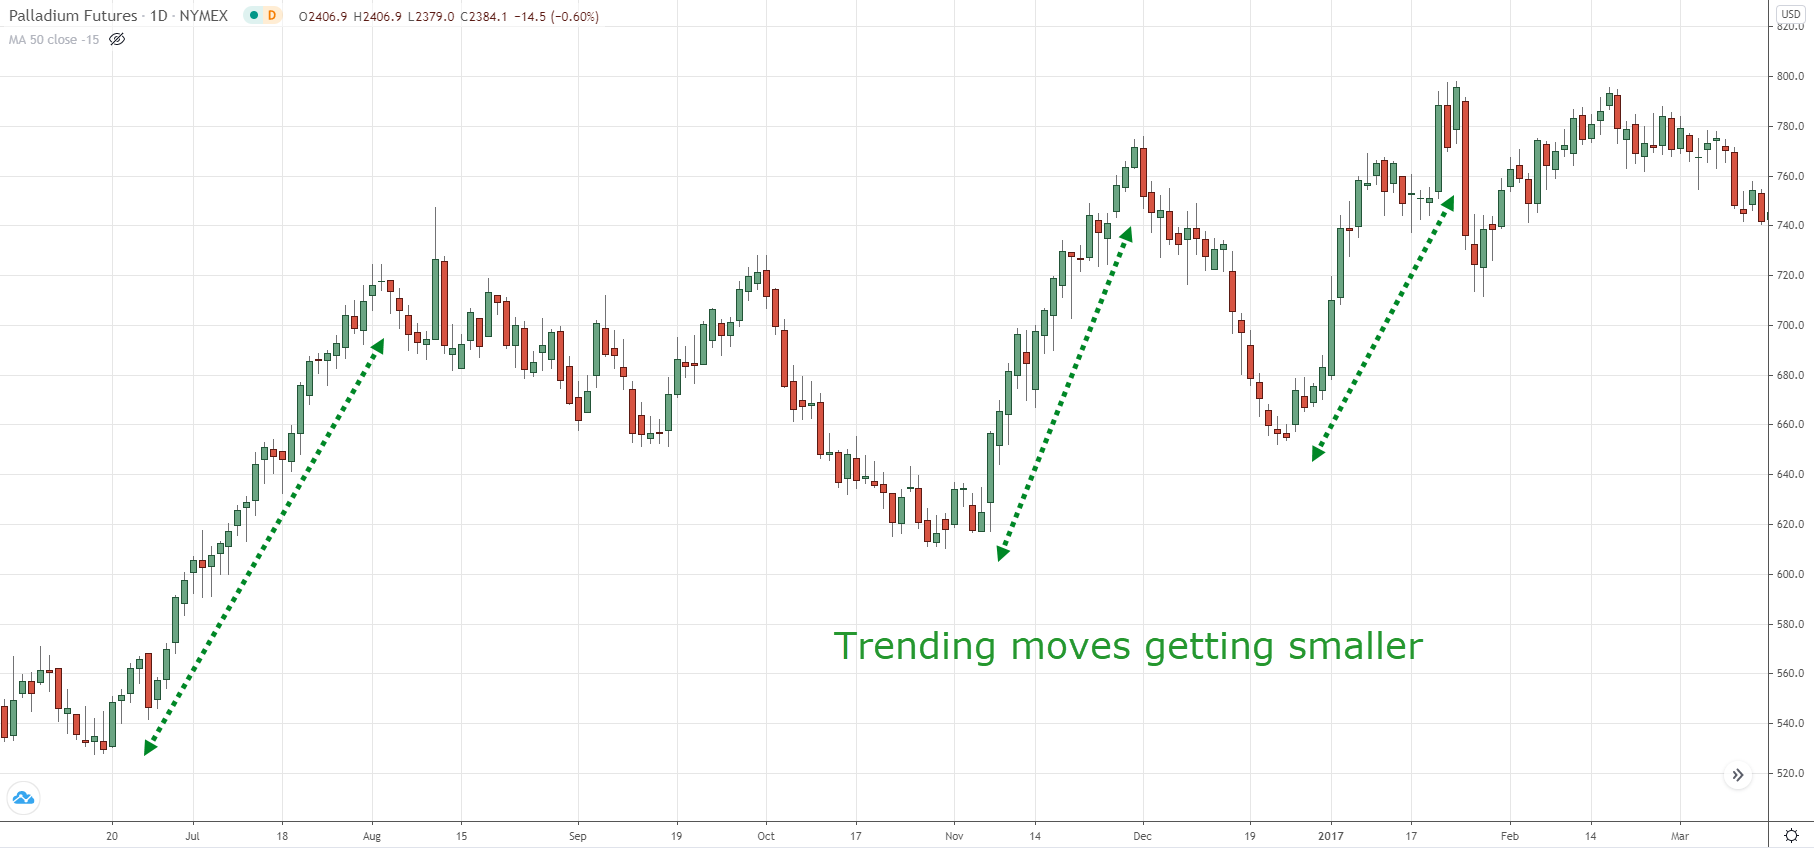
However, if you start seeing the candles of the trending move getting smaller relative to the retracement move, it’s a sign the strength of a trend is getting weak.
Here’s what I mean…

Next…
#2: Higher lows and lower highs
This is straightforward.
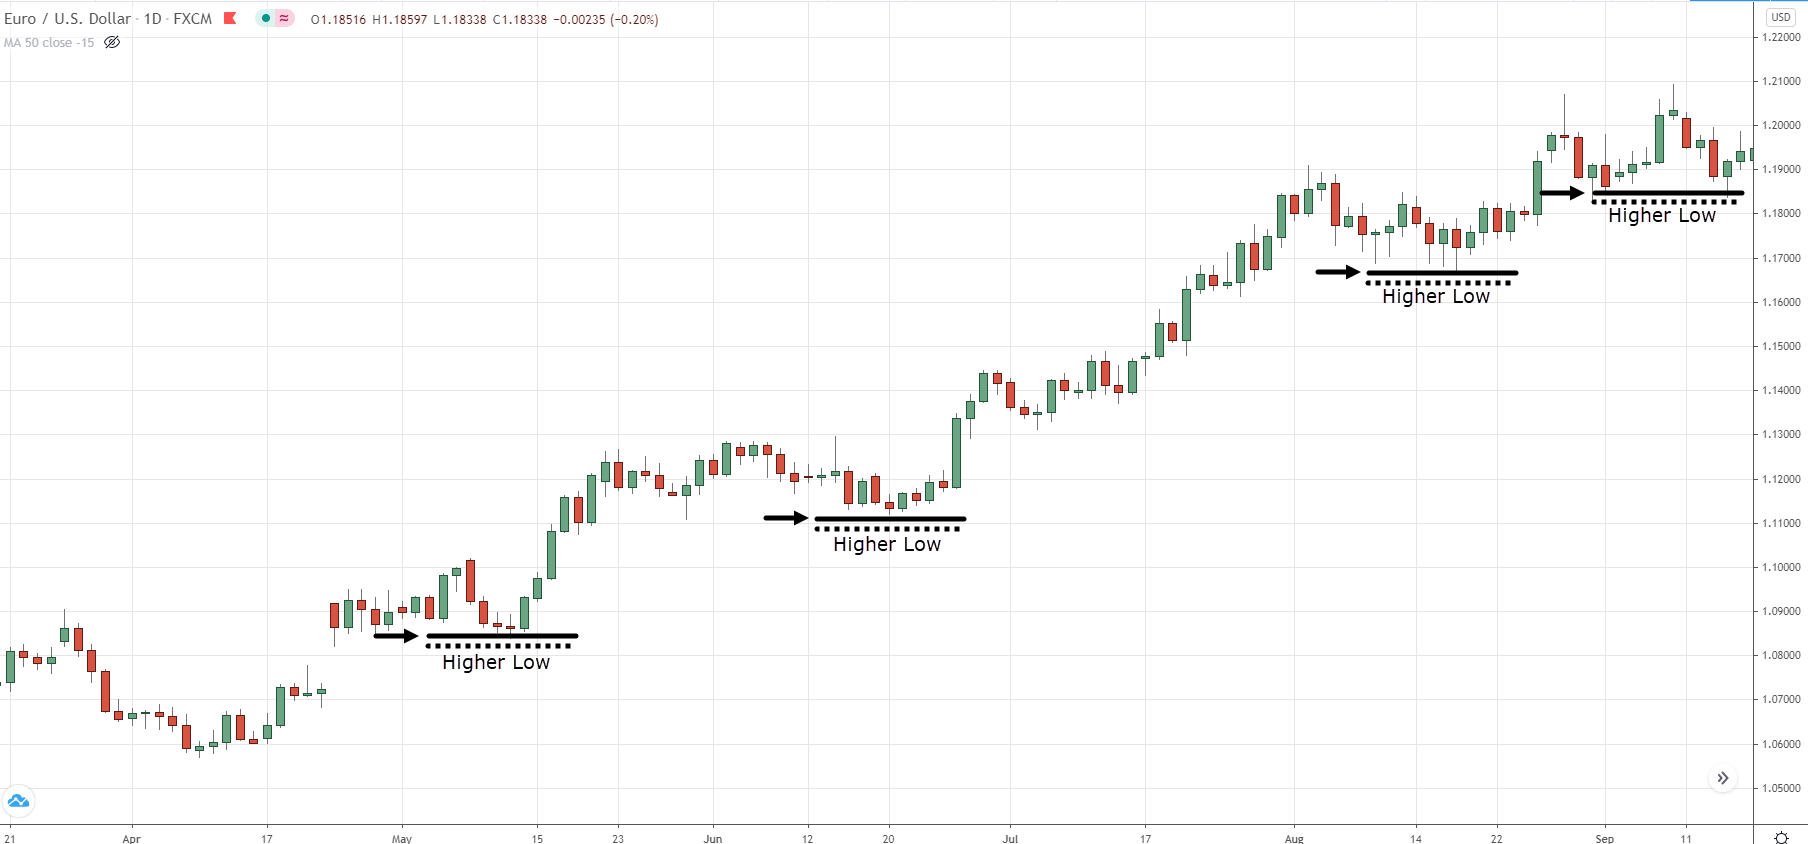
When you see a series of higher lows, it’s a sign of strength as it tells you the buyers are willing to buy at higher prices.
An example:

(Likewise, when you see a series of lower highs, it’s a sign of weakness as it tells you the sellers are willing to sell at lower prices.)
Now just because you see a series of higher lows doesn’t mean it’s a bullish reversal because it could just be a pullback.
(I’ll explain more about continuation patterns and reversal patterns later.)
That’s why we are looking at multiple factors when it comes to reversal chart patterns which bring me to my next point…
#3: Time factor
Here’s the deal:
The more time the market spends forming a reversal chart pattern, the more significant it is.
For example, if you compare a head and shoulders pattern that takes 30 candles to form against another that takes 100 candles to form.
Which is more significant?
Of course, it’s the one with a longer duration.
Why?
Two reasons.
#1: It’s more obvious and attracts attention from more traders.
#2: More resting orders are placed around the neckline of the head and shoulder patterns (from bullish traders who expect support to hold or, short traders looking to sell the breakdown).
Whatever the case is, the longer it takes for reversal patterns to form, the more significant it is.
Next…
Let’s use these 3 components you’ve just learned and apply it to some of the common reversal chart patterns so you can see how it works.


