If you’re new to trading…
Simply looking at squeaky-clean charts to execute your trades can be pretty daunting.
You’re not quite sure if the trend will continue or if the market is about to reverse.
I totally feel you buddy.
That’s why in today’s guide, I’ll dive into the Money Flow Index so you can trade trend continuations and trend reversals like a pro.
Here’s what you’ll discover:
- What is the Money Flow Index in trading
- Why you should start using the Money Flow Index to level up your trading
- Avoid making these common mistakes when using the Money Flow Index
- How to use Money Flow Index so you won’t second guess your trades ever again
Let’s get started, shall we?
What is the Money Flow Index in trading
The Money Flow Index (MFI) is a type of momentum oscillator.
Just like other momentum oscillators, it easily gives you a sense of when the prices are overbought or oversold in a particular market.
However…
Deriving the MFI’s value isn’t as straightforward compared to the Moving Average.
If you’re curious, here’s how it’s derived:
Typical Price of a period = (Close + High + Low Prices) / 3
Money Flow of a period = Typical Price of a period x Volume of a period
Money Flow Ratio = 14-period Positive Money Flow / 14-period Negative Money Flow
Money Flow Index = 100 – [100 / (1 + Money Flow Ratio)]
That’s quite a mouthful, wasn’t it?
Don’t worry.
You don’t have to memorise all those mumbo-jumbo.
The key thing you must know is that the MFI considers the volume data to compute its values. (More on this later.)
What does the Money Flow Index Indicator look like?
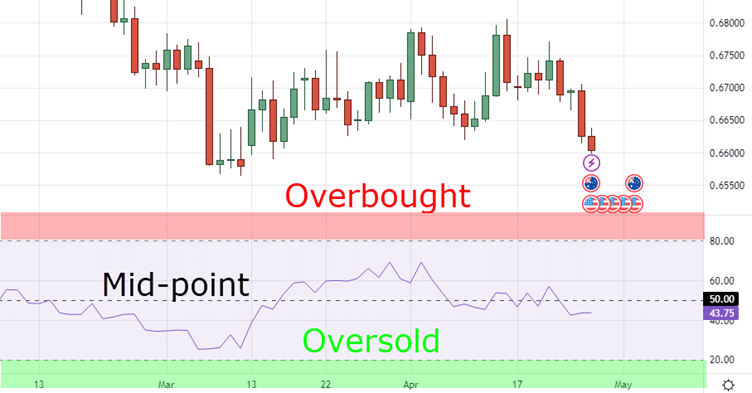
If you have TradingView, here’s what the Money Flow Index looks like with default settings:
And if you look closely there are 3 parts to it:
- Overbought area above MFI 80
- Mid-point at MFI 50
- Oversold area below MFI 20
Next…
Why you should start using the Money Flow Index to level up your trading
By now you should have realised:
The Money Flow Index Indicator looks very similar to the Relative Strength Index (RSI) Indicator.
If you stack both the MFI and the RSI on top of each other in TradingView…
You can hardly tell the difference.

But here’s how they differ:
- The Money Flow Index (MFI) takes into account both volume and price data
- Whereas the RSI only takes into account price data
This means that if you’re a trader who typically includes volume in your trade analysis, then the MFI indicator is what you’ll really like.
On the other hand, if you’re a trader who only likes to look at price but not volume, then the RSI indicator will suit you better.
Honestly…
None of these momentum oscillators is better than the other.
Either of them will get the job done.
However, if you’re just starting out and want more conviction before taking a trade—the Money Flow Index indicator is the one for you.
Moving on…
Avoid making these common mistakes when using the Money Flow Index
Just because the Money Flow Index takes into account volume and has a slightly more complex way of deriving, doesn’t make it a “better version” of the RSI.
A common mistake that new traders make is that they think the MFI is the holy grail since it has volume data.
They would blindly hit buy when the MFI = 10 (oversold) and blindly hit sell when the MFI = 90 (overbought).
The thing is…
You can’t just use an indicator in insolation as your “trade signal” thinking you’ll become consistently profitable.
You’ll need a few other confluent factors before taking on the trade.
(I’ll explain more in the next section.)
Another common mistake rookie traders make is that they over-read into every little peak and trough of the Money Flow Index.
Their eyes focus on random areas of the chart and the MFI indicator, looking for all sorts of divergence between the price and the MFI.
You don’t have to do that.
For the best risk-reward:
Just squint your eyes a little, and focus on the obvious peaks and troughs near the oversold and overbought areas for your analyses.
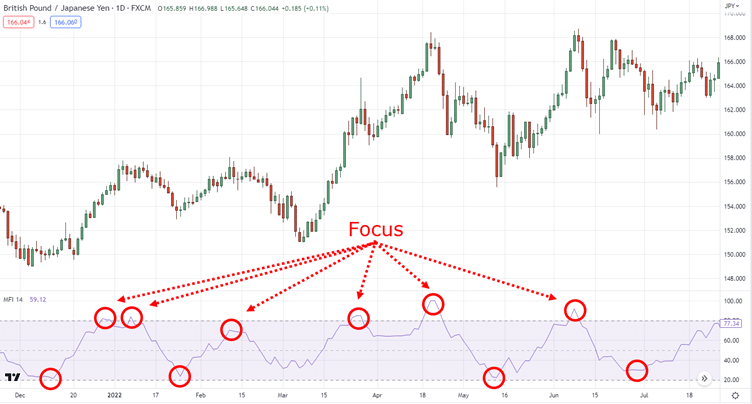
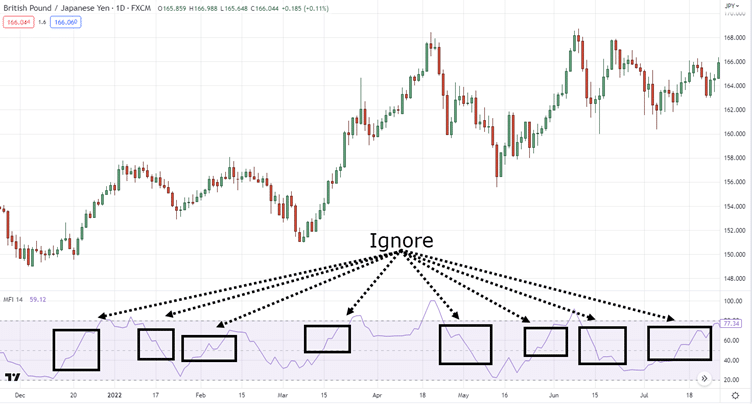
Keep it simple and don’t overthink it.
Got it?
Moving on…
How to use Money Flow Index so you won’t second guess your trades ever again
In this section…
I’ll share 3 main techniques you can use to include the Money Flow Index in your trading process:
- Using MFI mid-point for trading strong trend continuation
- Using MFI overbought or oversold areas for trading healthy trend continuation
Let’s get started.
1. Using MFI mid-point for trading strong trend continuation
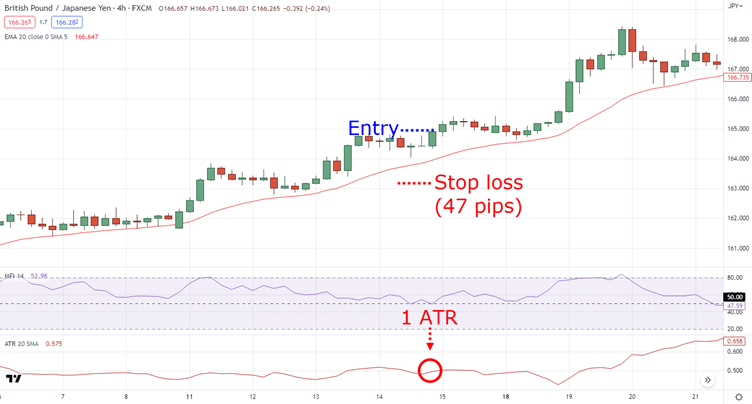
A market in a strong trend usually has a shallow retracement not exceeding the 20MA.
In strong bullish market conditions, it’s almost impossible for the Money Flow Index to reach oversold areas at MFI less than 20.
What you can do instead is to wait for the MFI to retest the midpoint 50, while the price pulls back slightly to form a bull flag.
Your entry trigger can then be a bullish candle close and you’ll enter at the next candle open.
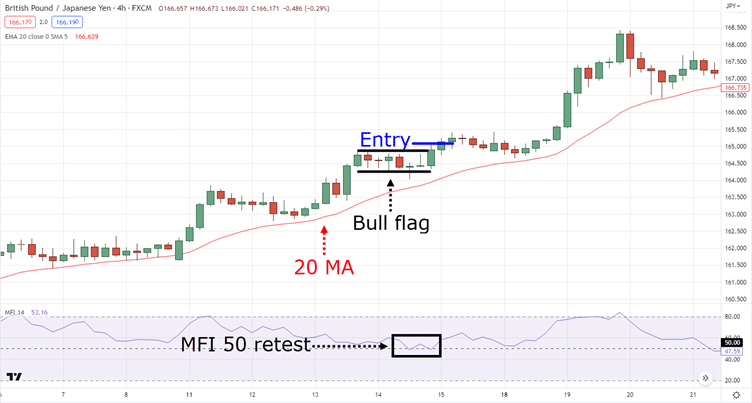
You can then place your stop loss 1 ATR below the lows of the bull flag.
Next…
2. Using MFI overbought or oversold areas for trading healthy or weak trend continuation
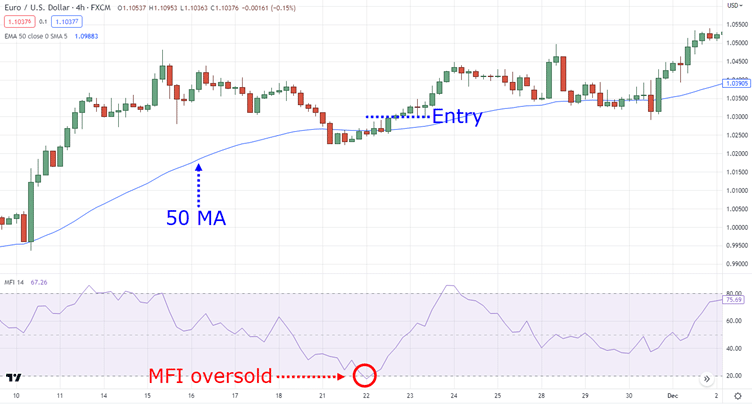
In a healthy or weak trend, the price usually has steep retracements back to the 50 MA or even previous resistance turned support.
In such a healthy bullish market condition, you can often expect the Money Flow Index to reach the oversold area at MFI less than 20.
You can then look for a valid entry trigger such as a close above the previous resistance turned support or the 50 MA.
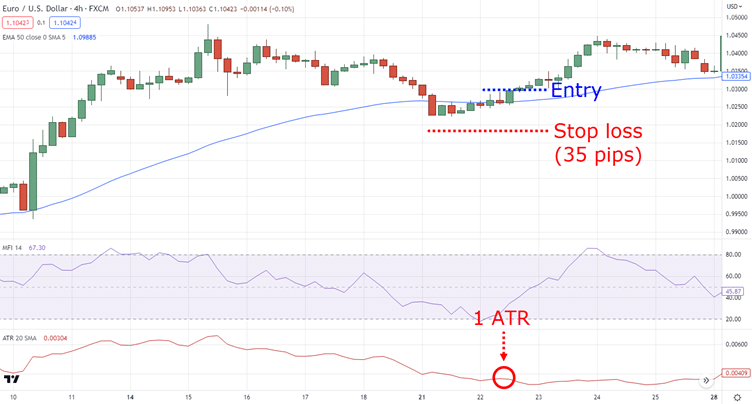
Similarly, your stop loss can be 1 ATR below the recent swing low.
Conclusion
Here’s a quick recap of what you’ve learned today:
- The Money Flow Index is a type of momentum oscillator like the Relative Strength Index
- The Money Flow Index takes into account volume and price data while the Relative Strength Index only accounts for price data
- Avoid blindly entering into positions simply because the MFI is oversold or overbought
- Combine the MFI with market structure and moving averages as part of your trade plan for high-conviction trades
Over to you now…
Have you used the Money Flow Index Indicator before?
How do you use it in your own trading?
Let me know in the comments below.


