This post is written by Jet Toyco, a trader and trading coach.
In the world of trading…
…there are certainly a lot of chart patterns out there.
From crabs to dinosaurs, these chart patterns are probably the most popular:
And for sure…
They might be all you need to succeed as a price action trader.
But one pattern that stands out and is simple and straightforward to spot, is the ABCD pattern…
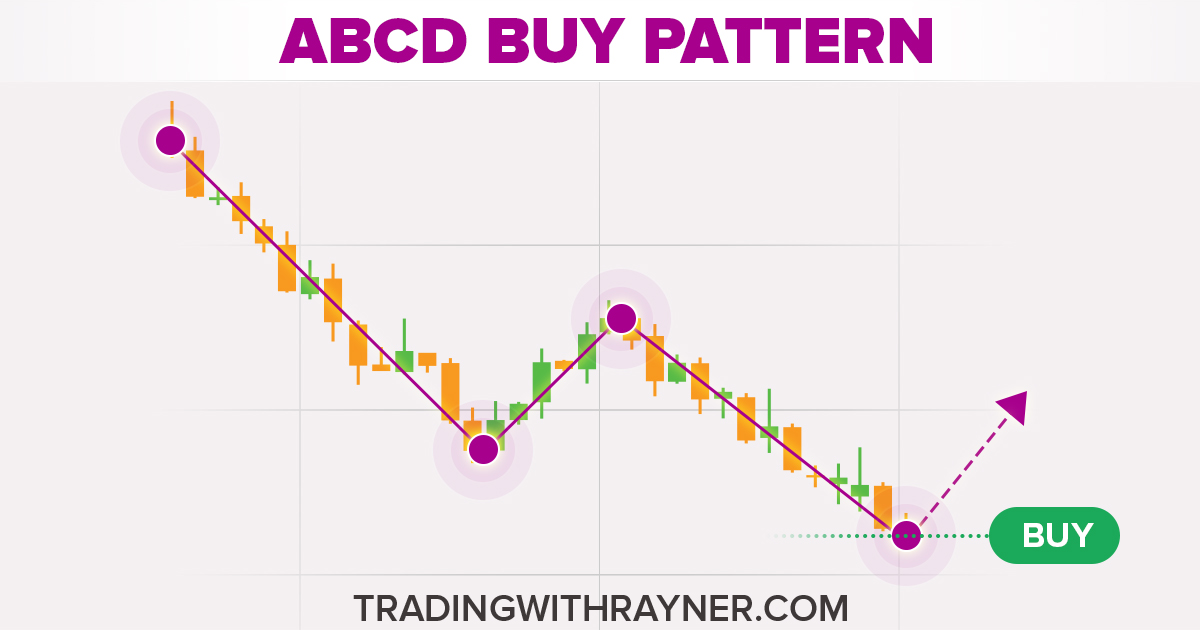
It’s a pattern that belongs to the harmonic pattern family introduced by H.M Gartley.
And you’d be pretty surprised how well this works in the realm of price action!
But not to worry, my friend…
…we’ll be using none of those complex Fibonacci tools in this guide!
Instead, you’ll learn:
- How to decode the ABCD pattern so that you exactly know what it looks like on a chart
- Common mistakes in trading the ABCD pattern that can sabotage your trading results
- The answer on how to navigate around the ABCD pattern’s shortcomings
- A simple process and tactic on how to approach and trade the ABCD pattern
- The best-kept SECRET strategy for trading the ABCD pattern
Are you excited?
You should be, as this guide’s packed!
So, get your notes and charts up – and let’s get started!
ABCD pattern unveiled: What is it, and how does it work?
Imagine the vast trading landscape as a captivating puzzle…
Alright, maybe that’s a bit too exaggerated…
But at its heart lies the ABCD pattern!
It’s a remarkable piece that sets the tone for traders seeking strategic insights.
And unlike harmonic trading where it (apparently) consists of a lot of animals…
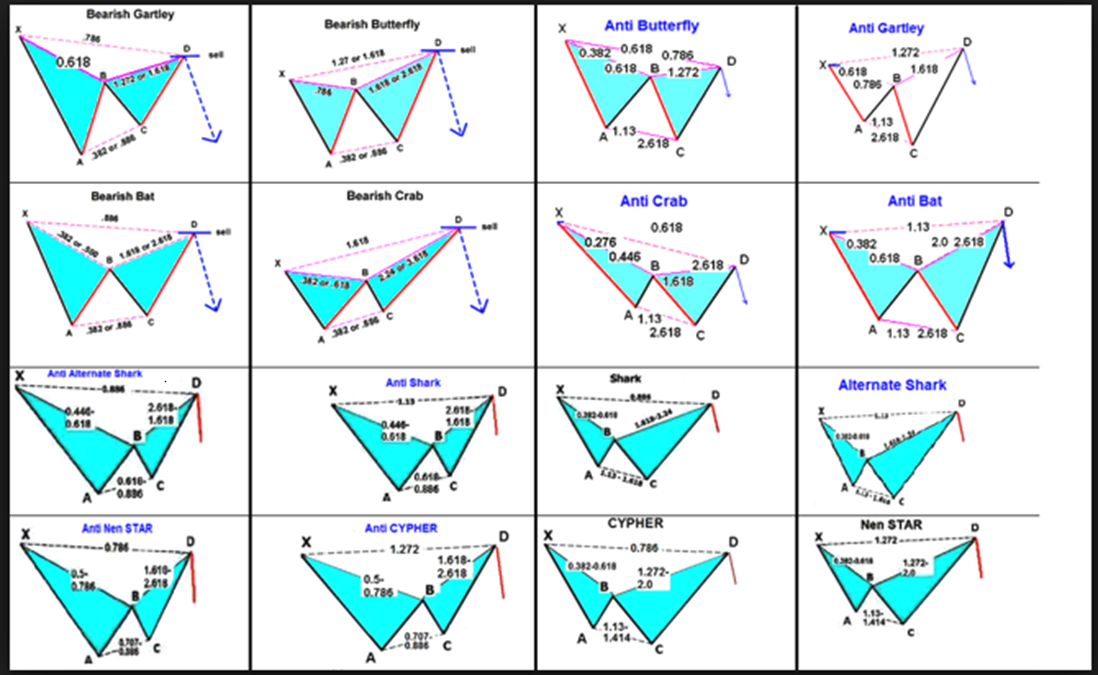
…the ABCD pattern employs simplicity to its advantage, built upon the interplay of four crucial protagonists: A, B, C, and D.
You could say it’s an equal-measured move!…

And like puzzle pieces falling into place,
These distinct points hold the essence of market movements.
Your role as a trader is to decipher their tale and translate it – into informed moneymaking decisions!
So…
How does each point in the ABCD pattern fall into place anyway?
ABCD pattern: A to B
The story commences with A to B.
They’re a dynamic duo who launch the proceedings with a bold and powerful market move, a lot like the opening lines of a thrilling novel.
Here’s what it looks like on a chart…
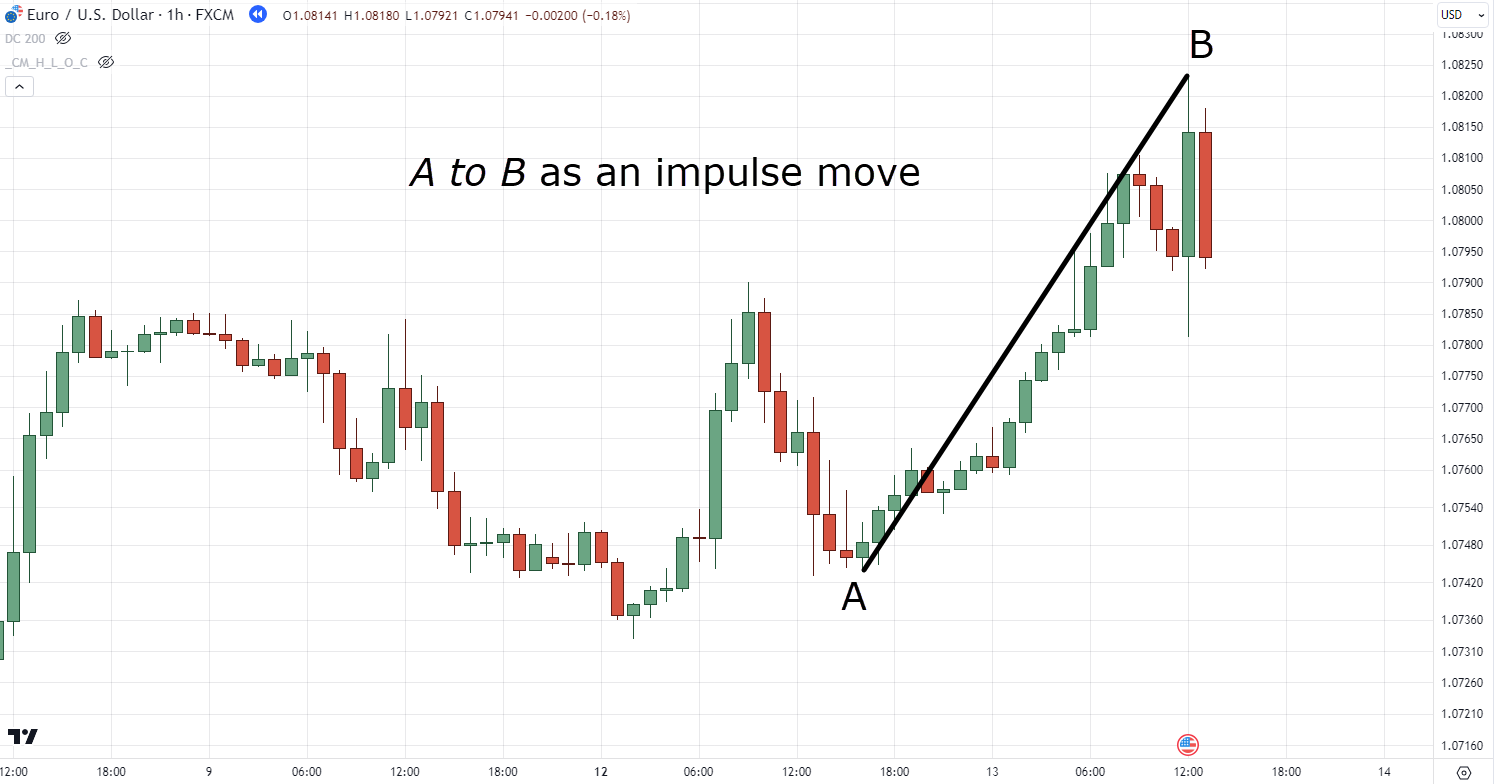
This move isn’t merely an introduction; it’s the captivating hook that can either set the stage for triumph or leave traders bewildered!
Nonetheless…
The A to B move must be clean with little to no wicks.
As this is the very first sign as to how we will identify the pattern!
ABCD pattern: B to C
In the unfolding drama of the ABCD pattern, envision B to C as an essential intermission.
Here, the market takes a moment to recalibrate, pulling back from its initial surge.
In short, a pullback or a consolidation…
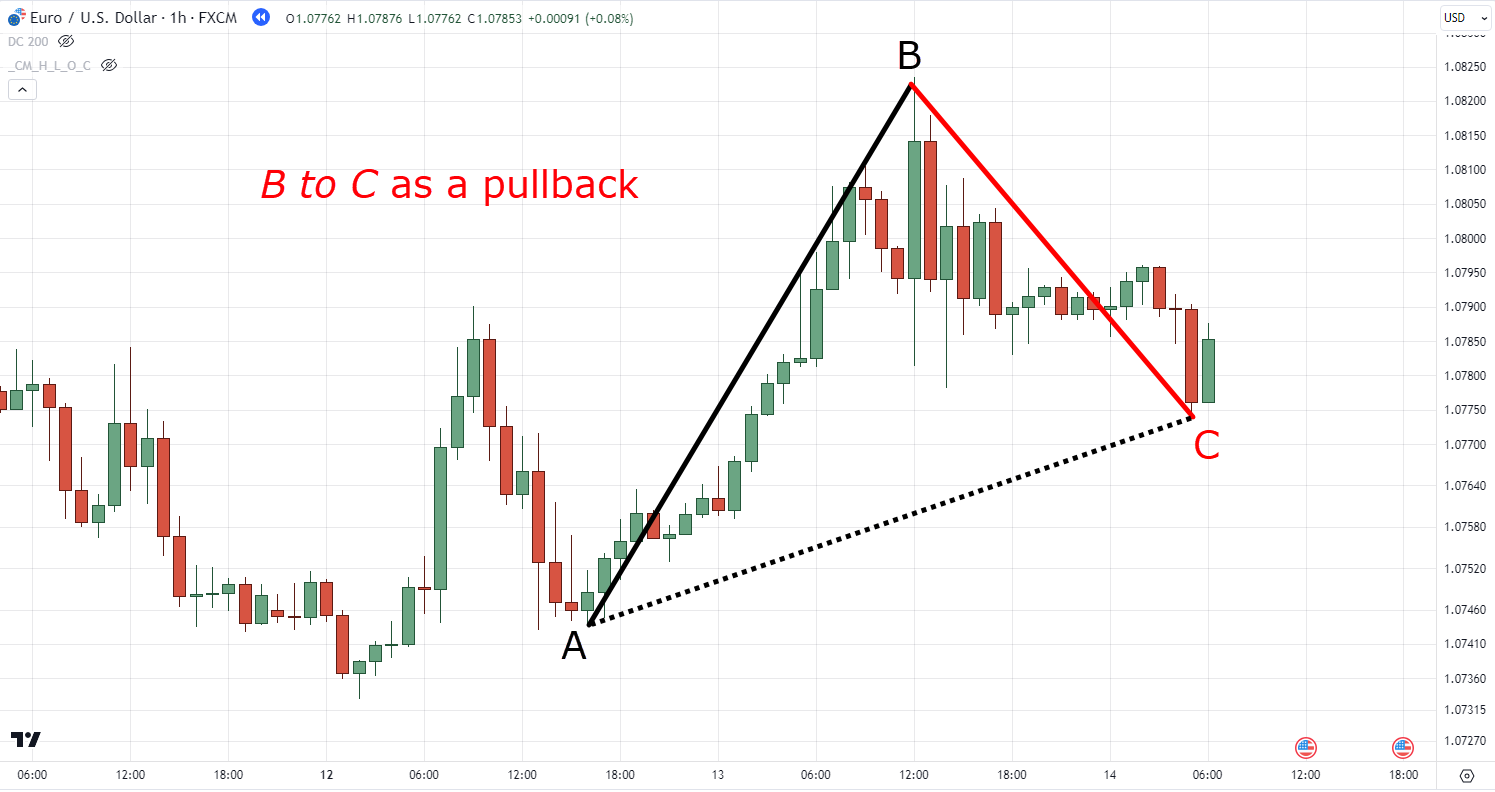
This part is the most crucial as most traders have a hard time recognizing it.
But rest assured, my friend!
I will cover this shortly in the later sections.
ABCD pattern: C to D
As the curtain rises on the pattern’s climax, enter C to D – the stage for a dramatic reveal!
This move is what completes the whole ABCD pattern.
But you should bear something in mind…
The C to D move must follow the same concept I used to identify the A to B leg of this pattern…
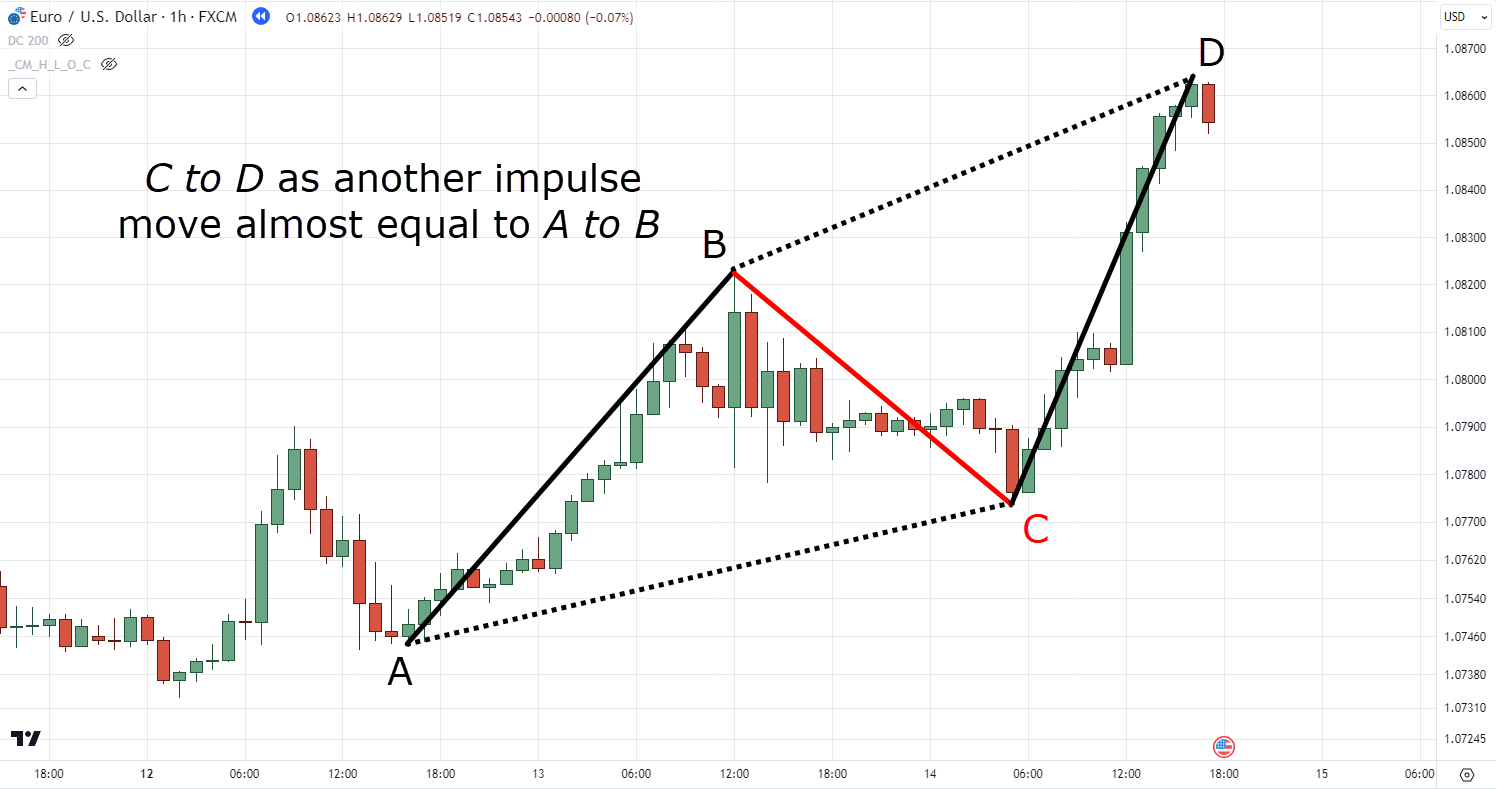
It’s a powerful move with little to no wicks and an impulse move almost equal to the A to B leg.
That’s right…
The A-B and the C-D leg must be almost equal!
And by the way…
I say “almost” because every concept and indicator will always be an “area” on your chart (I’ll explain more in the next section).
Make sense so far?
In summary, the ABCD pattern encapsulates the beauty of simplicity within the complexity of the trading world.
From A to B, B to C, and C to D, this pattern offers a dynamic sequence that might even mirror the ebbs and flows of life itself!
So, with all this in mind…
How do I trade the ABCD pattern the right way?
Let’s figure it out in the next section!
ABCD pattern wizardly: Trading the right, smart, and sassy way
This time my friend…
Let’s dive into the ABCD pattern – not as spectators, but as players in this trading game.
So, when it comes to dealing with the ABCD pattern you must…
Identify the ABCD pattern with the purpose of trading and not analyzing
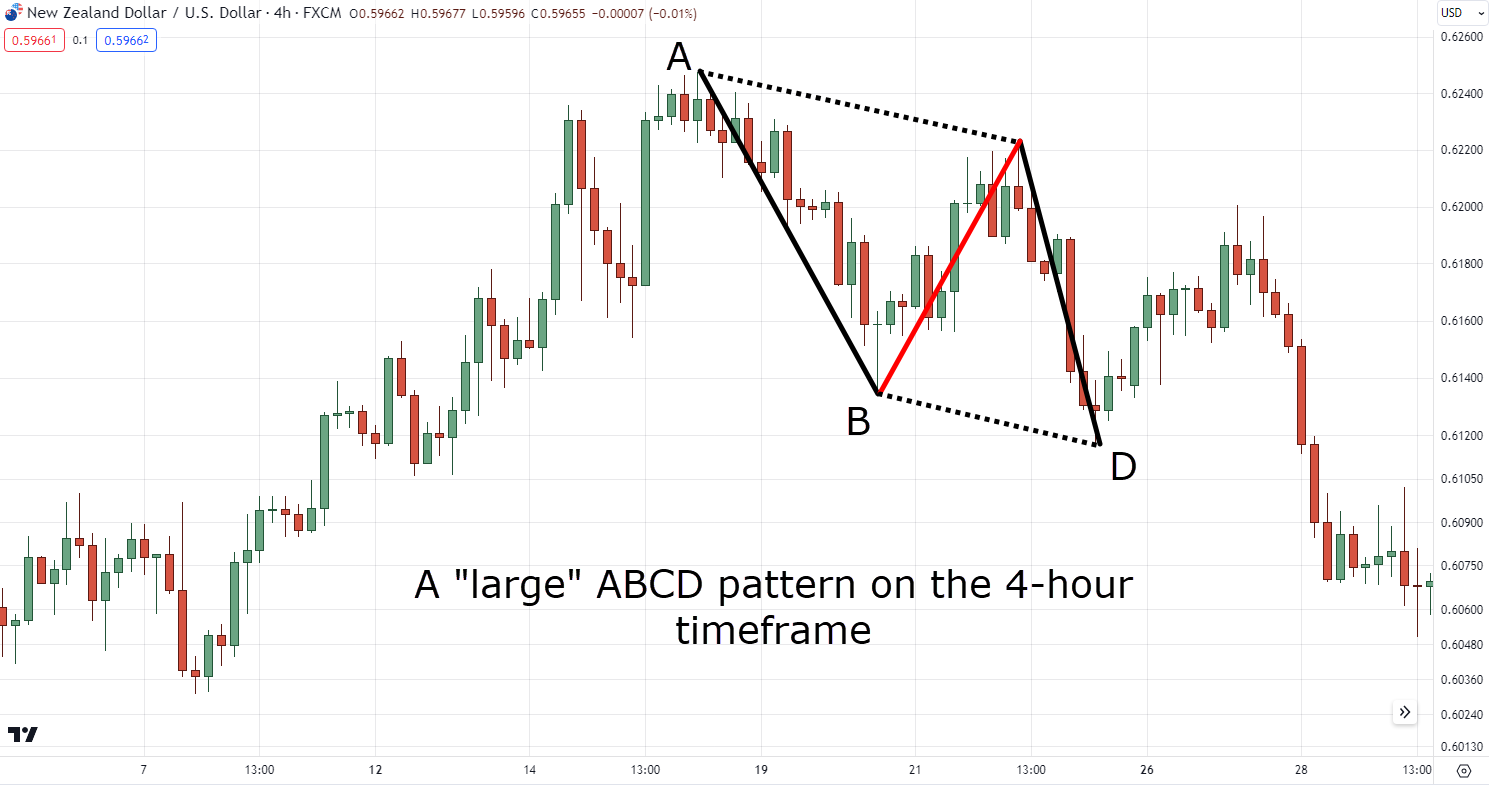
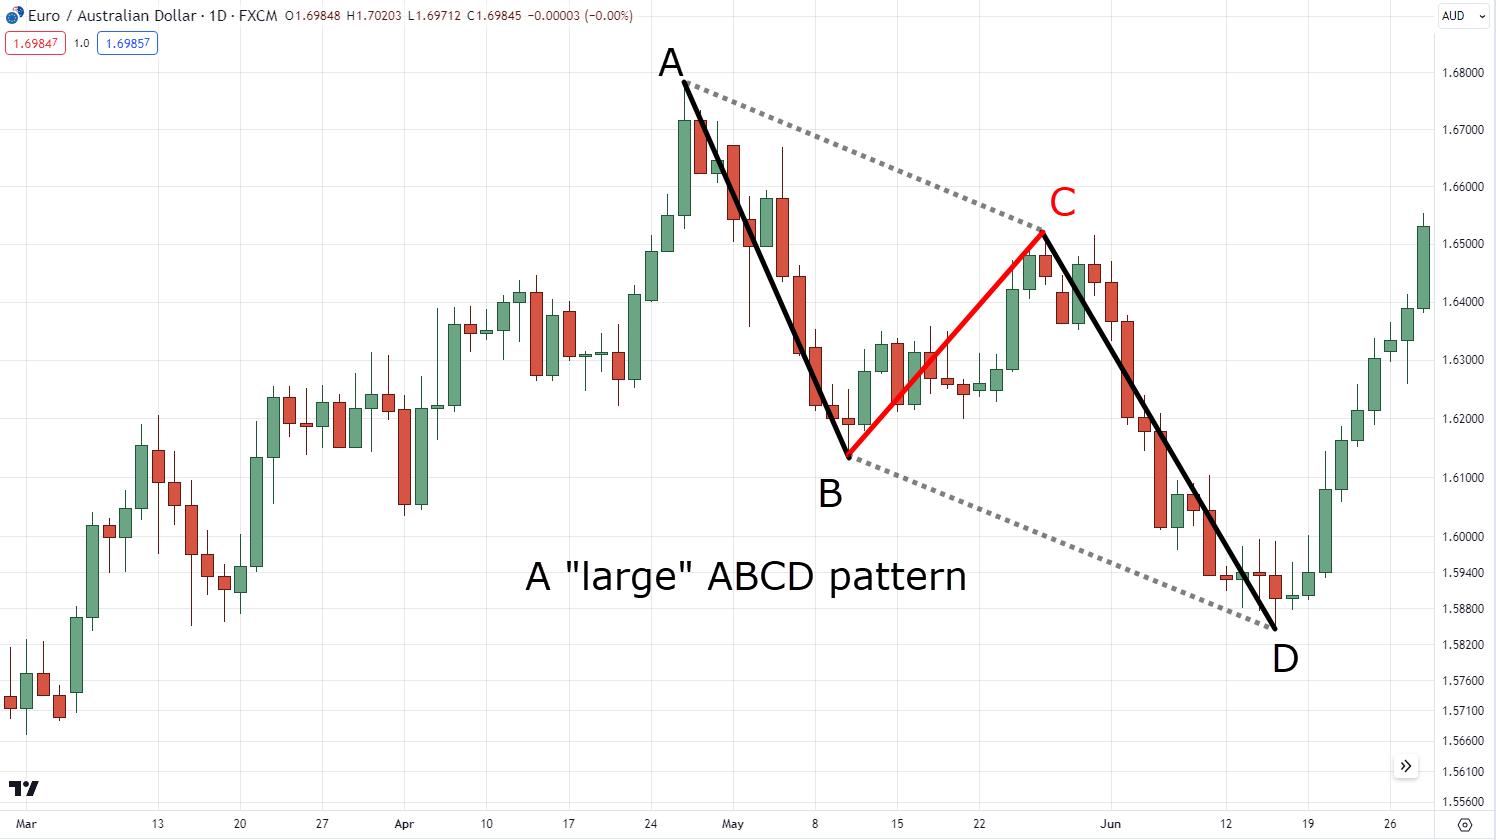
It’s a core truth that the ABCD pattern has its variations.
Some large ones…
Some small ones…
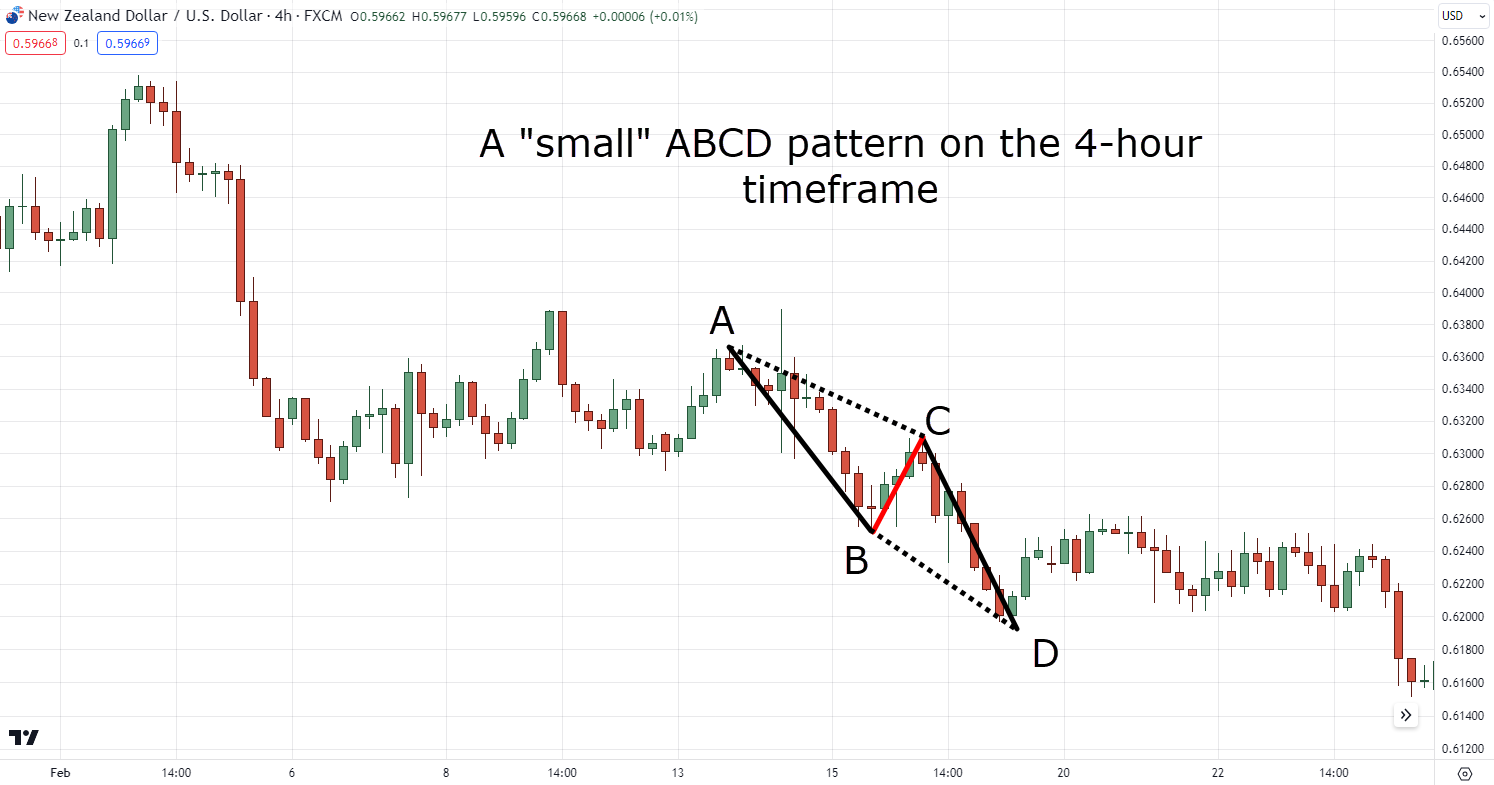
But remember, any ABCD pattern can fail before completing its pattern – just like any other pattern out there!
So, when trading an ABCD pattern, stick to one timeframe and spot a pattern where its size is visible on your chart to trade.
And never forget…
ABCD patterns are your ingredients for a winning trade, not an artifact for endless analysis!
Alright then, are you ready for some trend talk?
Because if you’re going to use the ABCD pattern to trade you must…
Have a well-established healthy trend by using the 50-period moving average
When it comes to navigating the ABCD pattern terrain, one cardinal rule stands tall: embrace the comfort of a well-established, healthy trend!
This means looking for a bullish ABCD pattern on a healthy uptrend…
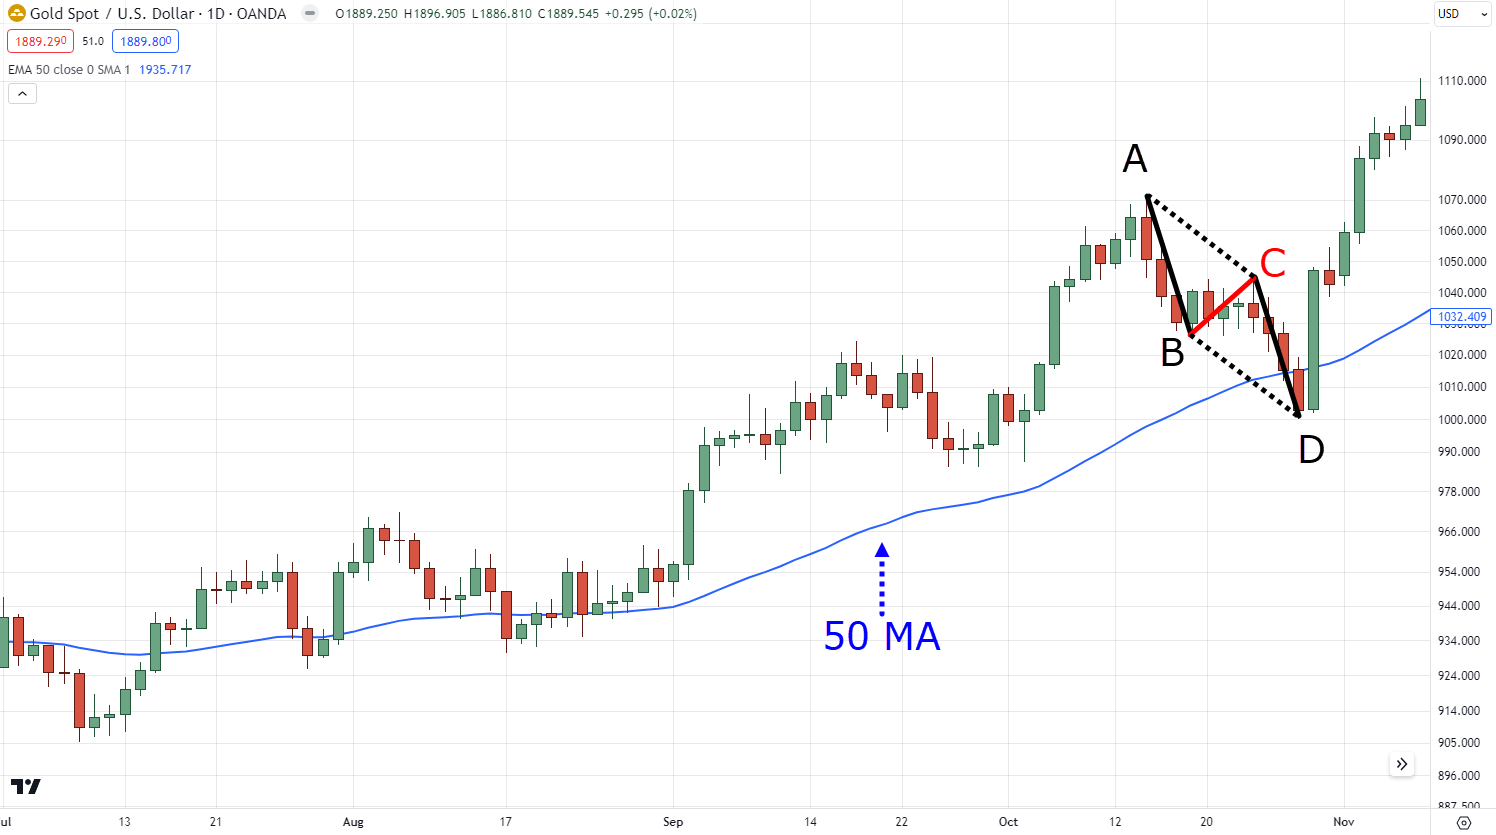
And a bearish ABCD pattern on a healthy downtrend…
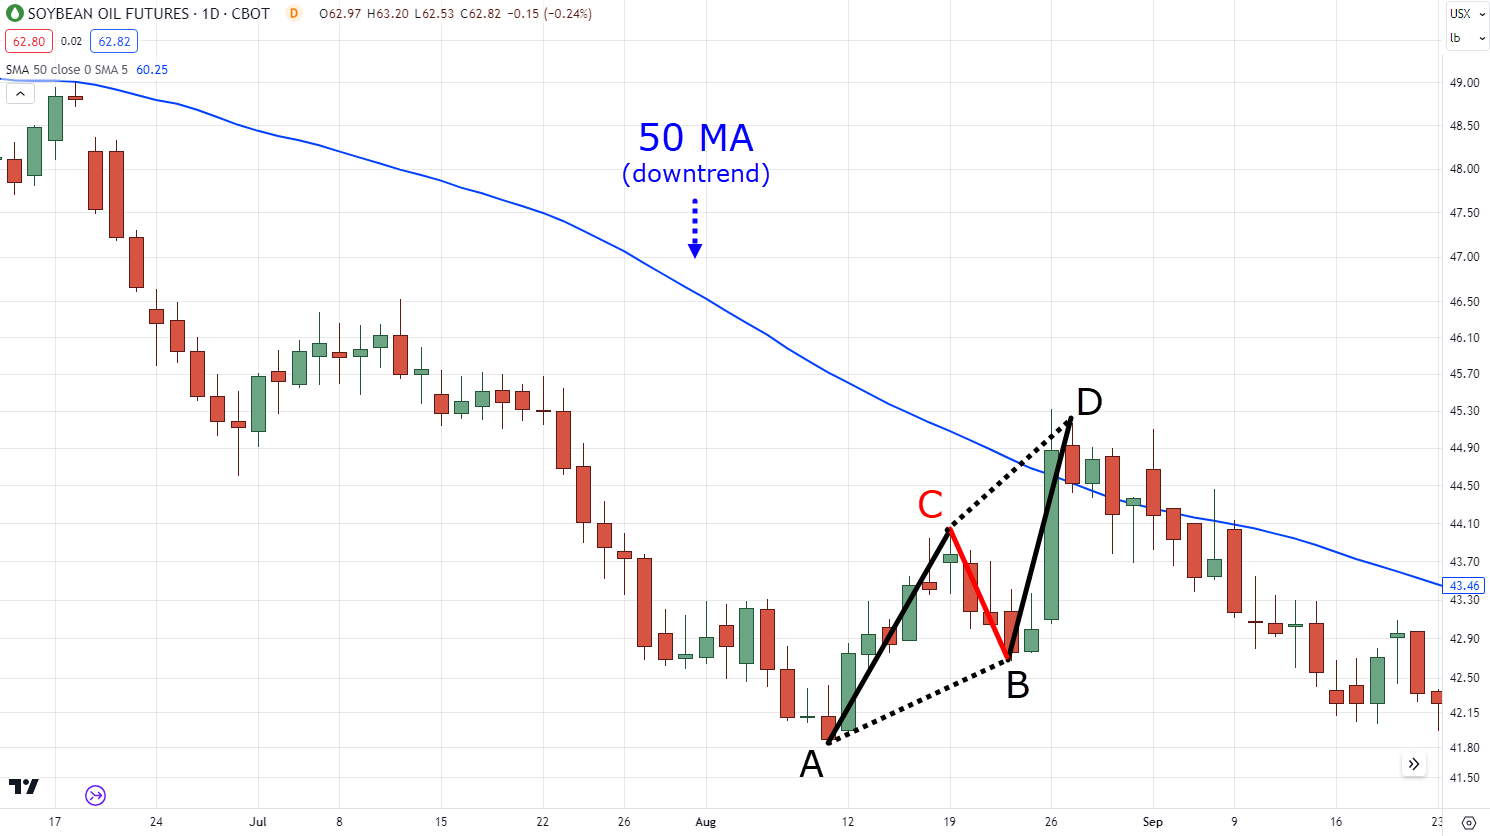
And certainly not the other way around!…
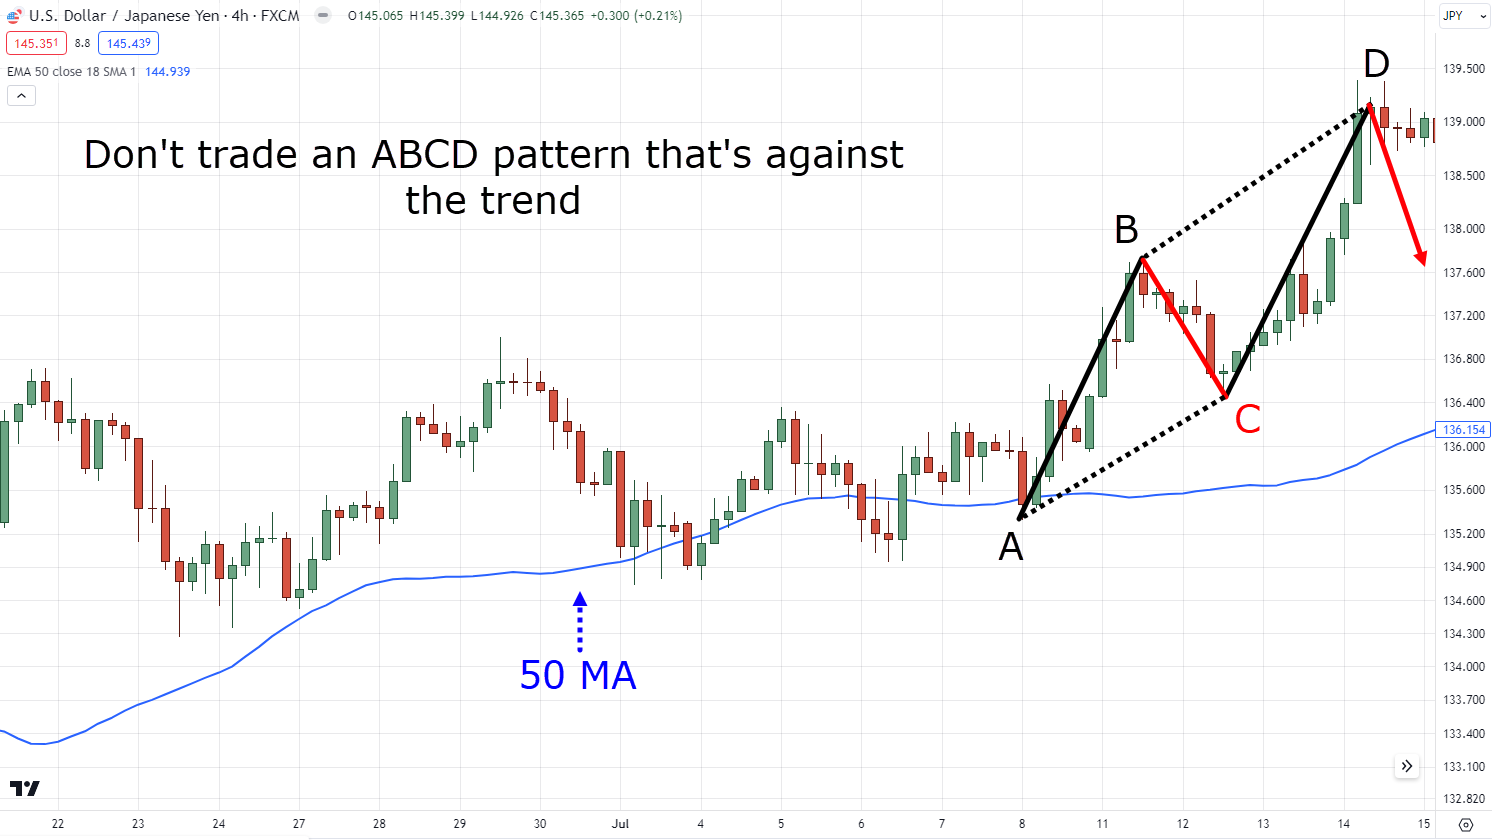
But maybe you’re sensibly asking…
“How come?”
“Isn’t this what the ABCD pattern is made for?…”
“…To predict trend reversals?”
Well sure, you can trade the ABCD pattern that way but – you are putting yourself at a great disadvantage if you do!
Why?
Because no matter what the pattern is, you can never consistently predict the end of a trend.
…and that’s a fact!
Now you also might be wondering…
“Why do I need a moving average for this?”
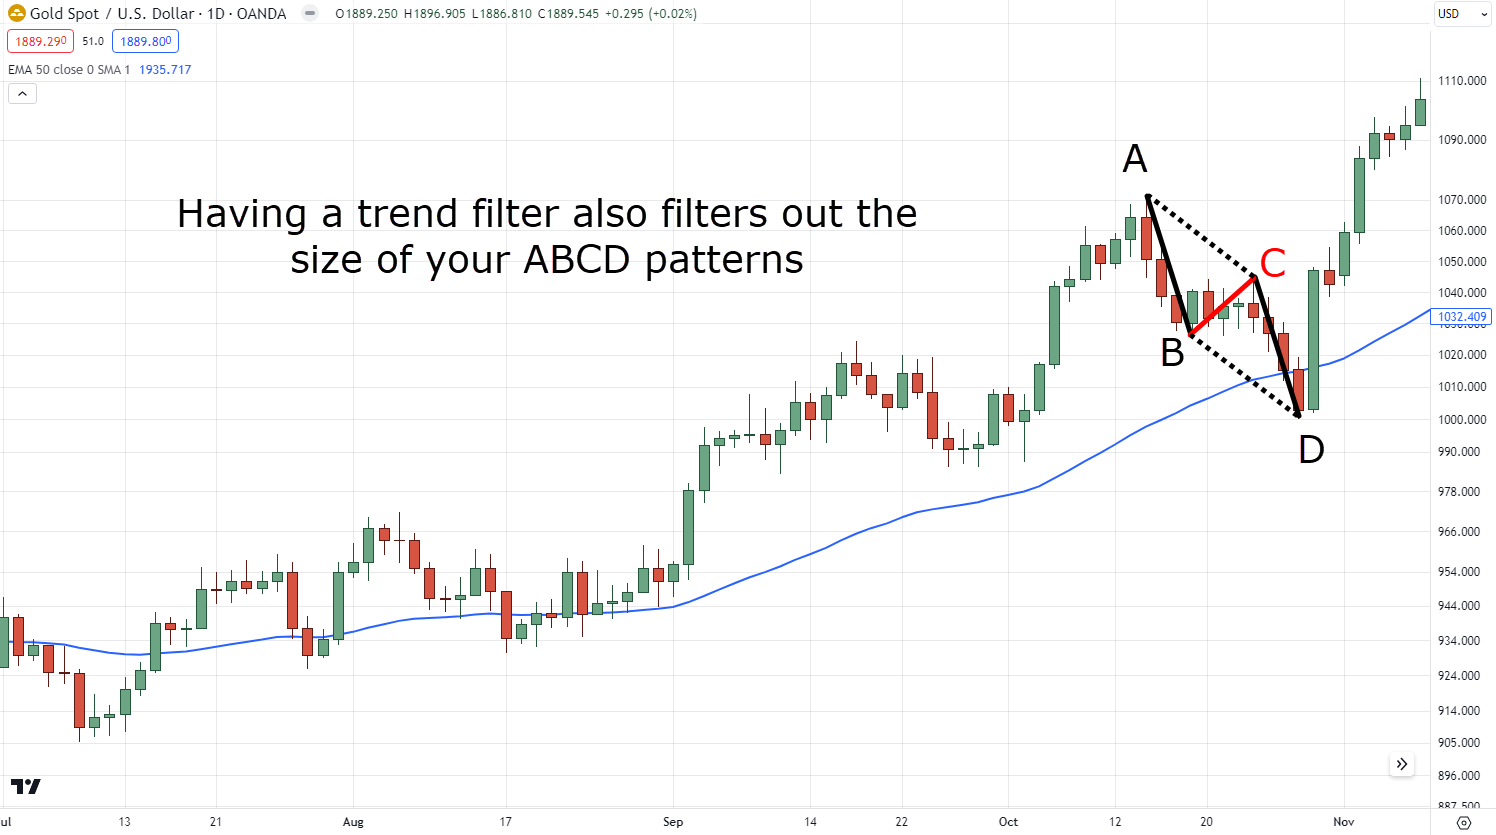
And the reason is that ABCD patterns can be very huge… or very small!
By adopting a trend filter, you can make sure that every ABCD pattern you spot is very consistent in size.
Does it start to make sense?
Well, another crucial part is to always…
Look for strong equal moves for A to B and C to D and not “choppy” moves
Imagine a dance floor; you’d prefer smooth moves over the cha-cha of choppiness, right?
Well, ABCD patterns are no different.
Aim for those symmetrical A to B, and C to D moves…
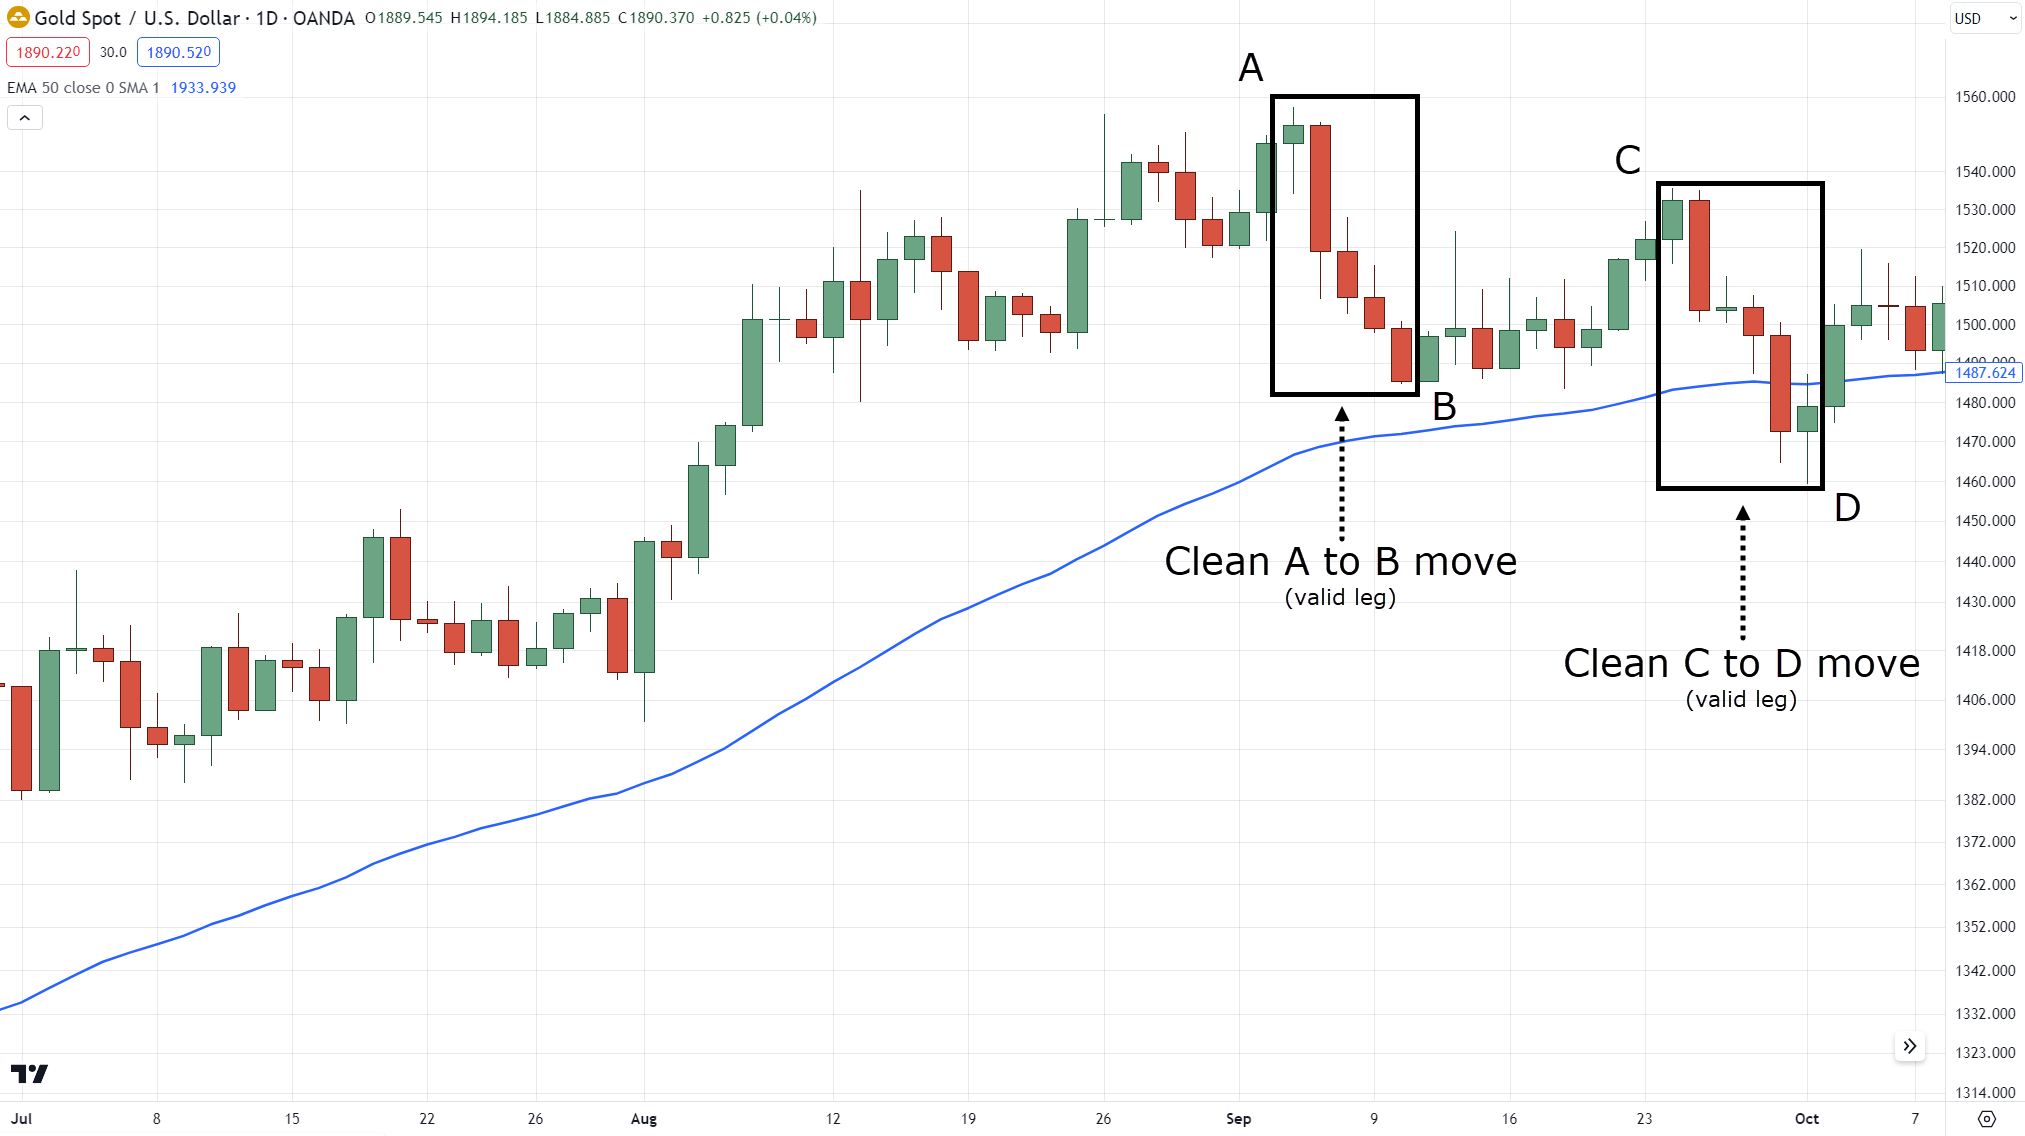
And not the choppy cha-cha ones…
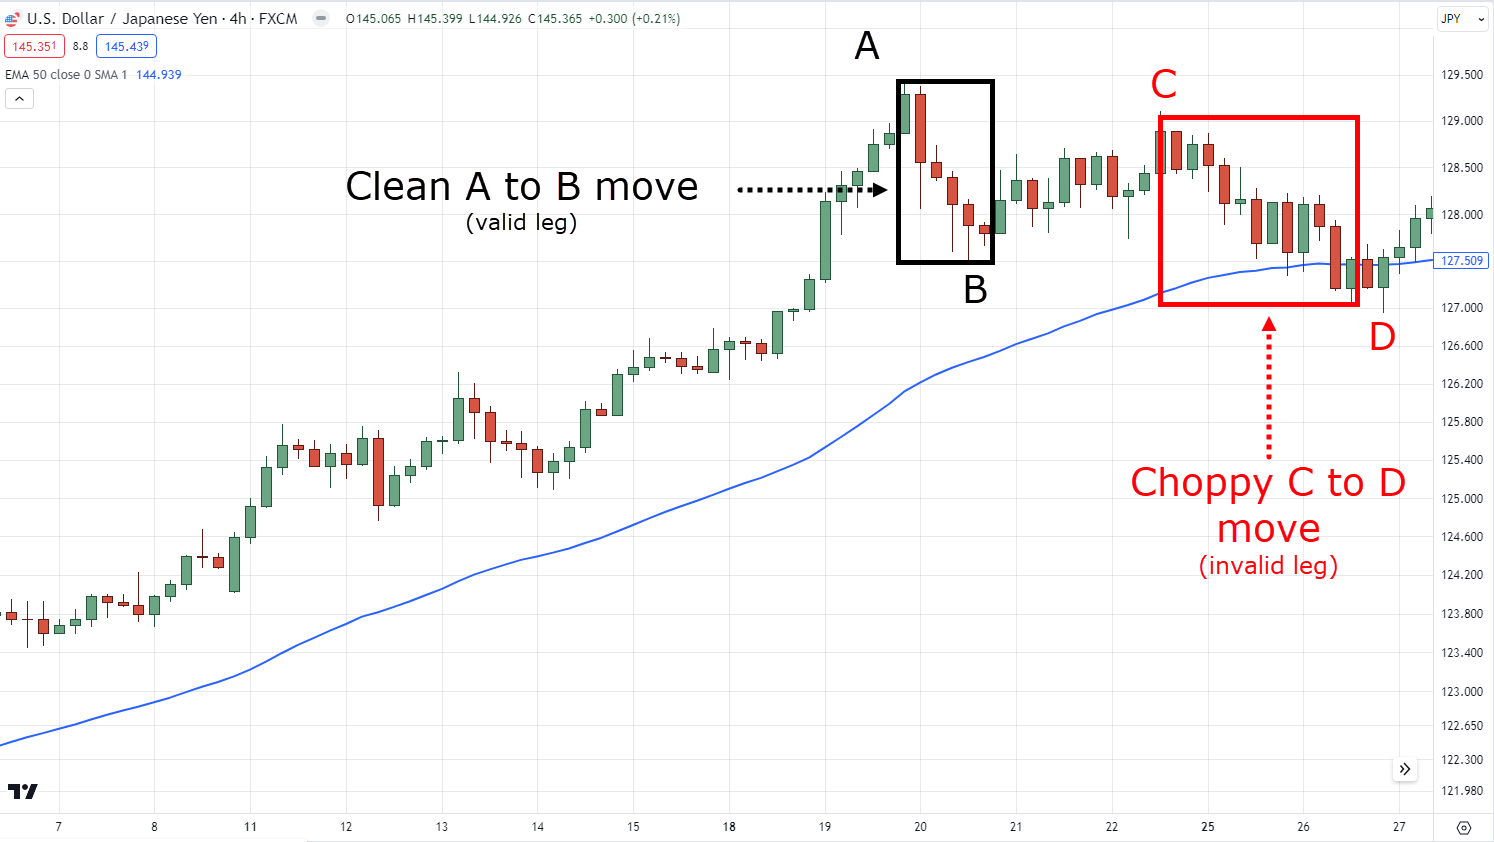
Finding a clean A-B, and C-D move is like finding a perfect dance partner who complements your steps.
So, skip the “choppy” dance-offs – go for a harmonic duet instead!
Now…
Let’s say that the ABCD pattern is complete.
It’s part of a valid healthy trend.
And you’re planning to take advantage of the trade….
How do you exactly enter this pattern?
Well, it’s simple…
Wait for a strong candle rejection at the “D” completion
You see…
Most traders would blindly place an order the moment the pattern completes…
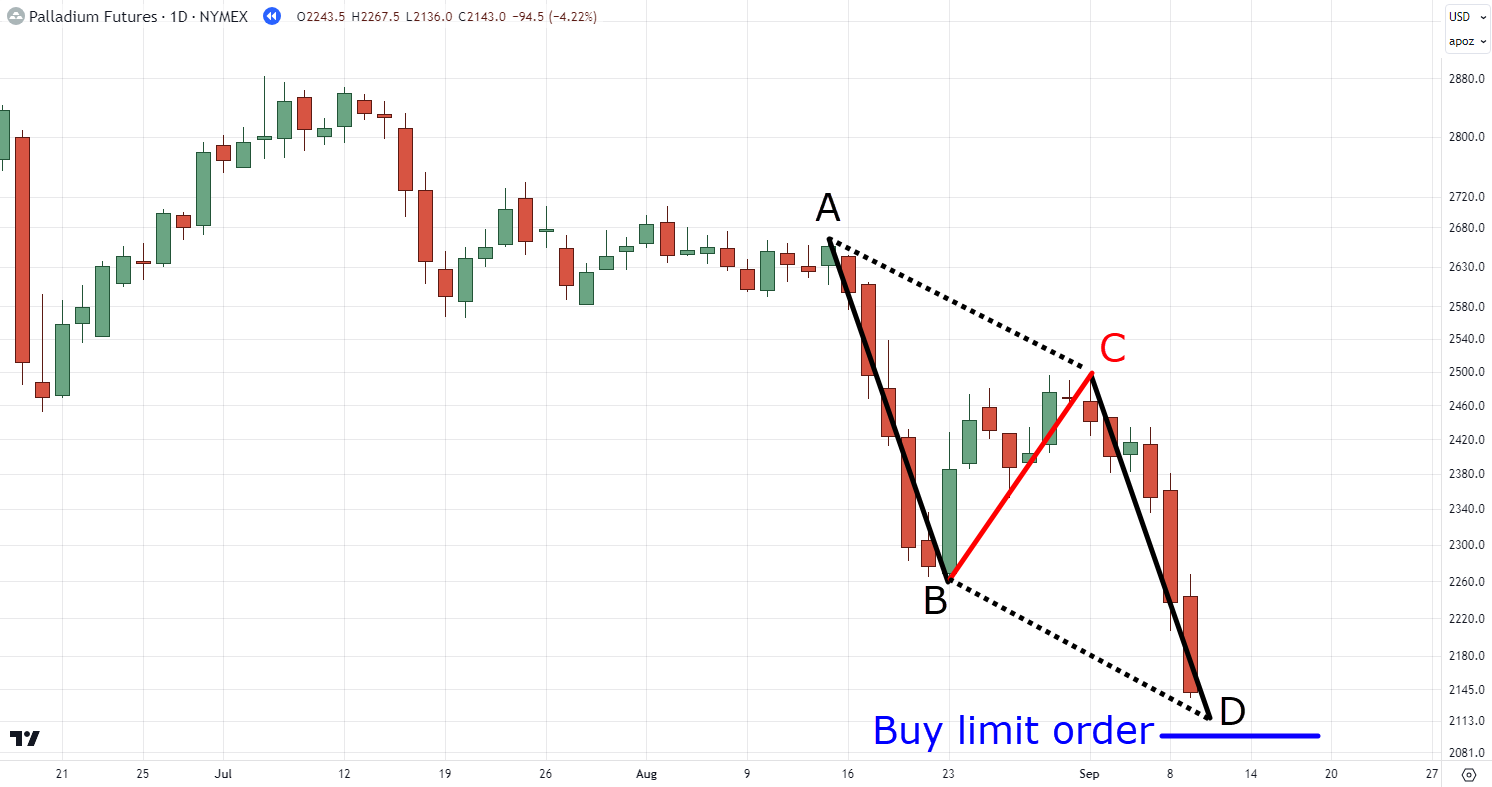
But in the end,
You should remember that the “D” completion is just an imaginary area.
The market can still push lower and ignore the whole pattern itself…
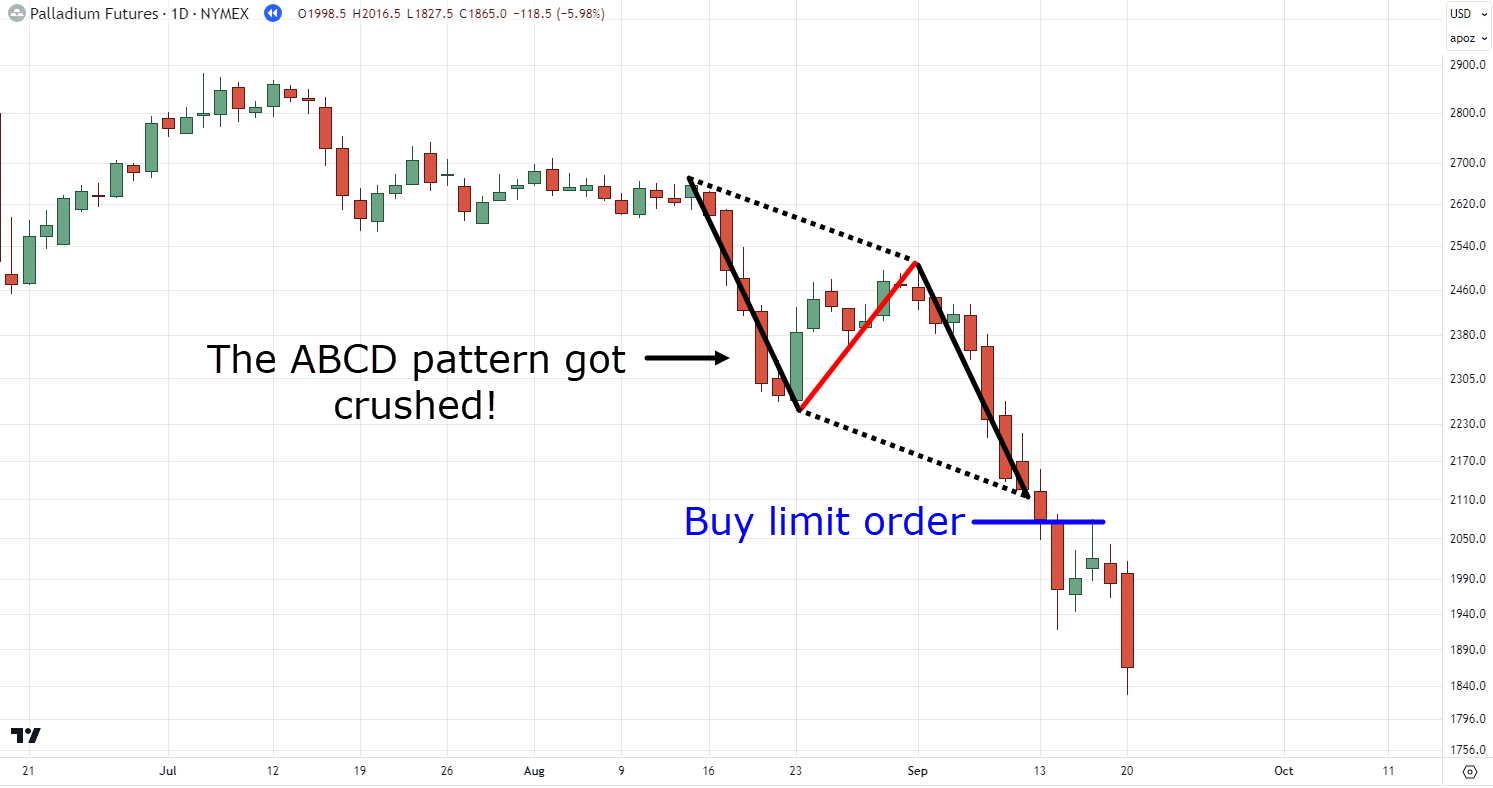
So, how do you know when this imaginary pattern turns into a healthy reality?
Well, you must make sure the market responds to a valid candlestick price rejection…
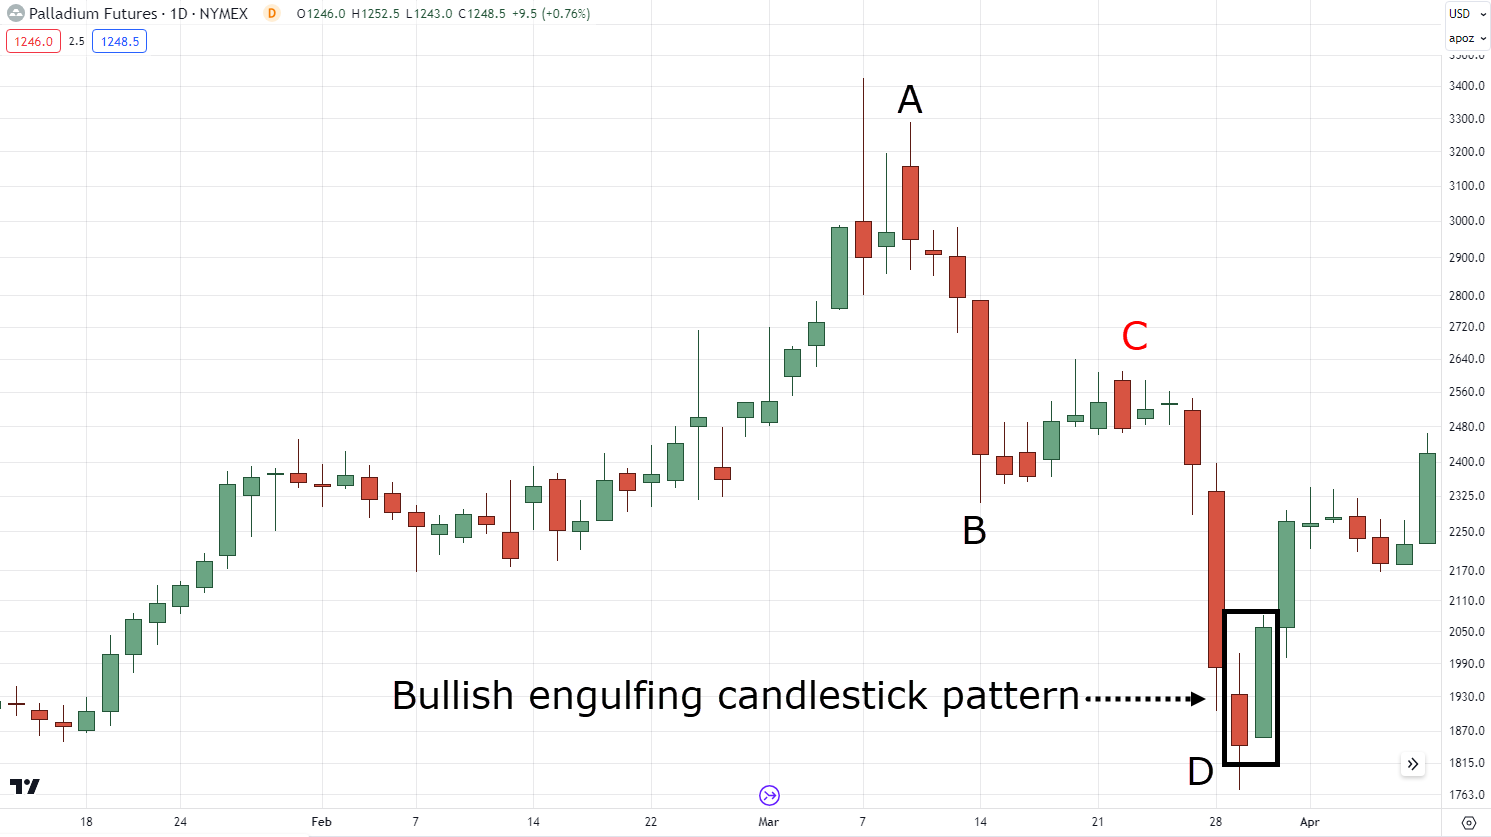
The moment you see the market rejects from the “D” pattern completion is the moment you can consider the pattern acknowledged by the markets!
In a nutshell, my friend…
With purposeful play, trend tales, groove-worthy moves, and confluence quests with the ABCD pattern…
You’re set to conquer the trading realm with style!
But before I go further, let me ask you…
Is life perfect all the time?
Not really, right?
There are some euphoric highs among the lows, with plenty of mistakes as well!
This is why, in the next section,
I share with you the common mistake when dealing with the ABCD pattern so that we can reduce those lows in your ABCD trading life.
Sound good?
Then keep reading!
ABCD pattern detours: Steer clear of these dangerous mistakes
Let’s right into it and kick off our exploration of ABCD pattern trading with a classic blunder…
Mistake #1: Trading the pattern even when the pattern isn’t complete yet
This is the most common mistake harmonic traders make.
Just because the price made an ABC pattern it never…
I say again NEVER…
It never guarantees a C to B pattern completion!
The market can reverse easily – as you’ve seen in the previous example!…
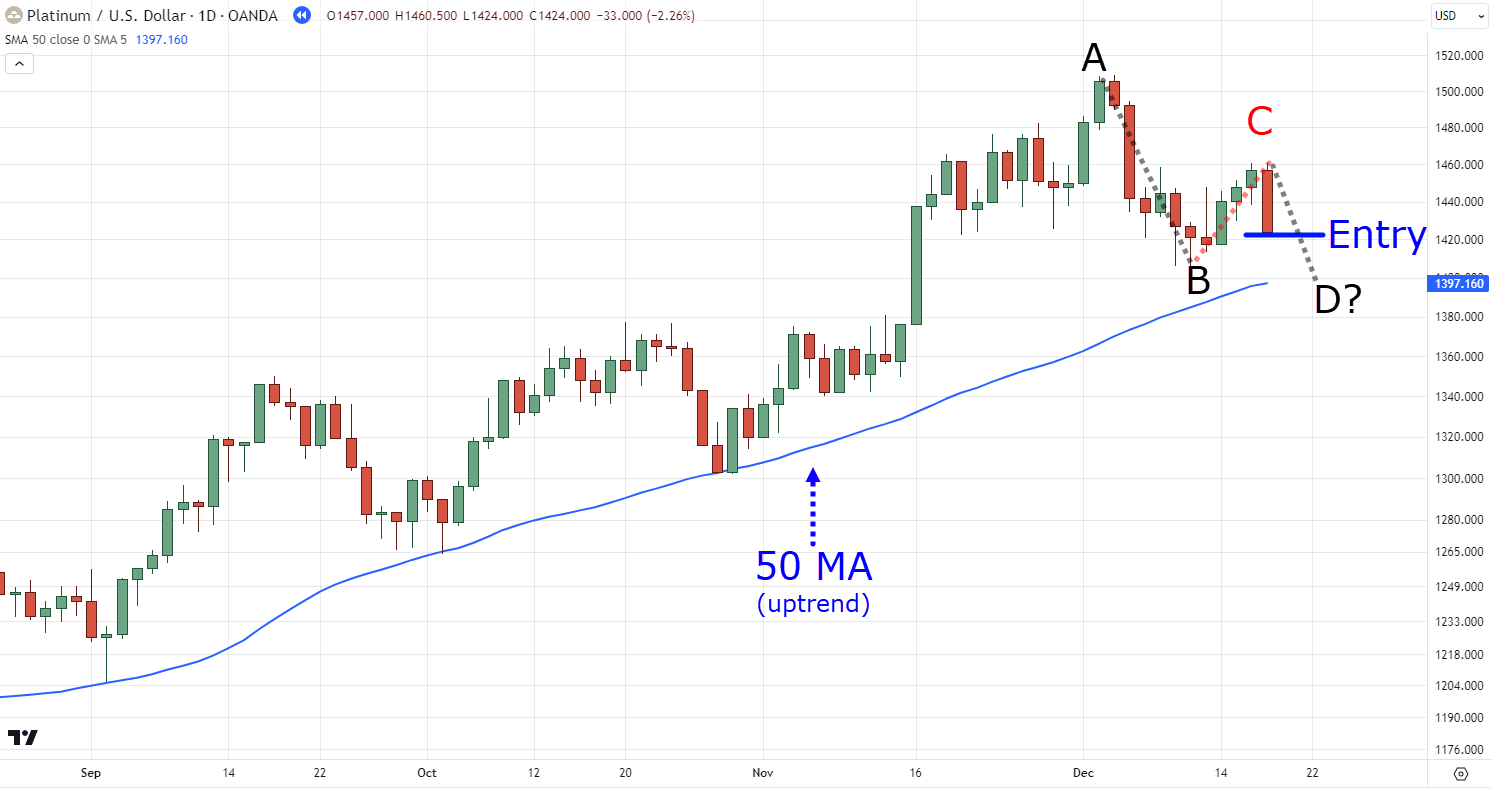
This is why it’s vital to determine the prevailing trend first!
Trying to trade the “C” leg against the trend would be way too risky.
That’s why you must remember…
Patience is more than a virtue here!
Waiting for the whole ABCD pattern is absolutely key to keeping those trading gears turning smoothly.
Got it?
Mistake #2: Trying to identify every ABCD pattern you see
Here’s another golden principle to keep in mind when trading the ABCD pattern.
We use the pattern to trade the markets – not to analyze!
What do I mean?
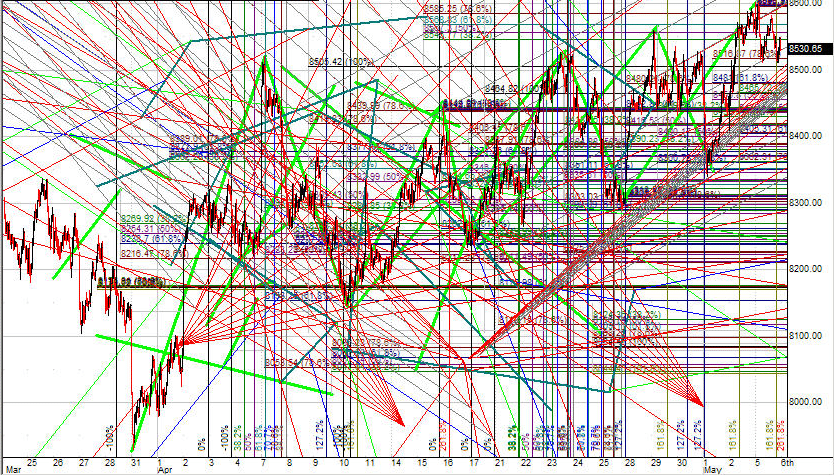
Well, if you’re using the ABCD pattern to analyze the markets, your chart would probably look something like this…
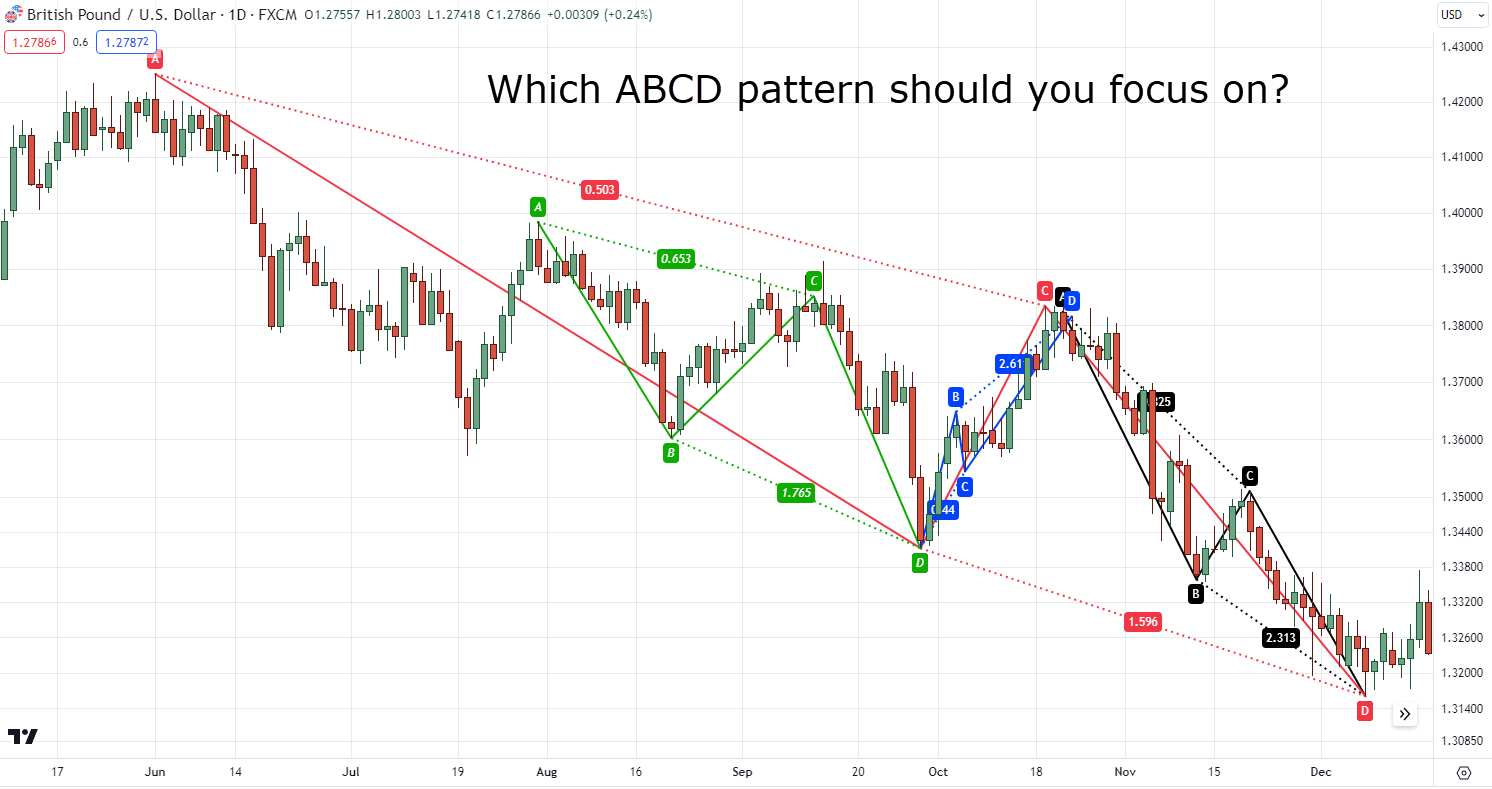
But after you’ve done your superhuman analysis…
Which one do you trade?
Which ABCD pattern should you reference your stop loss or take profit?
Well, even I wouldn’t know!
Even if you have a gazillion indicators of “confluence” on your chart, it doesn’t mean anything if it’ll only paralyze you – preventing you from hitting that buy button!
That’s why the key here, my friend…
…is to focus on one ABCD pattern that’s relevant to the current price – not the tons of ABCD patterns behind you…
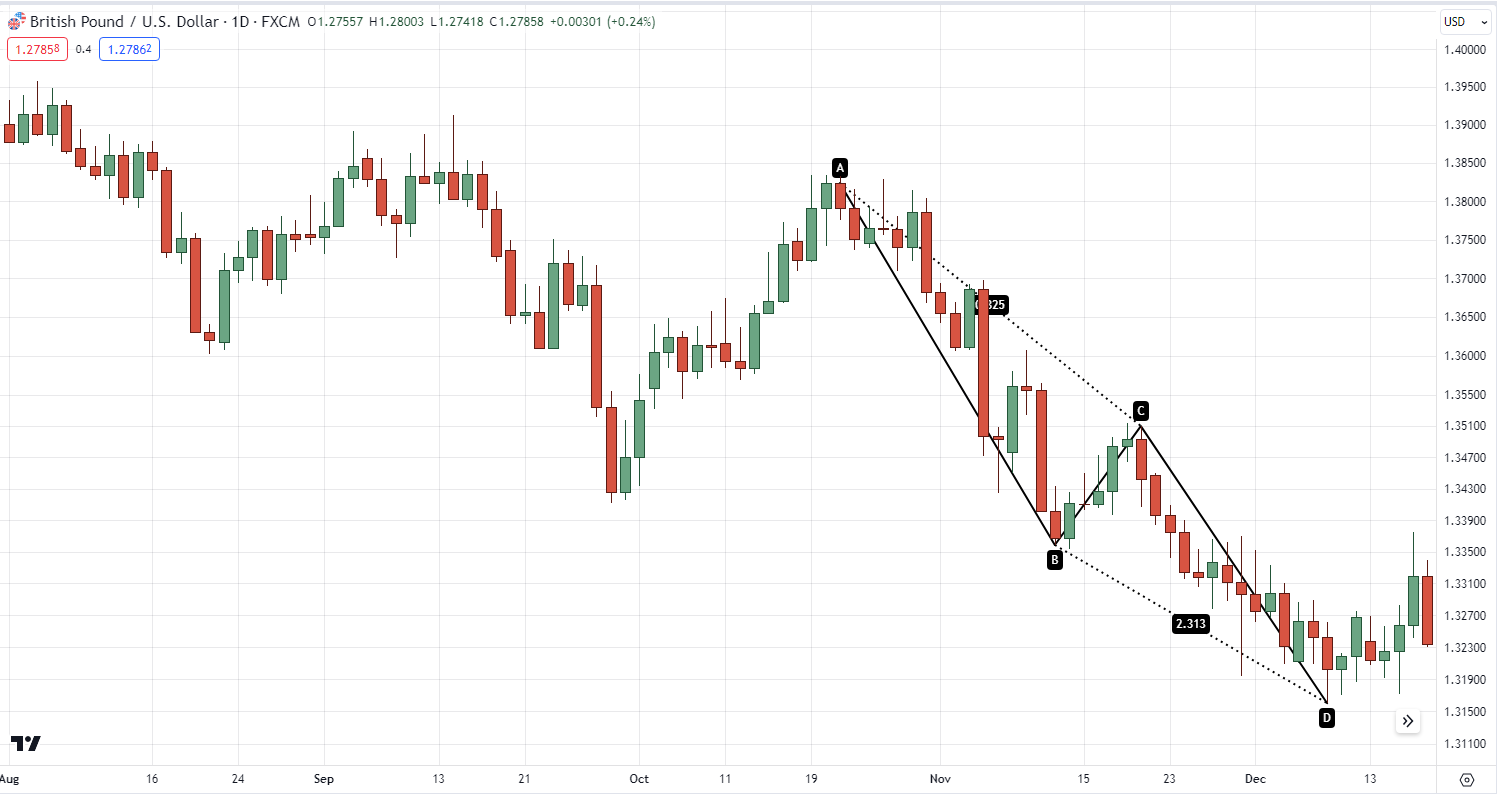
So, stop turning your trading process into a noisy circus; don’t draw more than one ABCD pattern on your chart, and avoid analysis paralysis!
Mistake #3: Expecting all ABCD patterns to look the same
Imagine a bunch of cats – same species, different personalities.
Well, ABCD patterns are like that too!
They might share a family resemblance, but they’ve each got quirks and variations…
Here’s what I mean:
A resemblance…
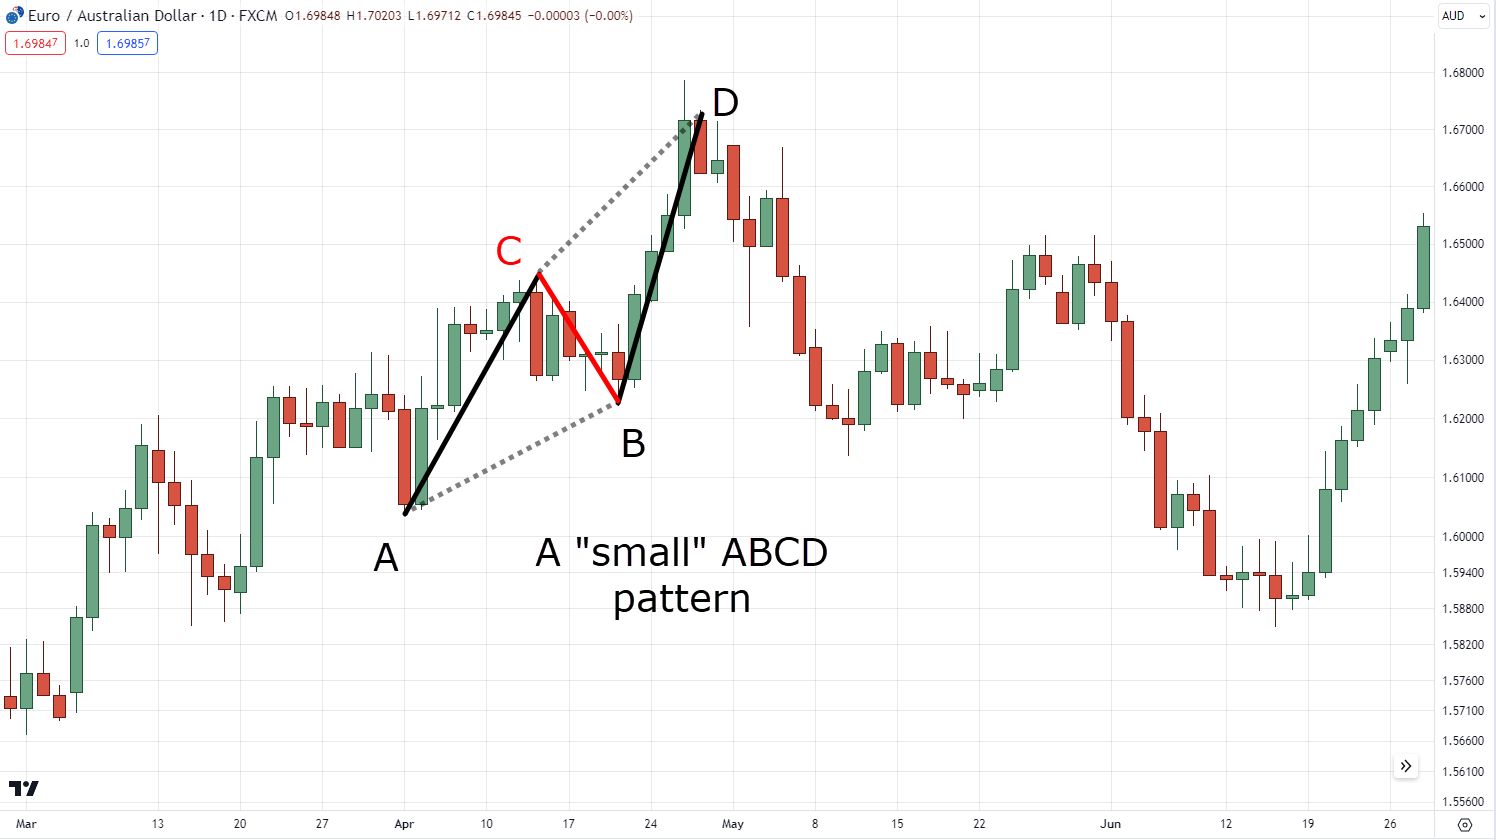
With different quirks and variations…
So… what’s the solution to identifying them?
Luckily, I’ve already shared it with you, my friend!
It’s by:
1. Always identify the trend by using the 50-period moving average
2. Sticking to one timeframe
This way, you’re placed in a position where you’ll almost never be wrong spotting ABCD patterns!…
Starting to make more sense now?
So, in a nutshell…
Consider these ABCD pattern pitfalls as quirky characters in your trading journey…
Just as any adventure has its challenges, so does ABCD pattern trading!
But by steering clear of these pitfalls, you’ll be better equipped to navigate the twists, turns, and triumphs that lie ahead.
Are you learning something new?
Great!
Since you’ve reached this far…
I’ll now reveal to you my secret strategy for trading the ABCD pattern!
And even if you don’t trade the exact strategy, you can use some concepts to add to your own strategy.
Sound good?
Then let’s get right to it!
Unlocking the ABCD pattern mastery: A complete trading strategy
Time for the grand finale as we decipher the “SECRET” strategy to ace ABCD pattern trading!
So imagine you’re on a mission, unlocking doors that lead to treasure-filled rooms…
What’s the treasure you’re after?
Winning trades, of course!
Now buckle up as we unveil the full strategy, starting with the first step…
Step #1: Identify a healthy trend
Remember what I shared with you before about the healthy trend?
Good, because this time…
We use a 50-period moving average to systematically define a healthy trend!…
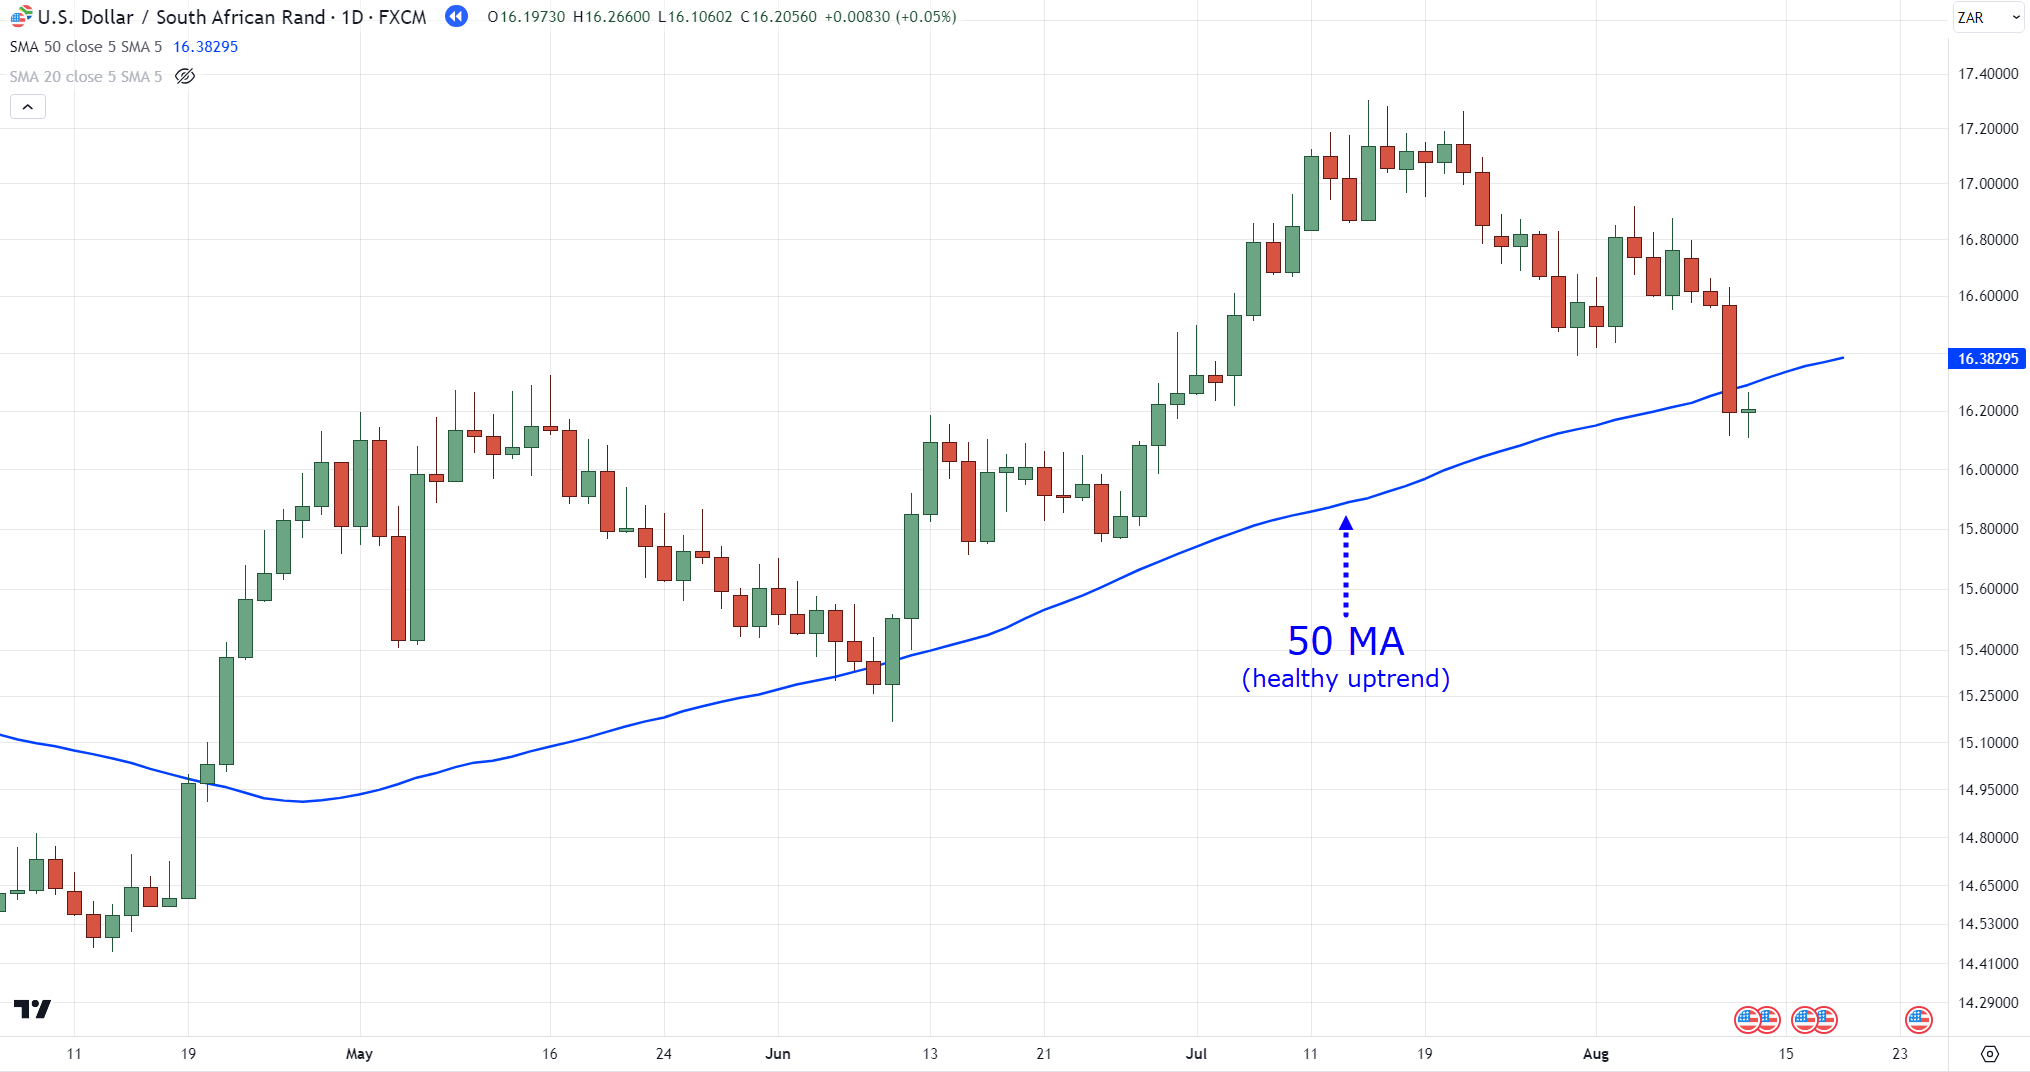
P.S. Looking for ABCD patterns in a healthy trend is recommended, but you can also choose to look for ABCD patterns in a weak trend by using a 200-period moving average if you wish.
Next…
Step #2: Identify an ABCD pattern
With the strengths and weaknesses that we discussed a while ago…
It all boils down to this step – properly identifying the pattern.
So, to keep this as simple as possible….
The next step is to identify an ABCD pattern in your chosen timeframe within an existing healthy trend…
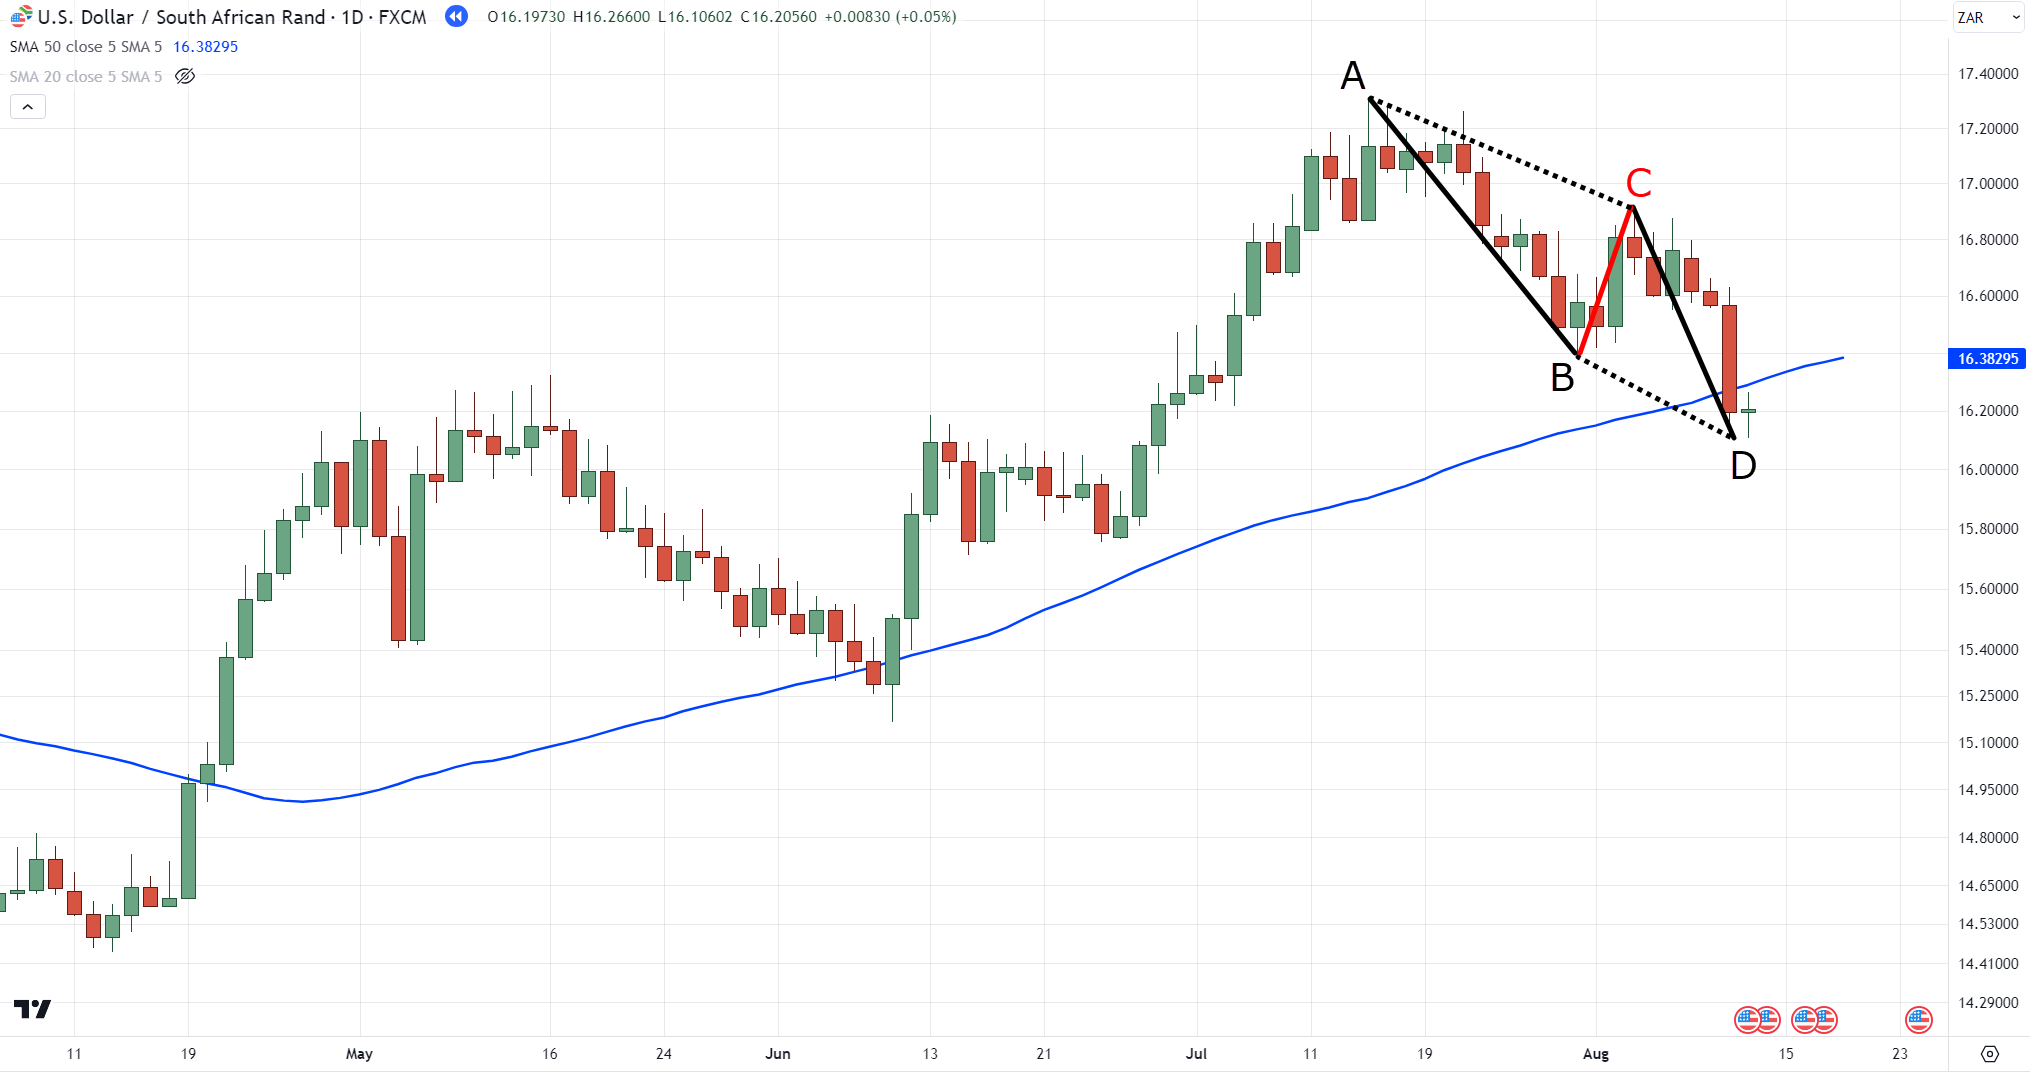
Sound simple enough?
Great!
Because the next step is where the real action begins…
Step #3: Go down to the 4-hour timeframe and wait for a break of structure
So maybe you’re saying, “Wait, what?”
“Why are we in the lower timeframe?”
Let me explain…
Pattern trading in general can be quite hard for some traders…
Why?
Because you have to wait until the pattern completes!
You have to be patient and hold your trigger finger – letting the pattern materialize!
And some traders (potentially even you) might not be too comfortable with that, right?
So, how do you remedy this?
Well, go down to the lower timeframe!
That way, you can make absolutely sure you don’t miss the pattern you’ve been waiting for.
But you might be wondering:
“Okay so, what are we looking for down here?”
Put simply – a break of structure and a flag pattern breakout, my friend!
Here’s what I mean…

Once you spot the break of that sweet flag pattern…
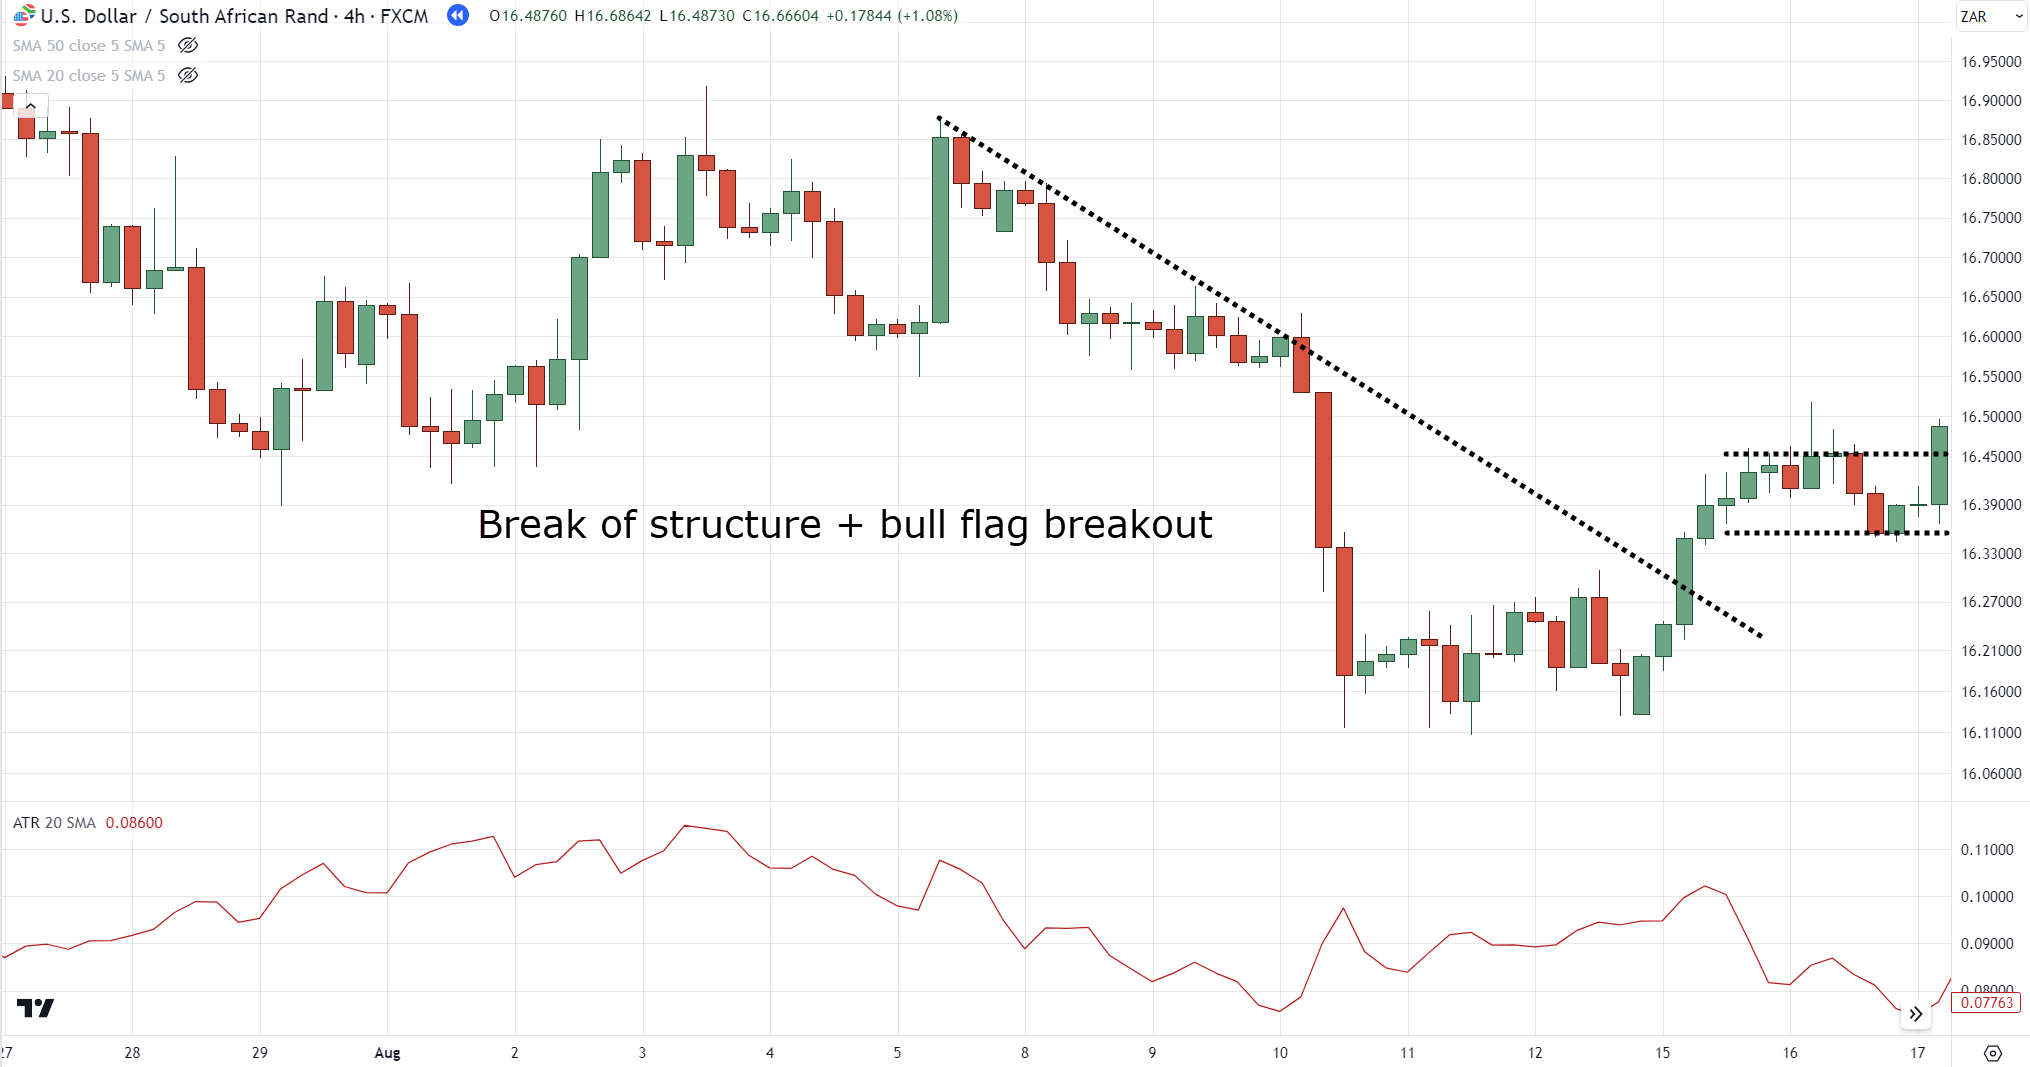
You can enter at the next candle open and subtract 1 ATR from the lows of the flag…
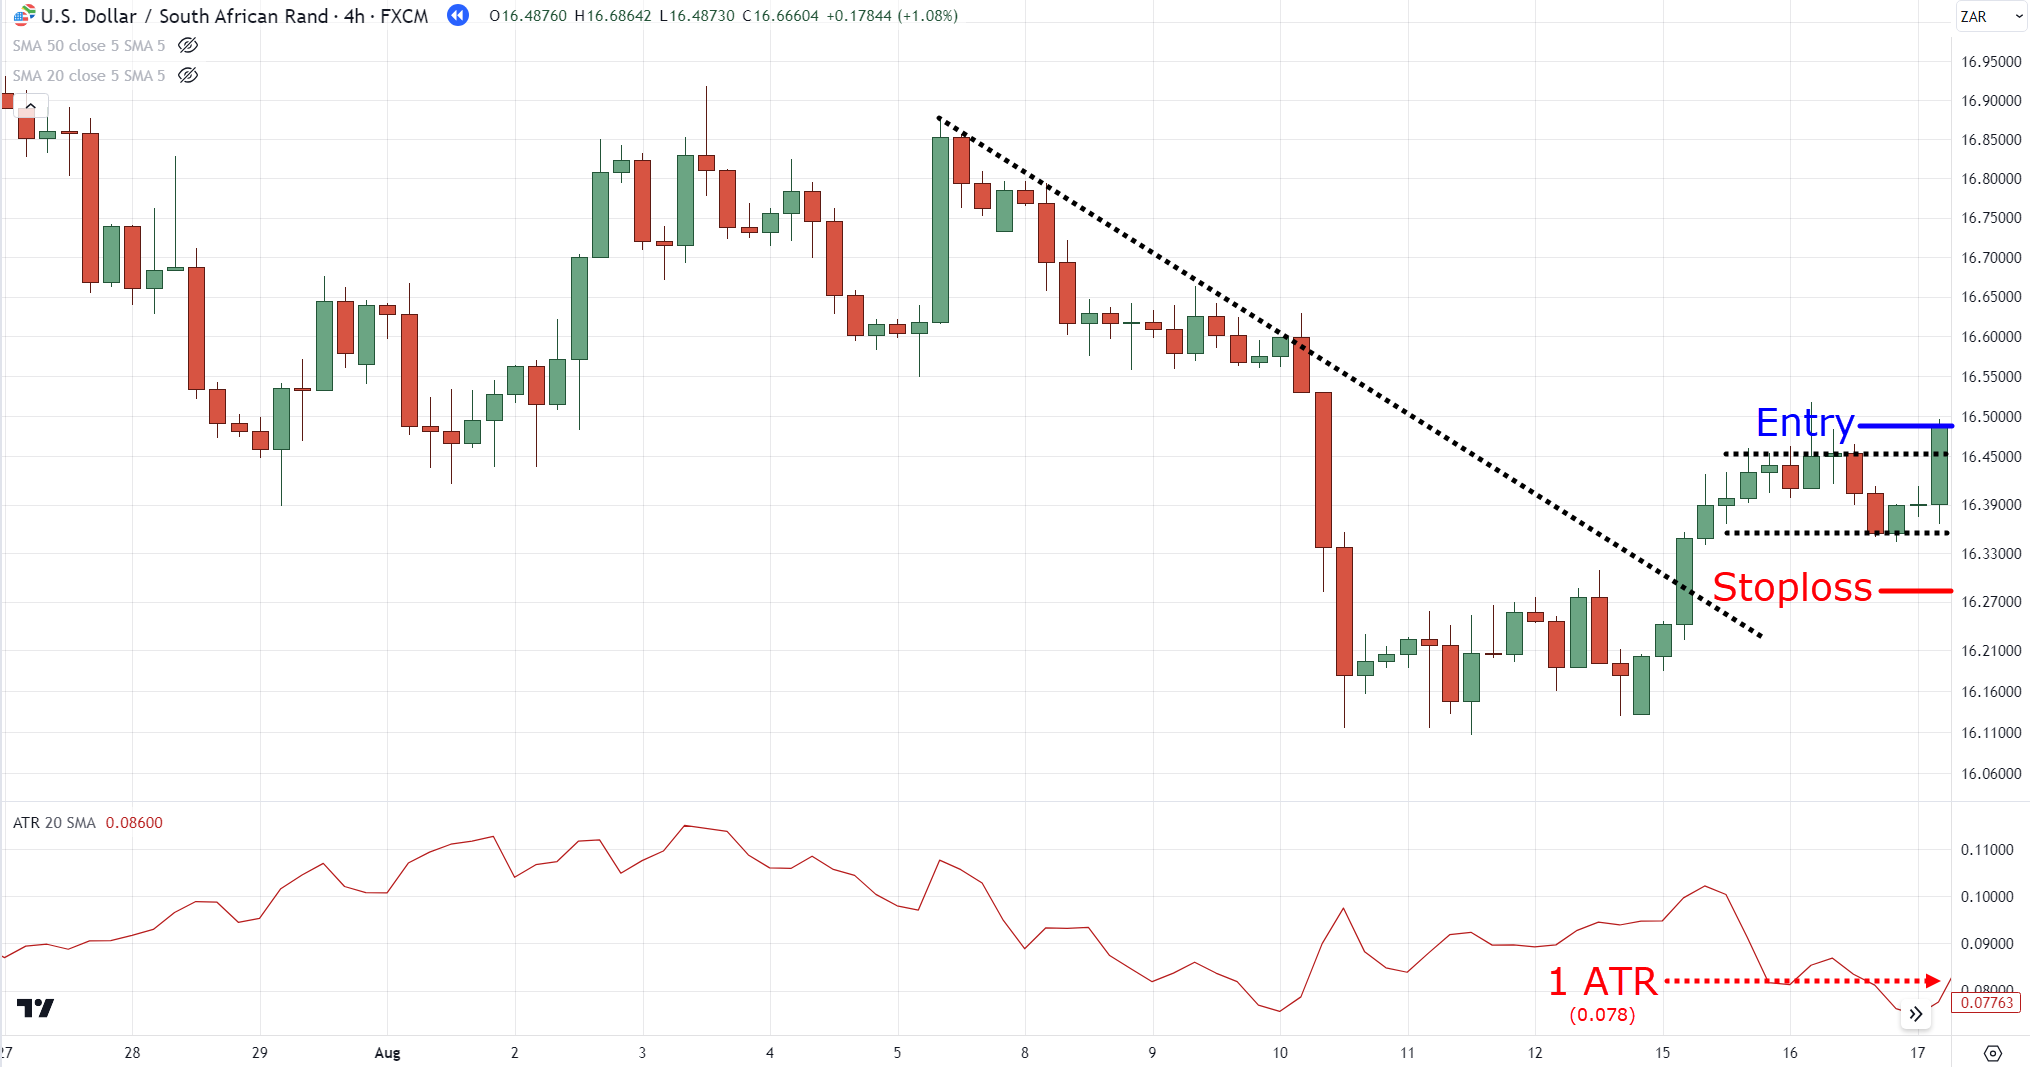
And again, this is the same chart we were looking at from the previous step!
P.S. You can use the factor of 4-6 when choosing timeframes (e.g. if your entry timeframe is the H1 your higher timeframe can be the H4)
Now…
Only the final step awaits in your journey.
Step #4: Trail your stop loss with the 20-period moving average on the daily timeframe
“Nani!?”
“What in the world are we doing this time?”
So this, my friend…
…is called transition trading!
It’s where we use the lower timeframe to enter and the higher timeframe to manage your trade.
Think of this as a security detail following your treasure.
And let me explain its inner workings based on our example…
Once you’ve entered your break of structure on the 4-hour timeframe, you go back to the daily timeframe and pull out the 20-period moving average…
You only exit the trade until the price closes (not touches) beyond the 20-period moving average…
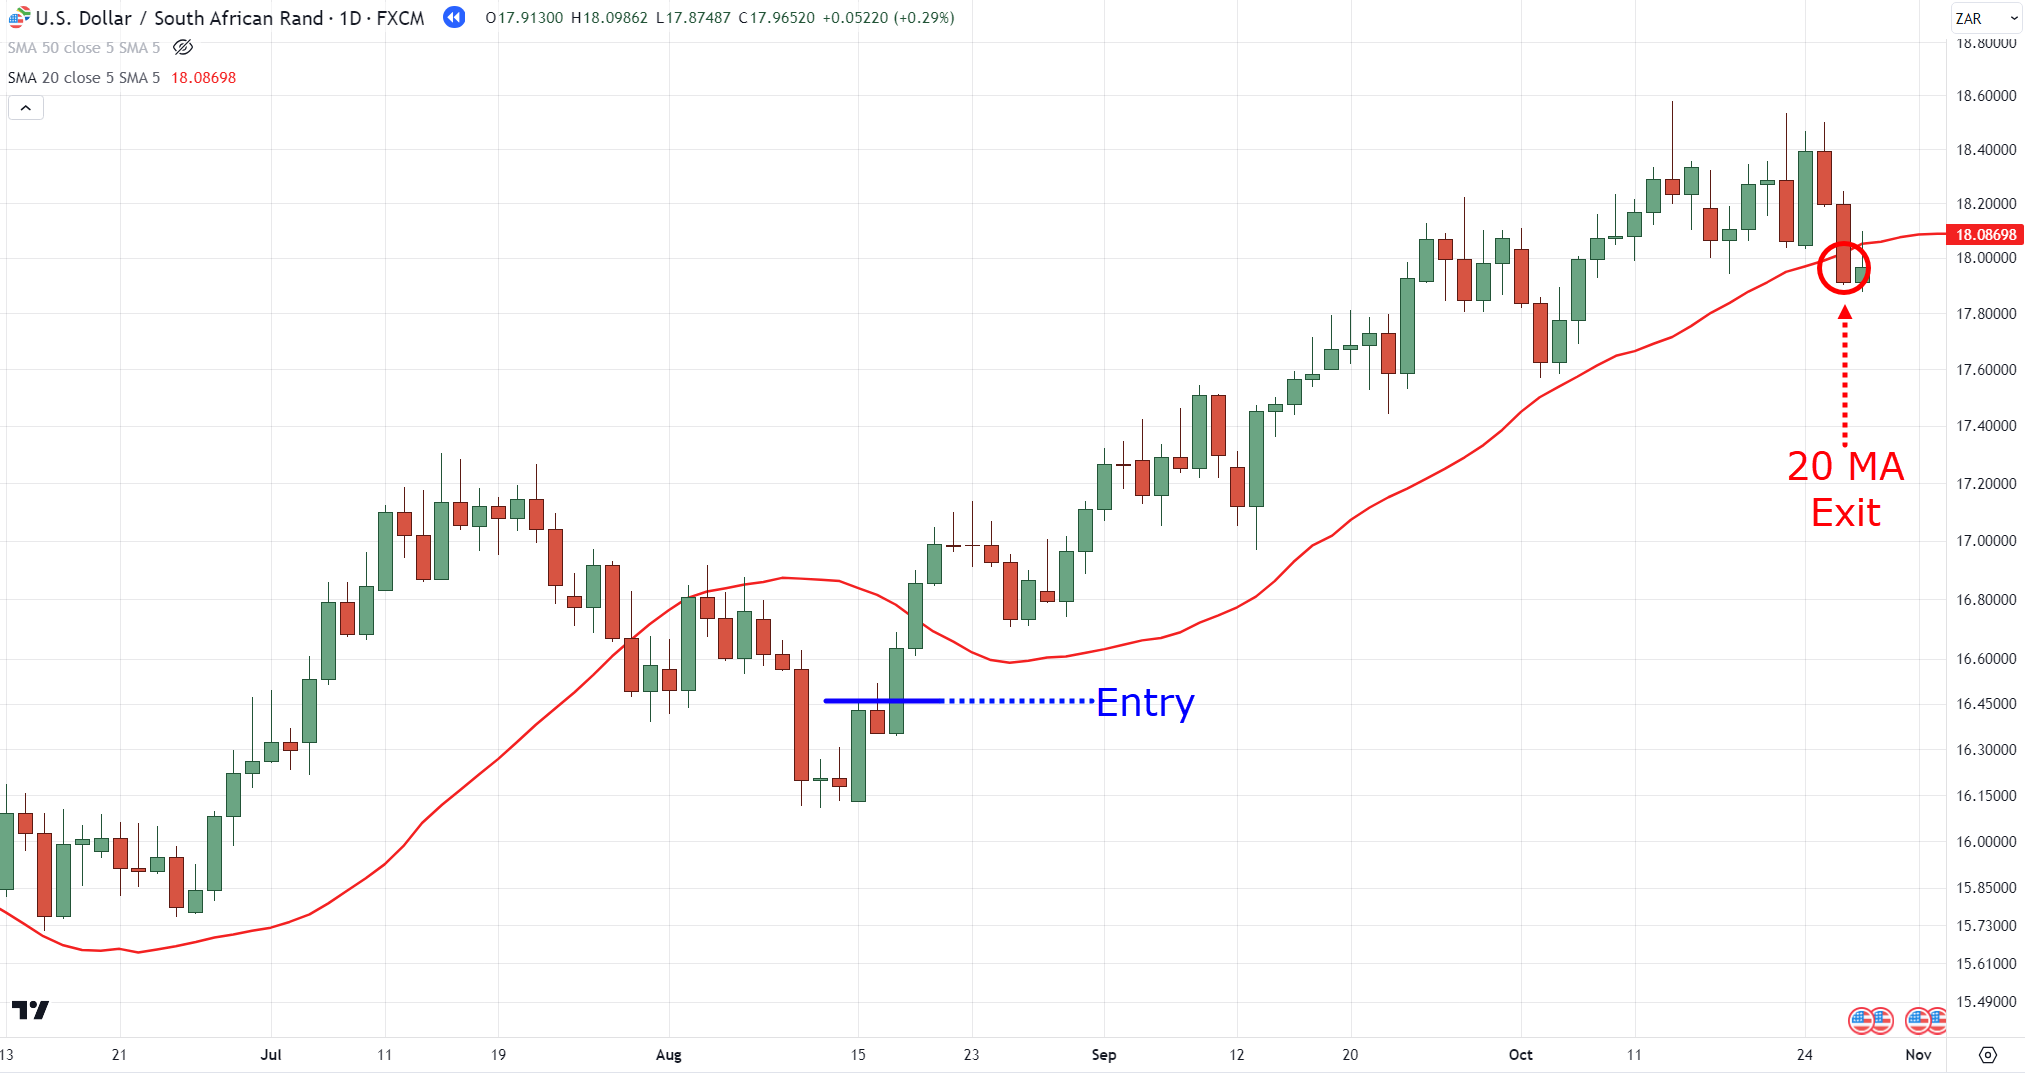
P.S. The price was below the 20 MA when we entered, in this case, the trade is still valid and you’d wait for the price to go above it.
And with your stop loss in place – there you have it!
You’re now the proud owner of a complete trend-continuation strategy using the ABCD pattern!
Now, I can already feel your questions rushing into my bloodstream:
“Why the 20-period?”
“Why don’t we use the 50-period moving average instead?”
Well, it doesn’t change the fact that we entered the lower timeframe, right?
To compensate for the moves on the lower timeframe…
We use a short-term moving average on a daily!
Make sense?
Good!
So at this point… Congratulations!
You’ve uncovered some of the core secrets behind ABCD pattern trading!
From identifying trends to hourly adventures, you’ve navigated the maze of trading with excellent strategy and a fair amount of wit!
So, to put this guide to an end, let’s have a quick recap of what you’ve learned today…
Conclusion
Compared to other chart patterns…
Learning how to trade the ABCD pattern is as simple as it gets… just like the alphabet characters it’s based on!
But just like any other chart pattern out there…
The ABCD pattern has its strengths and weaknesses as well.
While being able to hop into trades easily is great, traders can become prone to analysis paralysis, so watch out!
At any rate, here’s what you’ve learned today:
- The ABCD pattern consists of two impulse moves which are A-B and C-D, then one pullback move which is B-C
- When identifying an ABCD pattern, it’s crucial to stick to one timeframe at the same time and be open to its different variations, while being patient enough to wait for the pattern to complete
- When trading the ABCD pattern, it pays to wait for a healthy trend and a nice false break at the “D” completion before entering the trade
- One of the secret ways to trade the ABCD pattern is to use transition trading, by waiting for a break of structure on the lower timeframe and trailing your stop loss in the higher timeframe
And there you go!
A complete guide and strategy for the ABCD pattern!
With everything said and done, though, there’s still something I want to know from you…
Are you familiar with transition trading?
If not, do you wish to learn more about it?
How about the ABCD pattern… have you found success trading it before?
Let me know in the comments below!


