Video Transcription
Hey, hey! what’s up, my friend!
Have a look at this chart over here:
Let me ask you….
Do you think the price will reverse higher from support or will break down?
Let’s have a look at another example:
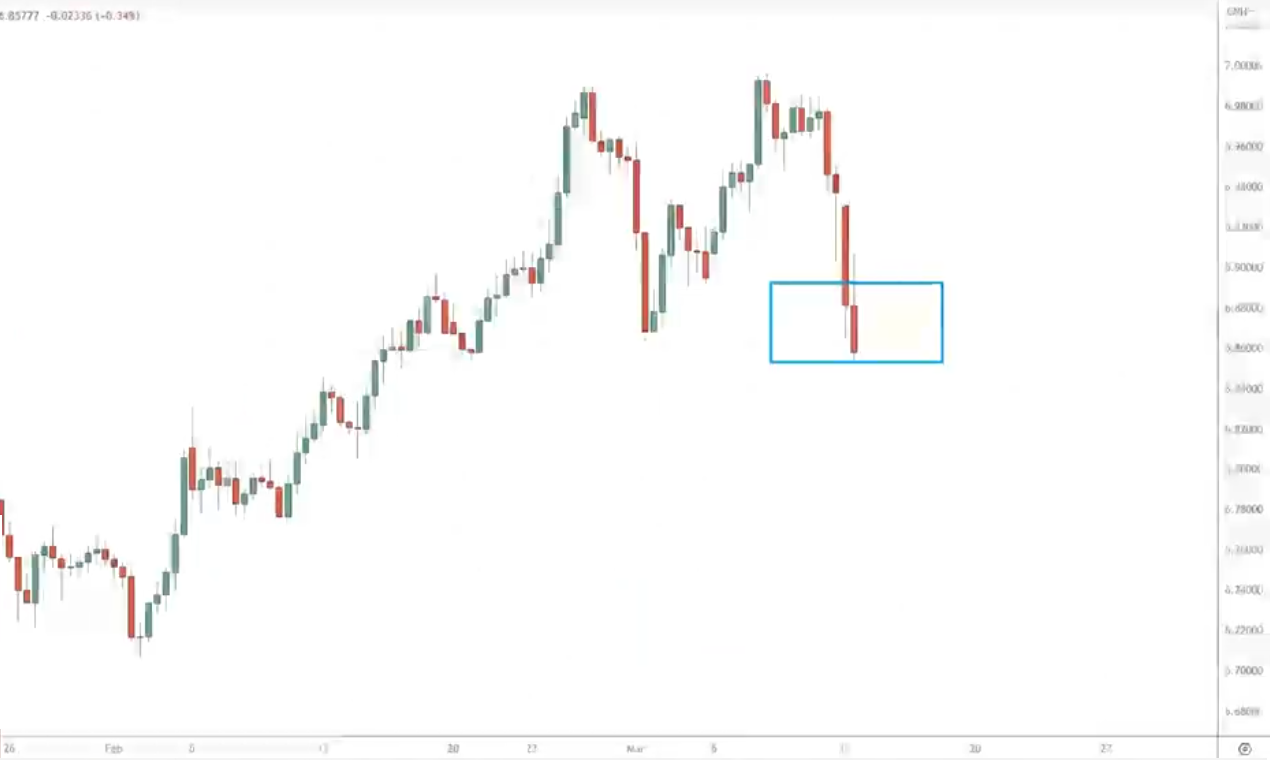
Do you notice how the price comes into support?
Do you think it’s going to reverse up higher or will the price break down?
For you to know this, you must first understand the two types of moves when the price approaches support or resistance.
Power Move
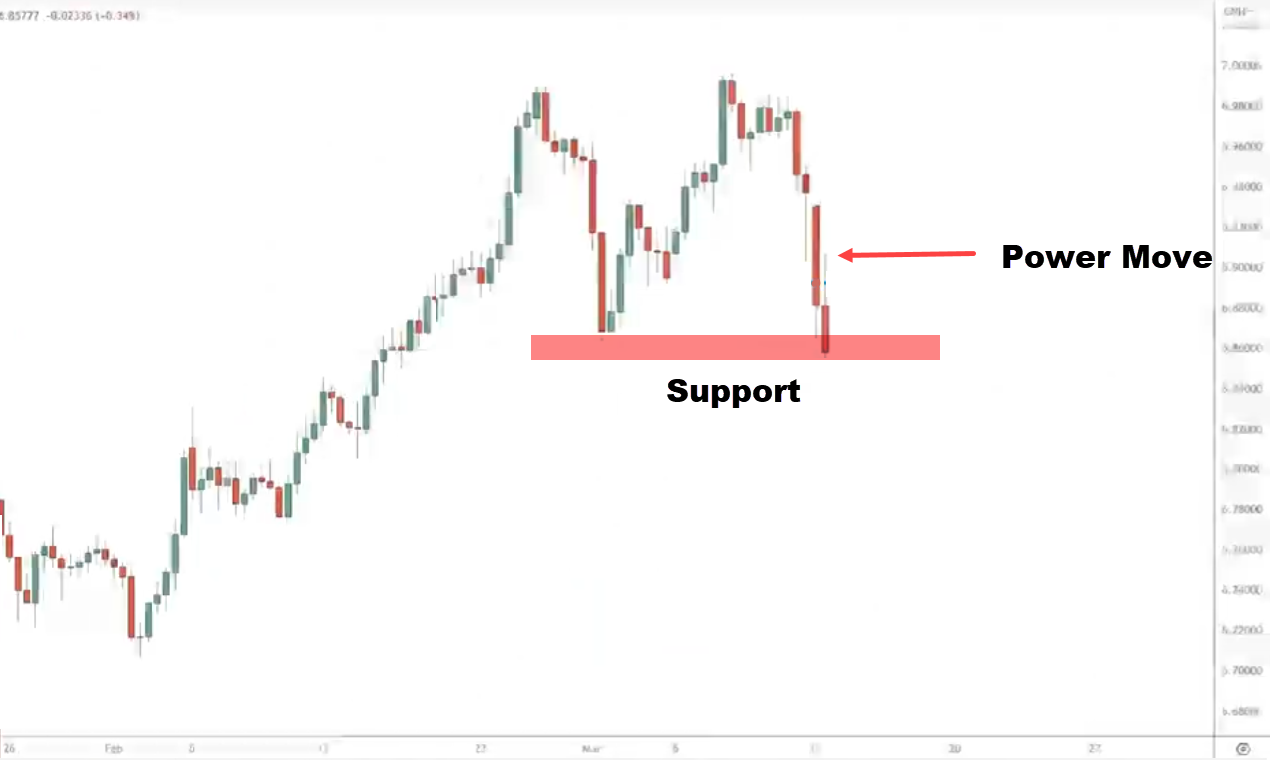
A power move into support
This is where you notice a series of big bearish red candles coming into support.
Illustration:
The market is in a range. it goes up and comes down with these big candles
A power move into resistance
This is just the inverse.
Where you see a series of big green candles approaching resistance.
This is what I call a power move.
Why is this significant?
A power move into resistance
Imagine that someone short in this area of resistance in the market:
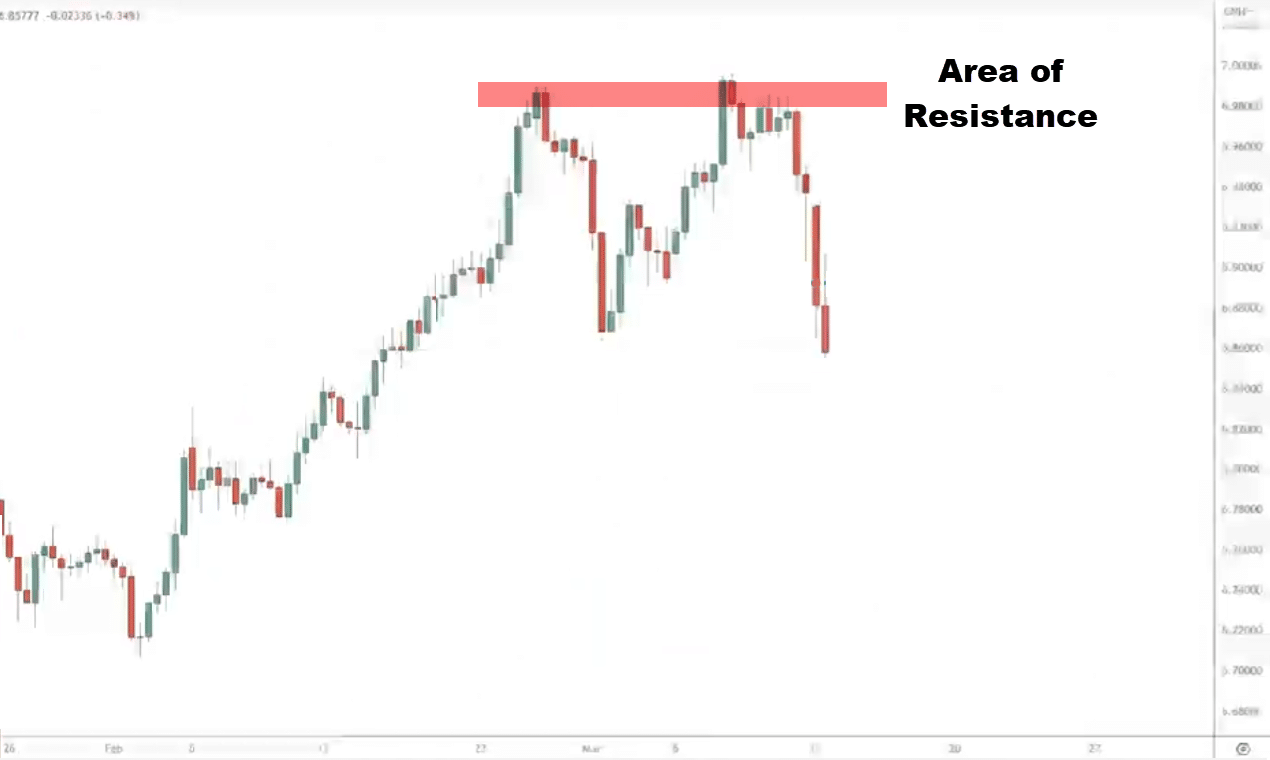
The trade quickly went in their favor.
They’re already sitting in profits in thousands of dollars.
What happens is that this group of traders, they have fears of giving back their profits.
They look to take profits and that would help induce buying pressure.
When you are short and exit the position, it’s a buy order and would create buying pressure to push the price up higher.
A power move into support
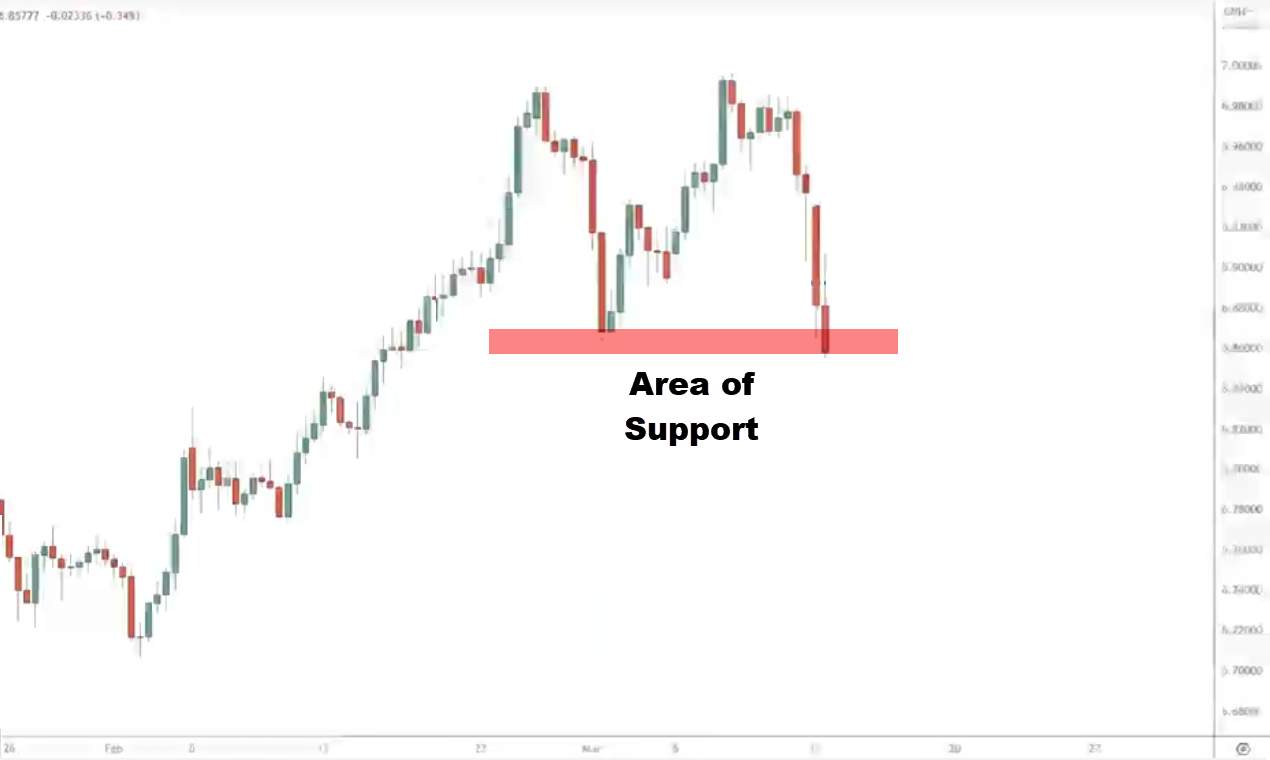
It is significant because it’s coming into this obvious area of support and traders who use technical analysis.
This induces buying pressure as well.
Power Move coming into an area of value
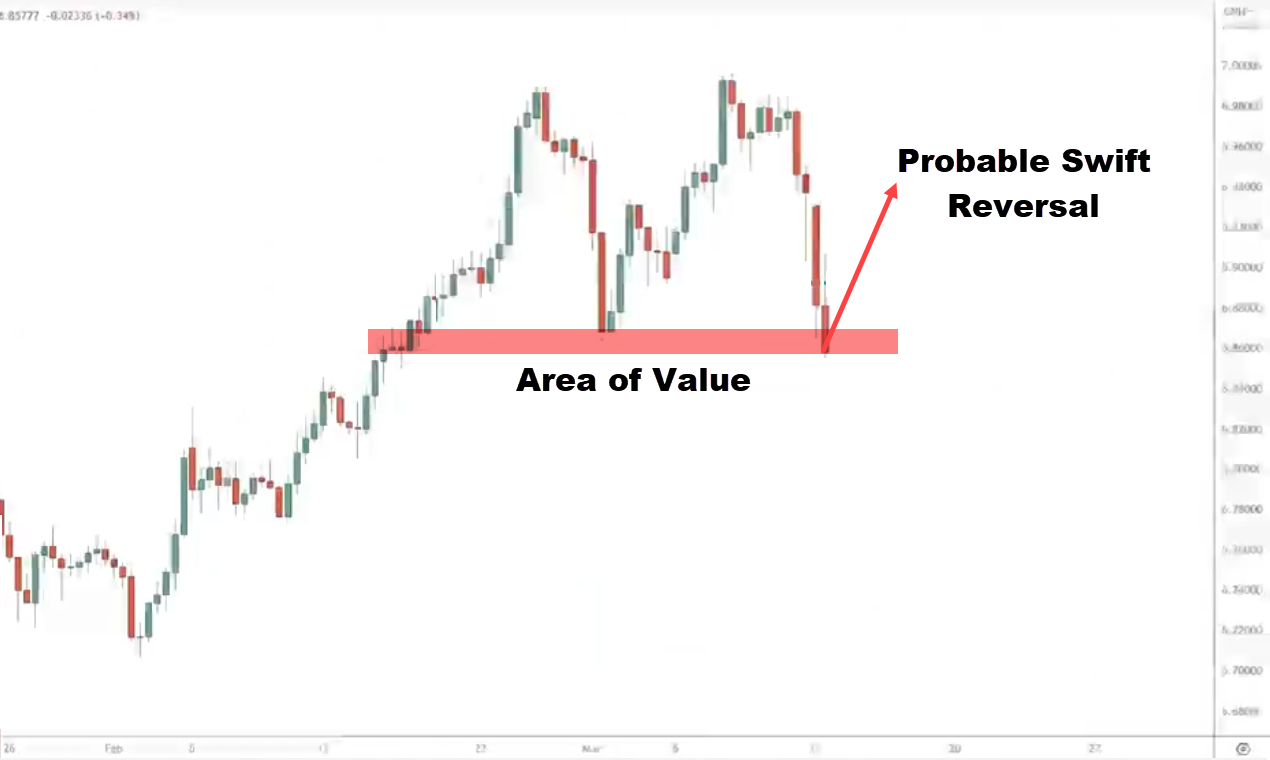
This is very important.
Whenever you see a strong power move coming into an area of value like support or resistance.
The reversal can be just as swift towards the upside.
Why is that?
It’s because there is no obstacle in the way or the obstacle is quite far away.
If you think about this,
You want to buy at an area of support.
If you understand the market structure.
Where is the next area of resistance?
It’s somewhere here, this is what I mean:
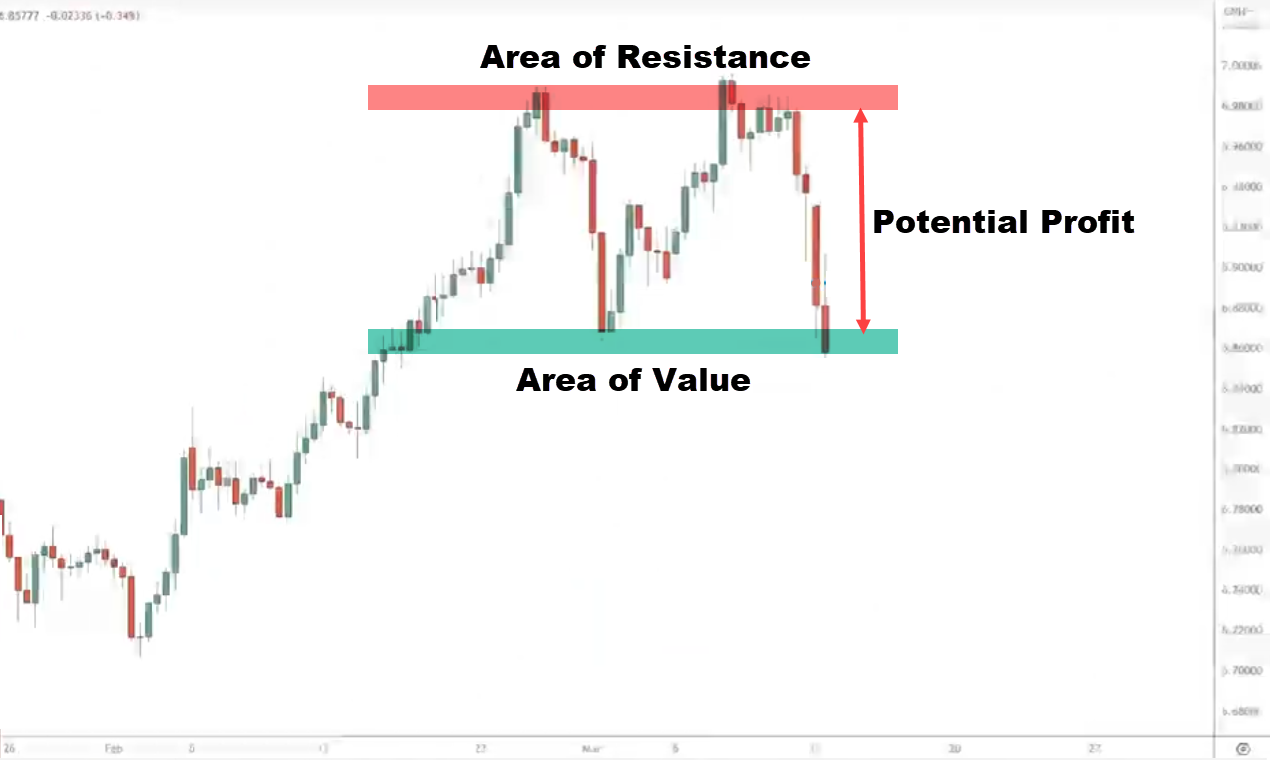
You can see that from support up to the area of resistance, this is your potential profit.
Your next obstacle is far.
There’s nothing to induce a selling pressure to push the price down.
This is why when you see a power move into an area of value, there are times when the reversal could be just as swift toward the upside.
The Crawler Move
Crawler Move into Support:
This is when you get a series of lower highs into support. Let’s say this is an area of support:
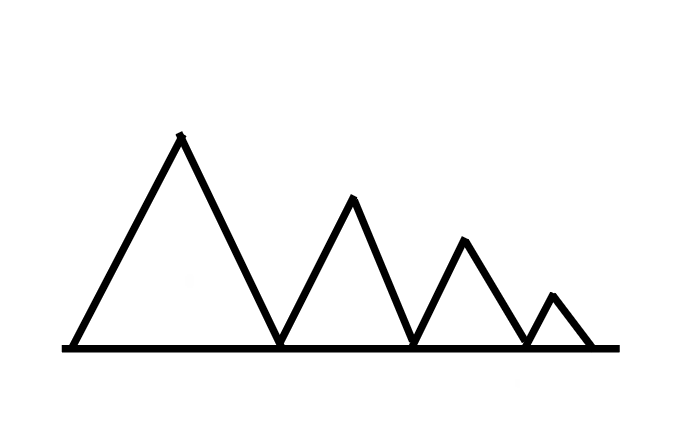
The market goes up and comes down, you notice that it gets weaker and weaker from the upside.
If you look from left to right, you notice a series of lower highs.
This is what we mean by lower highs into support, a crawler moves into support.
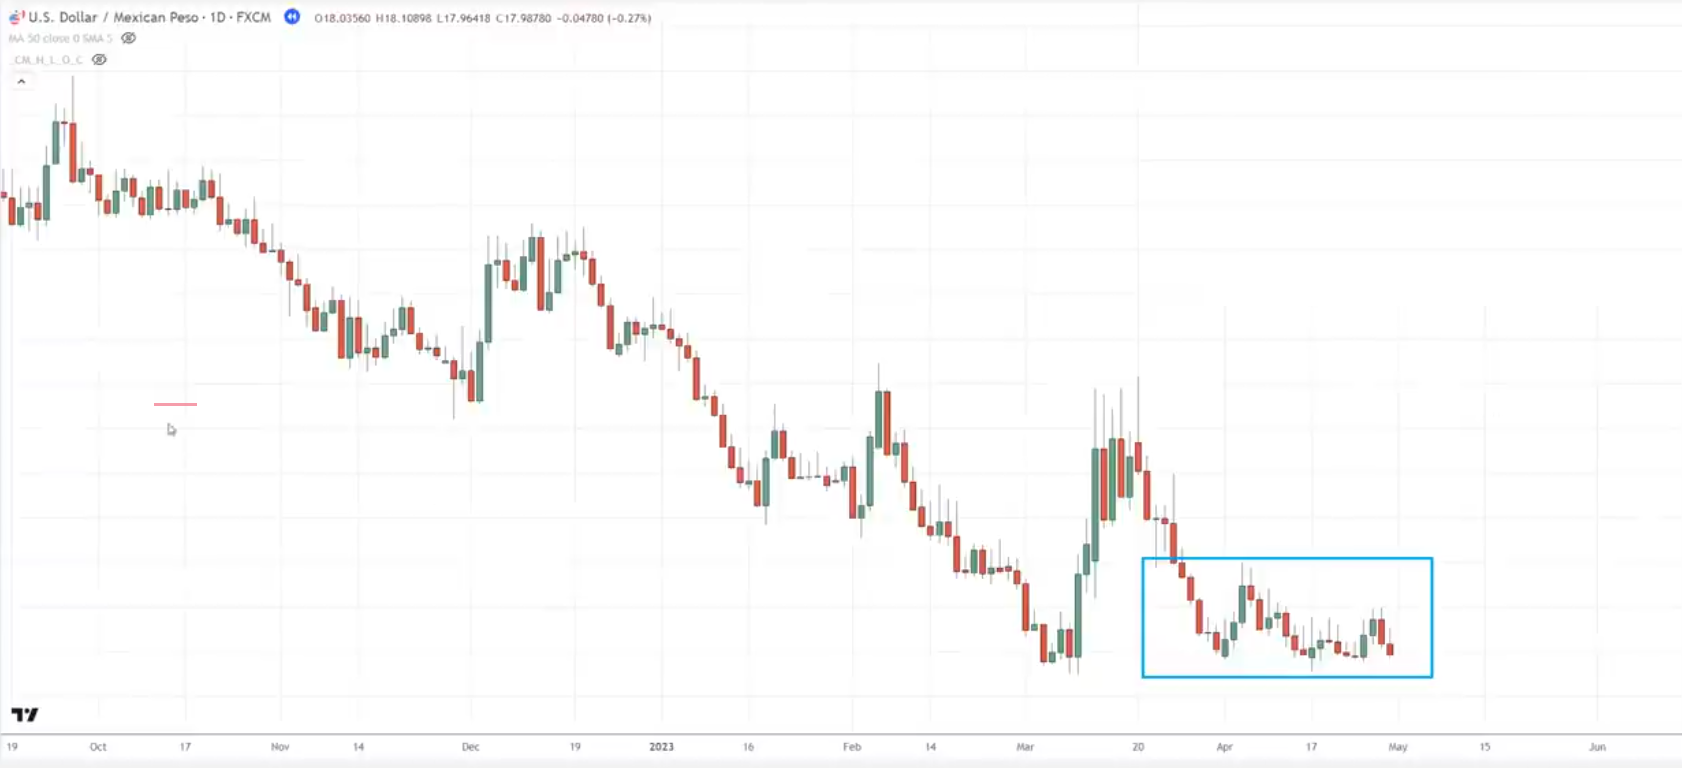
When I see a crawler move into support, to me it’s a sign of weakness or this tells me that selling pressure is stepping in.
Why is that and how do I know that?
You can see the sellers are willing to sell at these lower prices.
Imagine if you are a seller and you’re selling close to resistance, it doesn’t quite make sense.
Unless you think if support does break then it’s a good price to short
But if you don’t think that the price would break support, then it doesn’t make sense to short near support.
The sellers are confident.
They’re willing to sell at these lower prices because they expect support to break.
When you notice a series of lower highs into support, more often than not it leads to a breakdown.
That’s not all because of naive traders they say;
“Oh man Rayner look the price is coming to support”
Guess what?
They’ll buy.
Where would they put their stop loss?
They put their stop loss just below the lows of support.
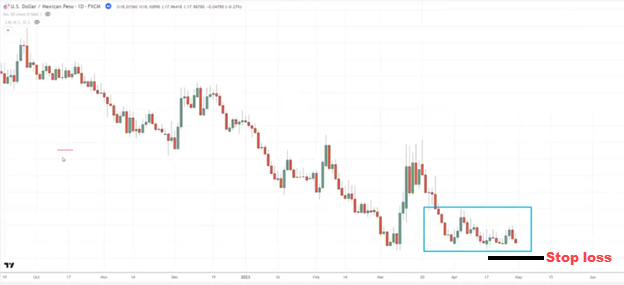
If enough new traders do that and enough stop losses are below this area of support.
This adds fuel to the fire because if you think about someone with a long position, their stop loss is a short order to get out of their losing trade.
If the price goes down and hits their stop loss which is a short order, they feel even more selling pressure causing the price to hit lower.
For these few reasons, the crawler move is a sign of weakness or rather a sign that you know that sellers are about to drive the price lower.
Crawler move into resistance
This is when you get a series of higher lows into resistance.
On the other hand, if you see a series of higher lows into resistance as you can see over here:
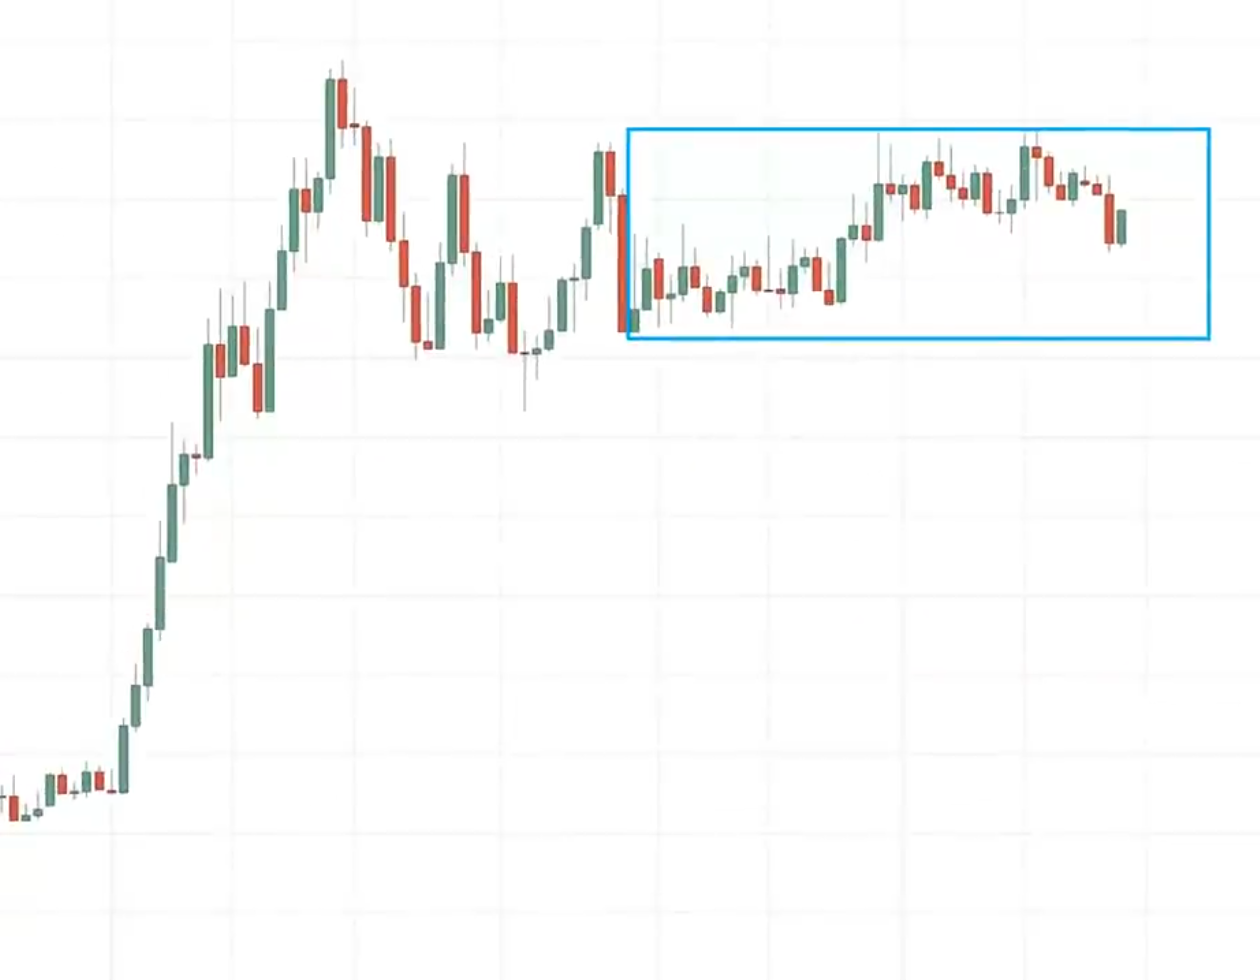
This is a sign of strength.
Why is that?
The inverse is true because you can see that the buyers, initially bought and they pushed the price up higher before making a pullback.
You can see that each subsequent low is higher than the one before:
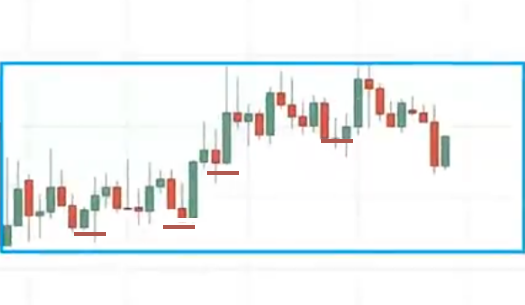
If you think about this, who in the right frame of mind wants to buy just in front of resistance?
This tells you that buying pressure is stepping in.
More often than not, when you see a series of higher lows coming into resistance the market is likely to break out.
Trading Strategies to Profit in a Bull and Bear Market
We will be using the MAEE formula
Market Structure
What is the market structure that you’re seeing on this chart?
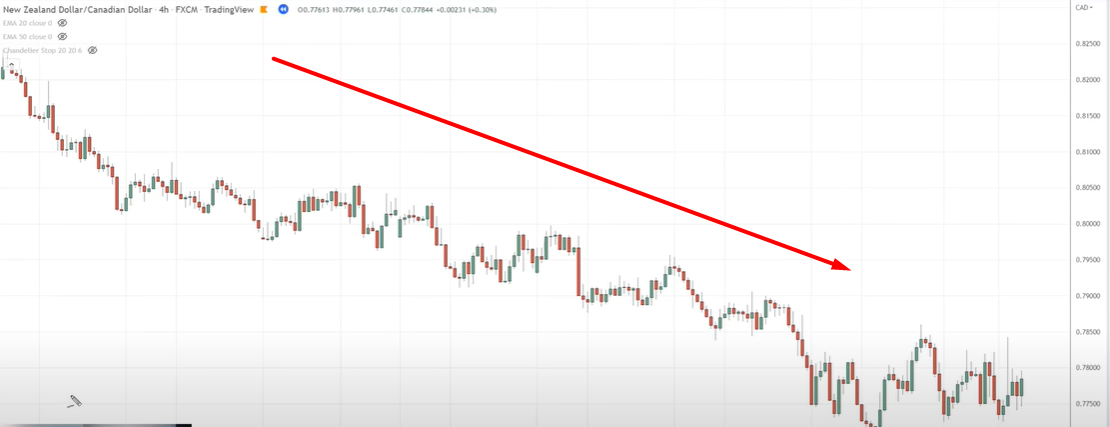
The market is in a downtrend.
Knowing that the market is in a downtrend, where will you look to trade from?
Area of Value
Where is the area of value that you want to pay attention to?
In this case, the real area of value is at resistance. This is what I mean:
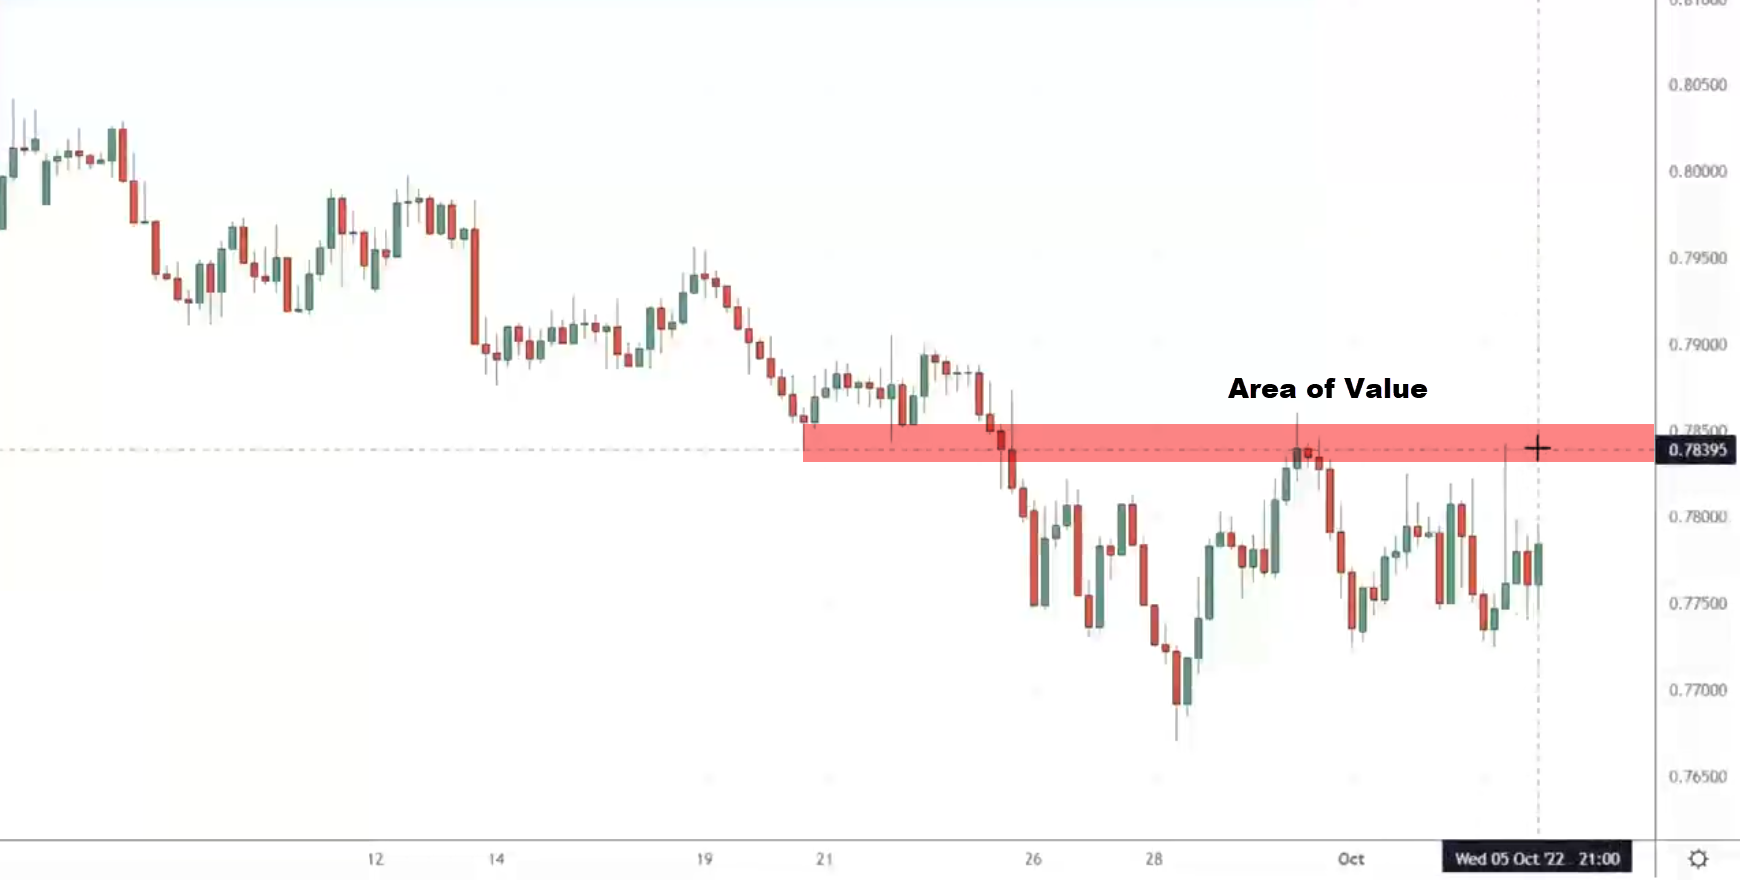
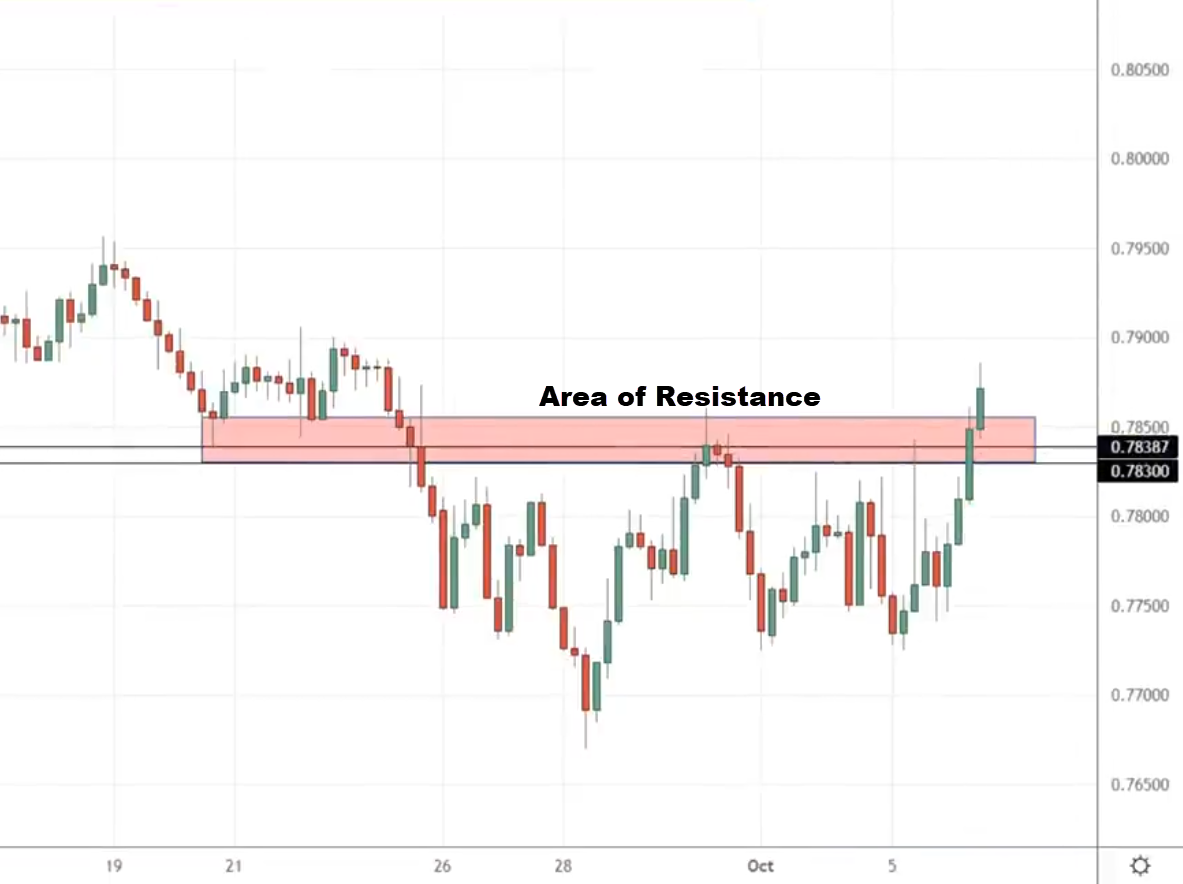
The next thing to do is to wait for the market to come towards your area of value. You can see the market hit up into resistance and break. This is what I mean:
Entry
At this candle over here, we have a valid entry trigger this is what we call a bearish engulfing pattern:
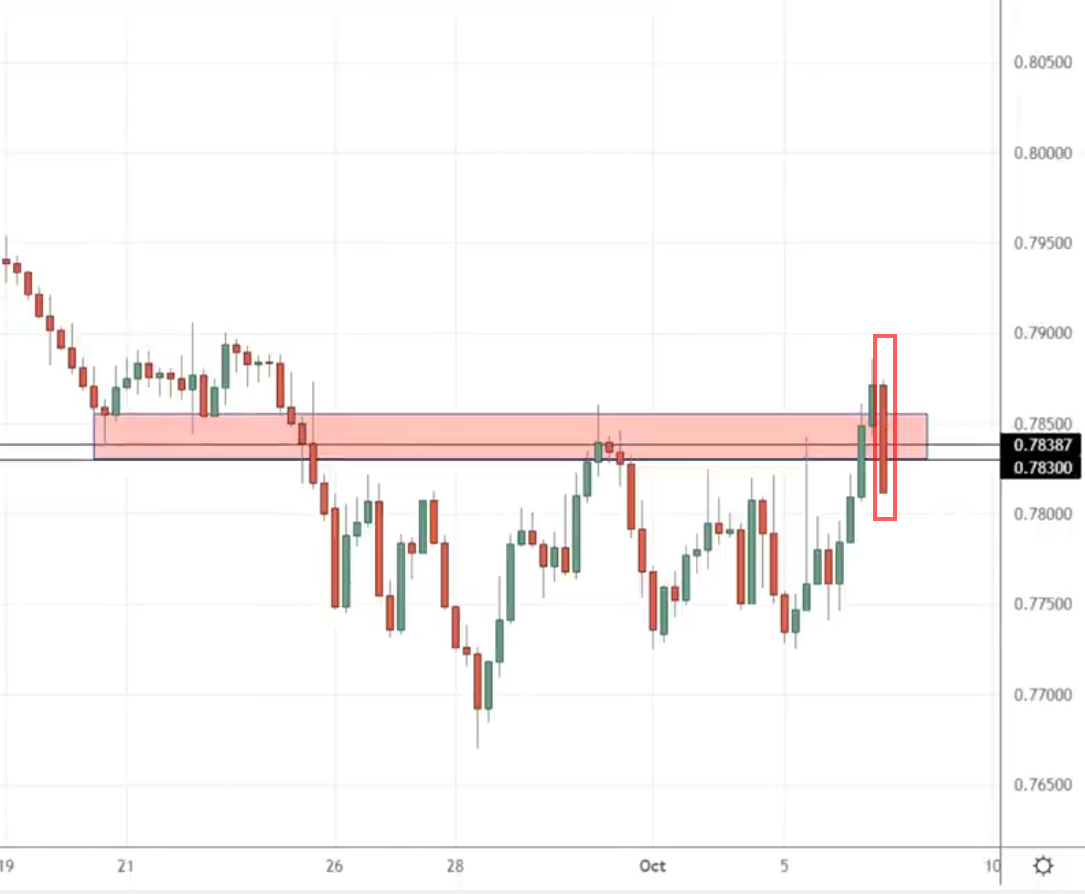
The story behind it is similar to a shooting star pattern, where the buyers were initially in control and then they quickly disrupted the market and got pushed down by the sellers closing below resistance.
This is a false break as well, the market took off the highs and quickly reversed back into resistance.
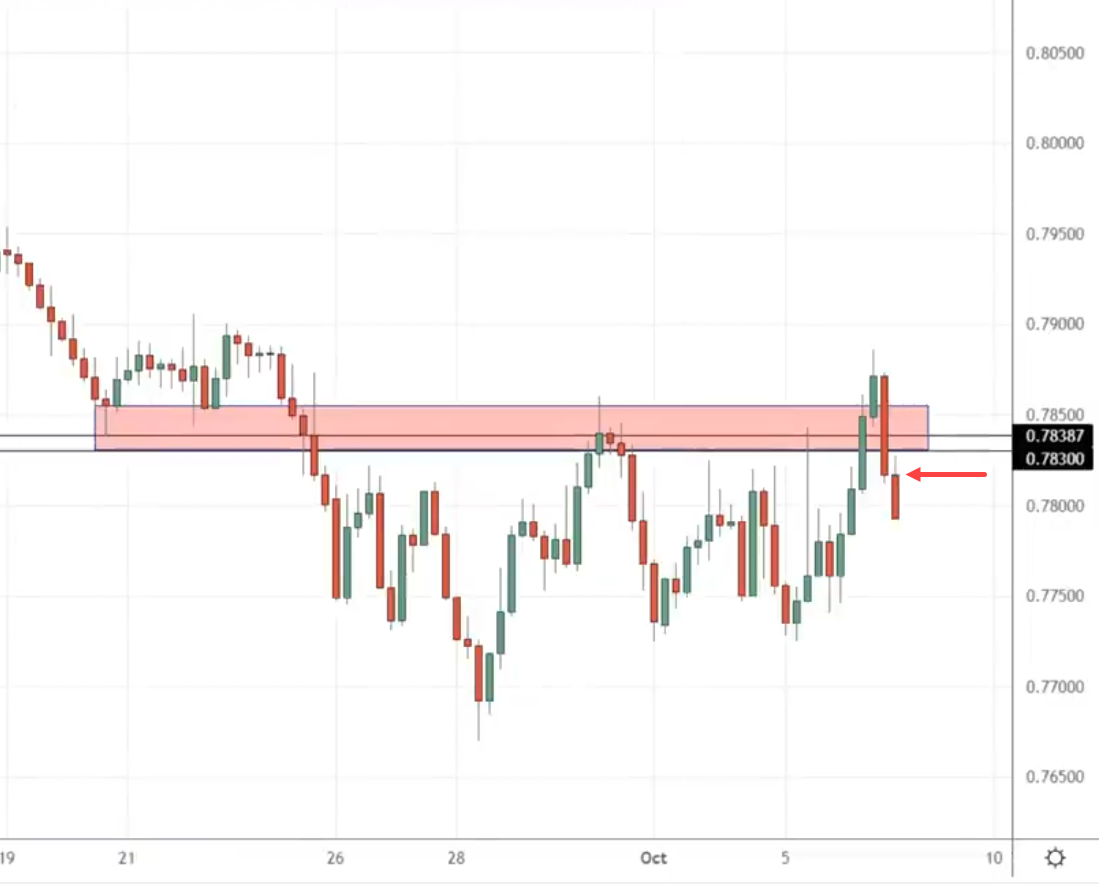
What you can do is enter on the next candle open.
Exit
What about our stop loss?
In this case, again you can pull out the ATR indicator:
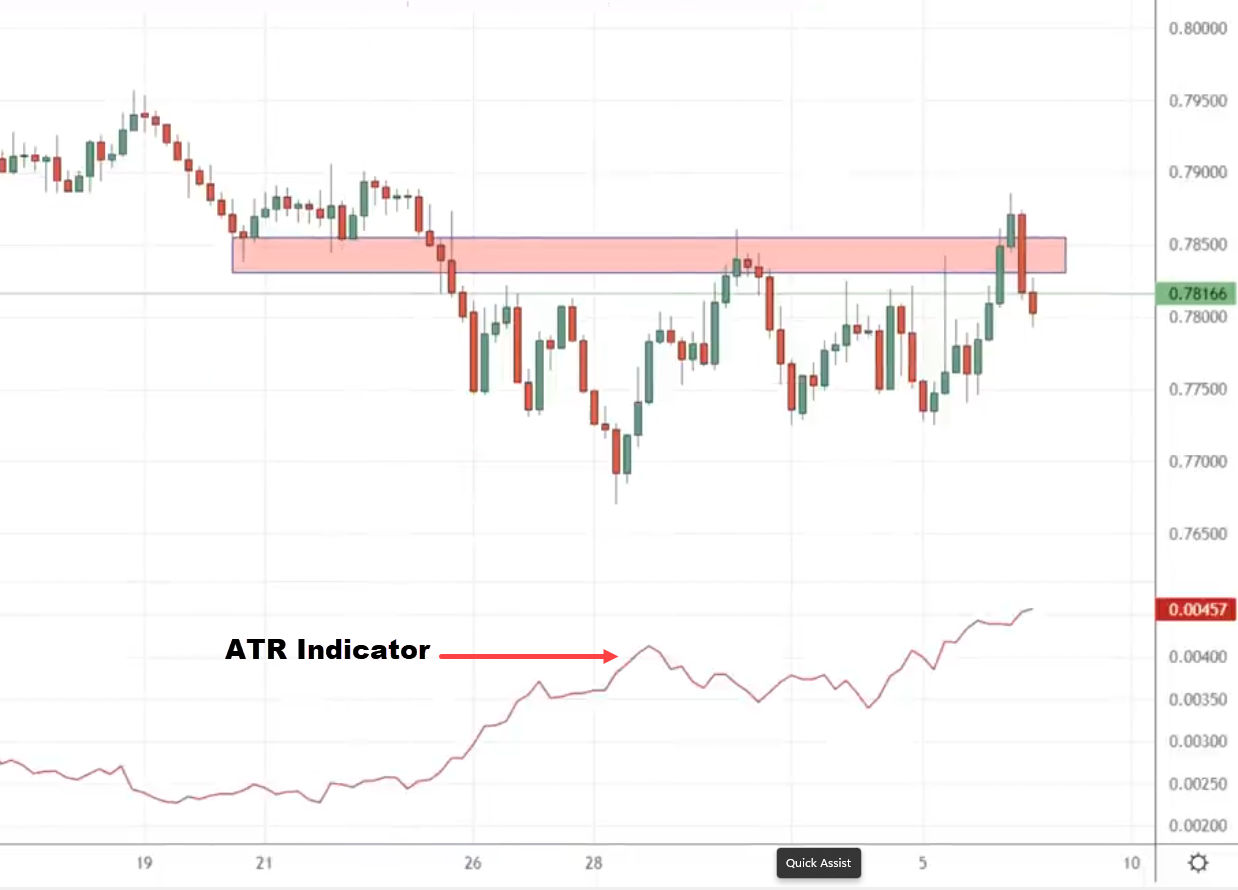
What we are trying to do here is to set our stop loss a distance away from the resistance because we don’t want to get stopped prematurely.
What you’ll do is find out what is the high.
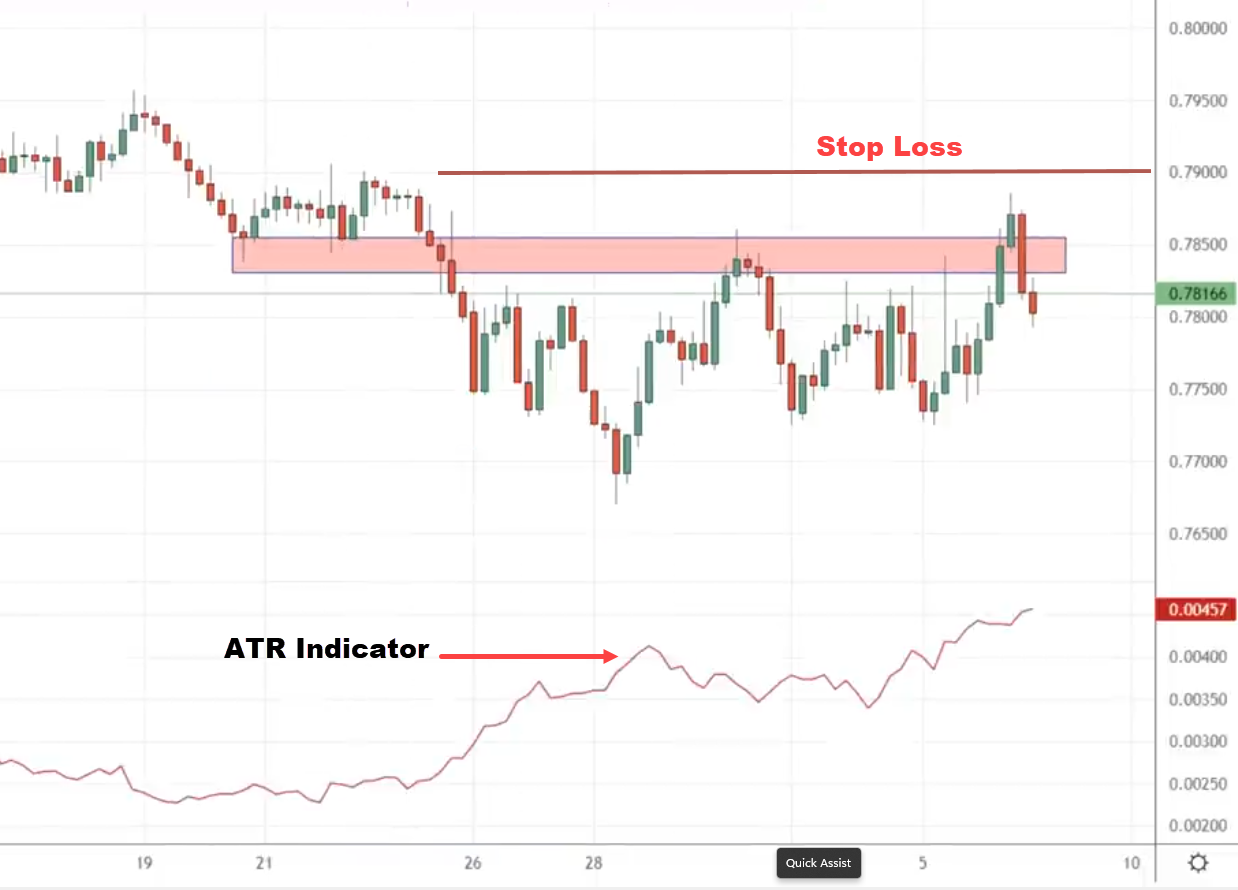
Then add one by this number of ATR value
In this case is about 45 Pips.
That gives you 7930.
Your stop loss will be placed at 0.7930:
Where is your target?
If you look at the target, two levels show up:
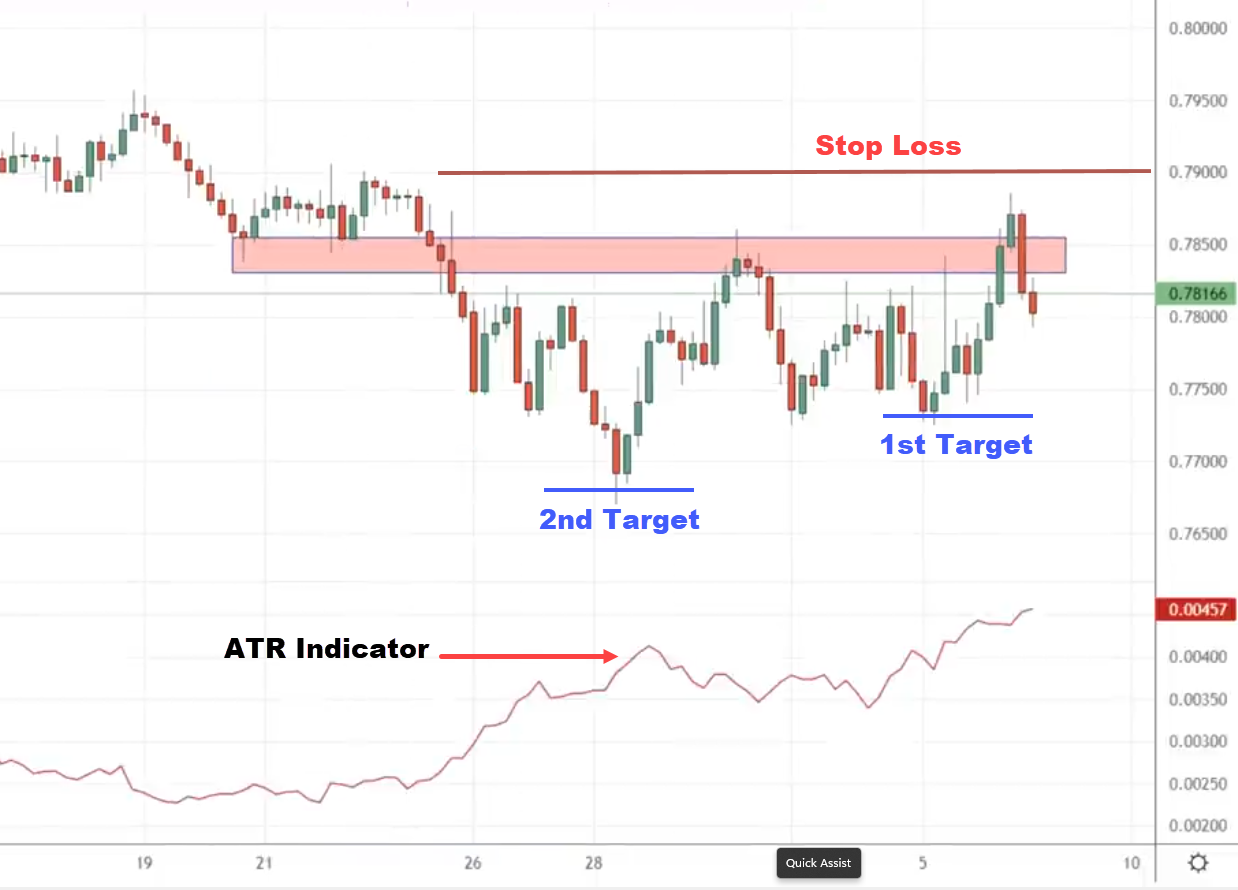
This recent swing low and this second one is further away
In this case, I like to have a conservative target.
You can have your trade all exit at the first target.
That’s a valid thought process.
At the same time, you might be thinking…
“But Rayner, if you look back at this market it is in the downtrend”
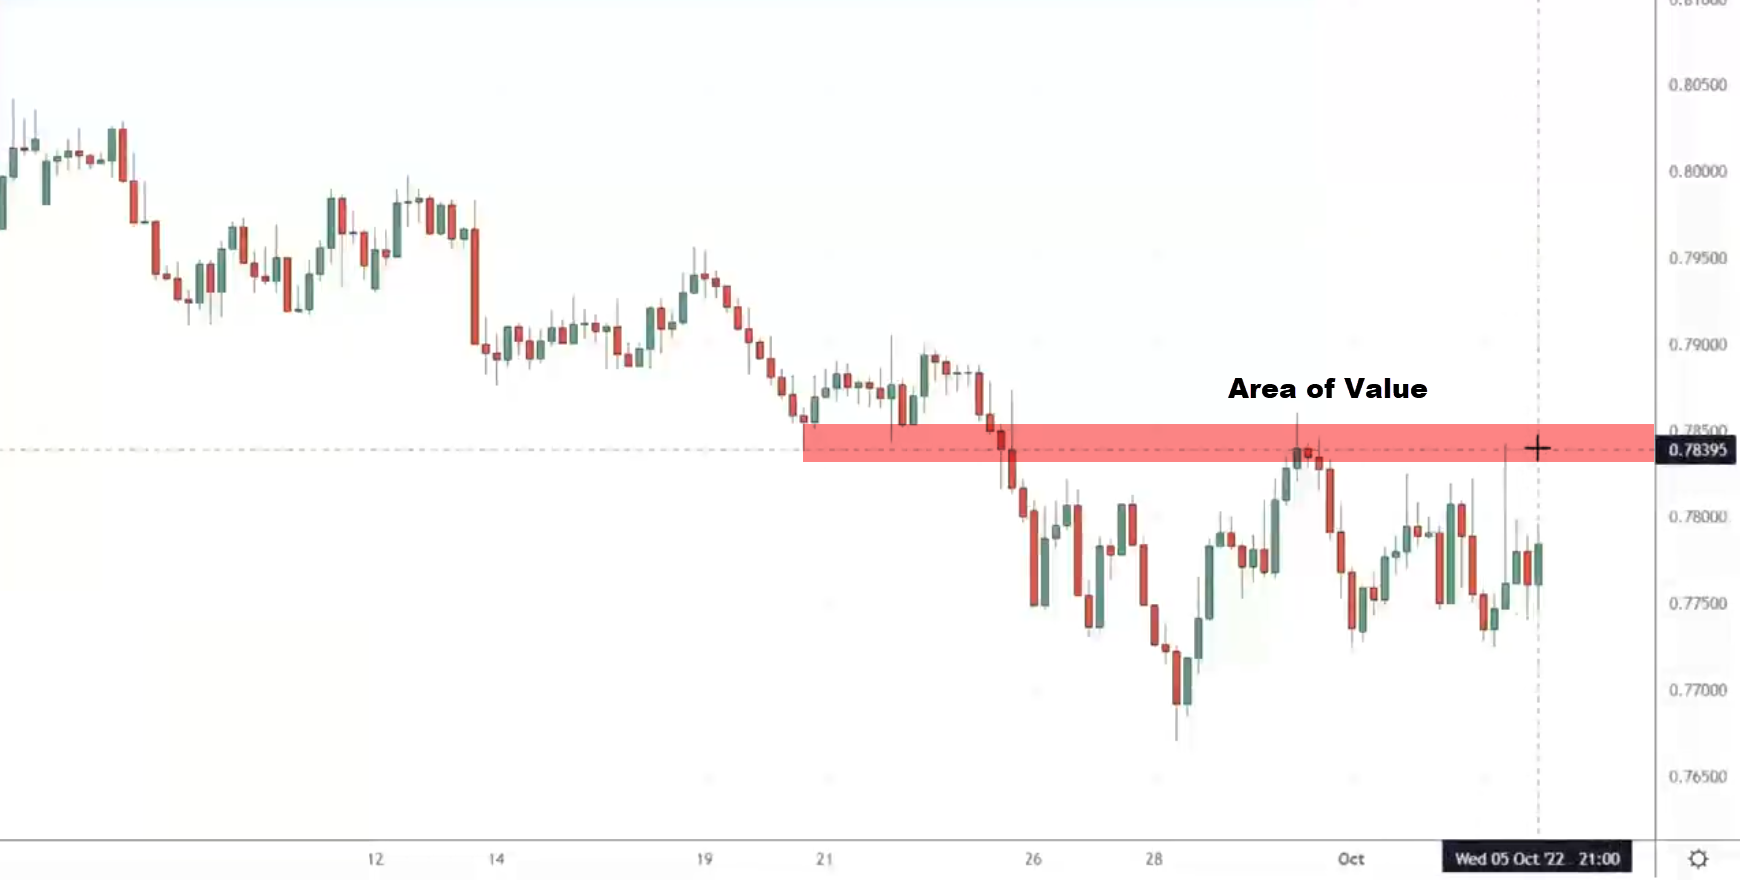
The price tends to break below the lows.
Won’t we be giving up some potential profits because we can still look to capture these additional moves as the market breaks down?
What you can do in this case is to have two targets…
- More conservative target
- A further target
As you know, the market is in a downtrend and it could break below the lows and go a little bit further.
How can you do this objectively?
What you can do is you can use a tool called “Fibonacci extension”
Then look to exit just before the 1.27
You look at the Trend-based Fibonacci extension.
You draw it from the swing High to the swing low:
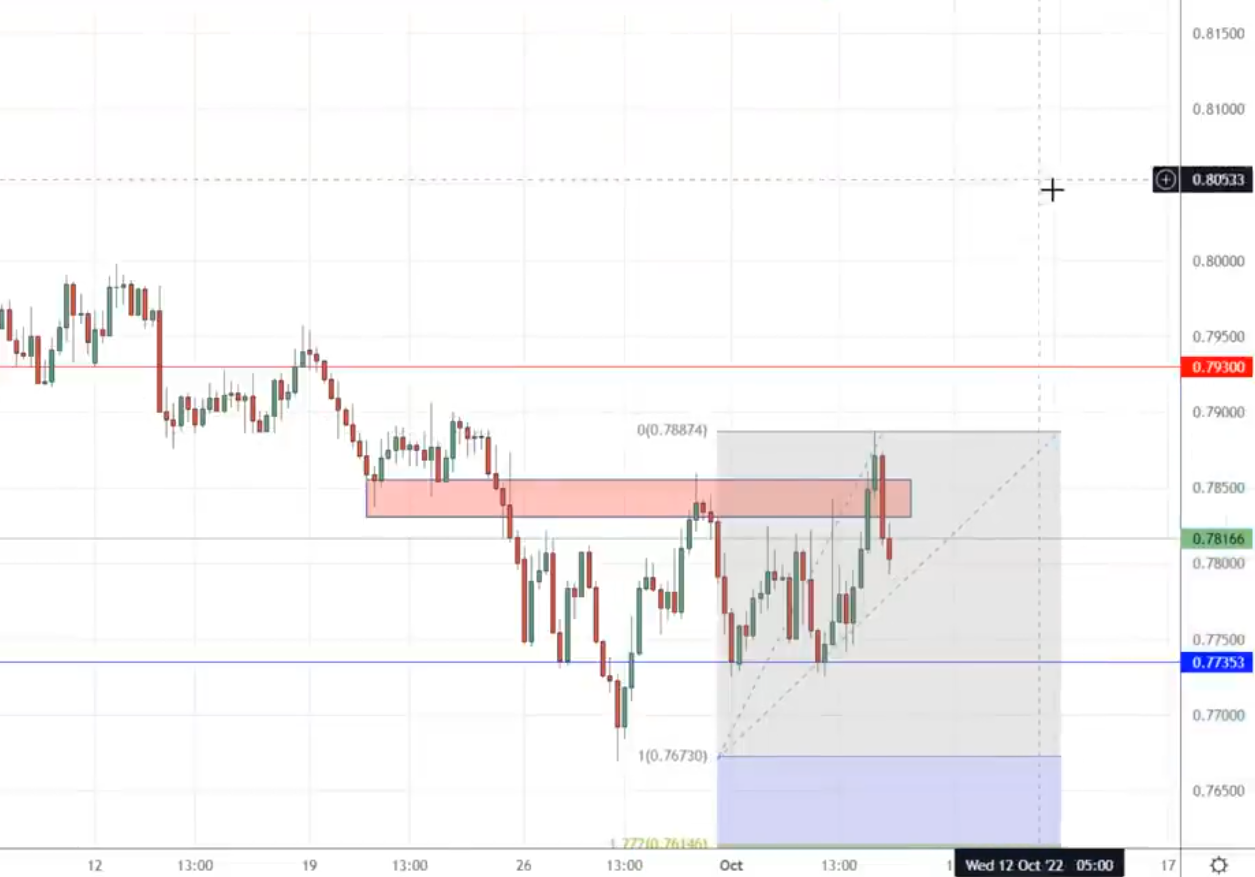
This is an objective way where you can look to set your second target.
You can use this to project where the market would go.
The question is where exactly do you take profits as the market breaks down lower?
This Fibonacci extension gives you a little bit of objectivity to it.
Usually what I do is that I set my stop loss at a logical level.
How to Ride the Short-Term Uptrend Using the MAEE
What you can do is to use the 20-period moving average. This is what I mean:
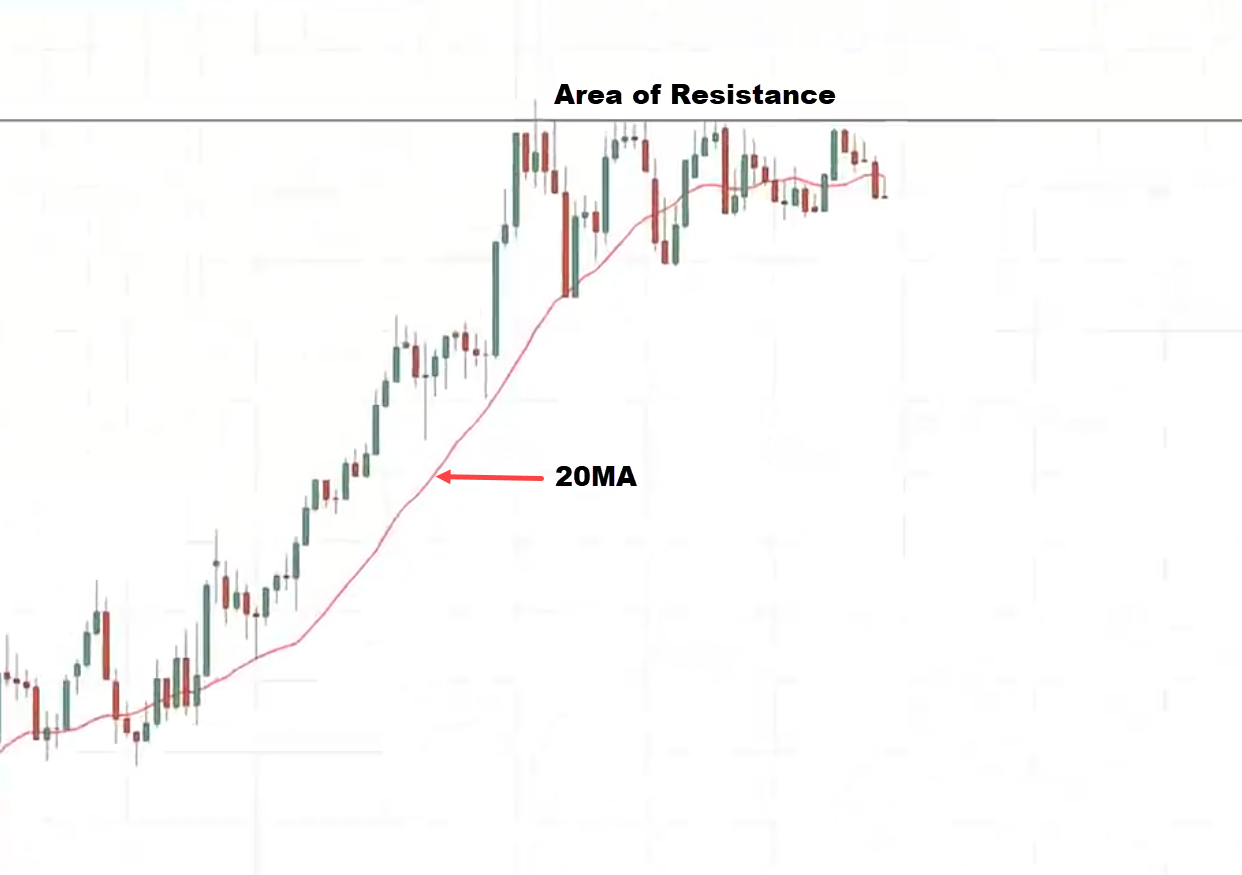
You can see the red line.
What happens is if the market breaks out higher.
You go long…
The 20-week moving average will naturally move up along with it.
If it closes below it, then you exit the trade.
Examples
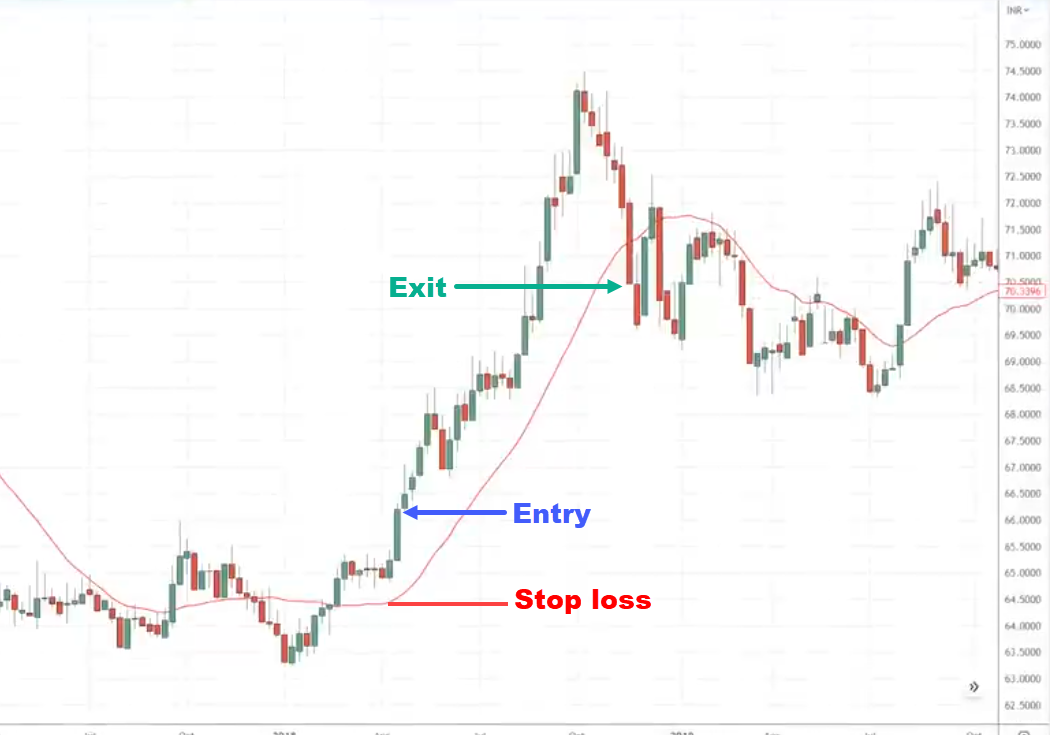
Your entry is as shown after the breakout.
Let’s say your stop losses is below the resistance.
You have your exit
Notice the market at this candle break and close below the 20-week moving average.
There is where you exit your trade.
What if the market doesn’t break out?
What if the market doesn’t break out, it’s not consolidated, and comes down lower?
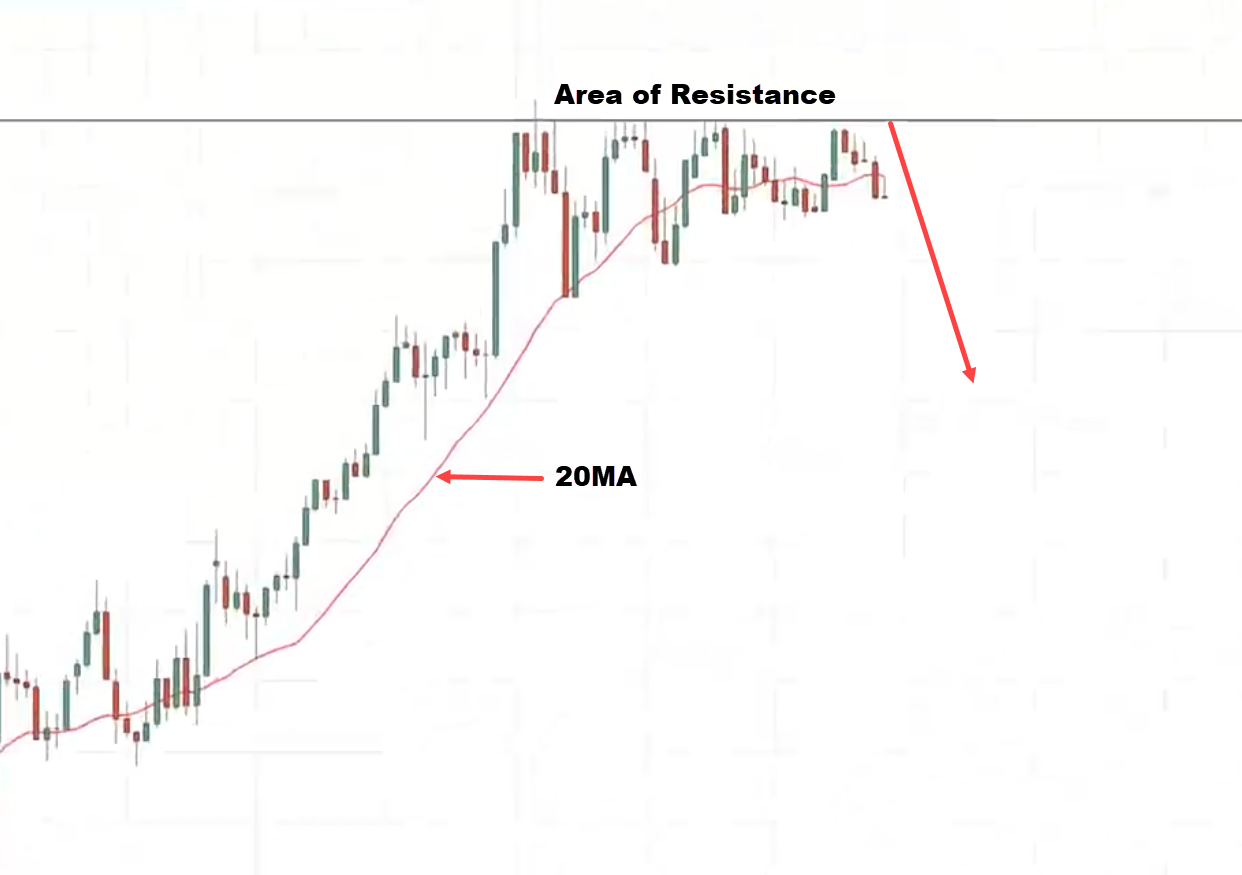
If you’ve been paying attention earlier there’s another potential trading opportunity.
Let’s say that this is an area of support, this is what I mean:
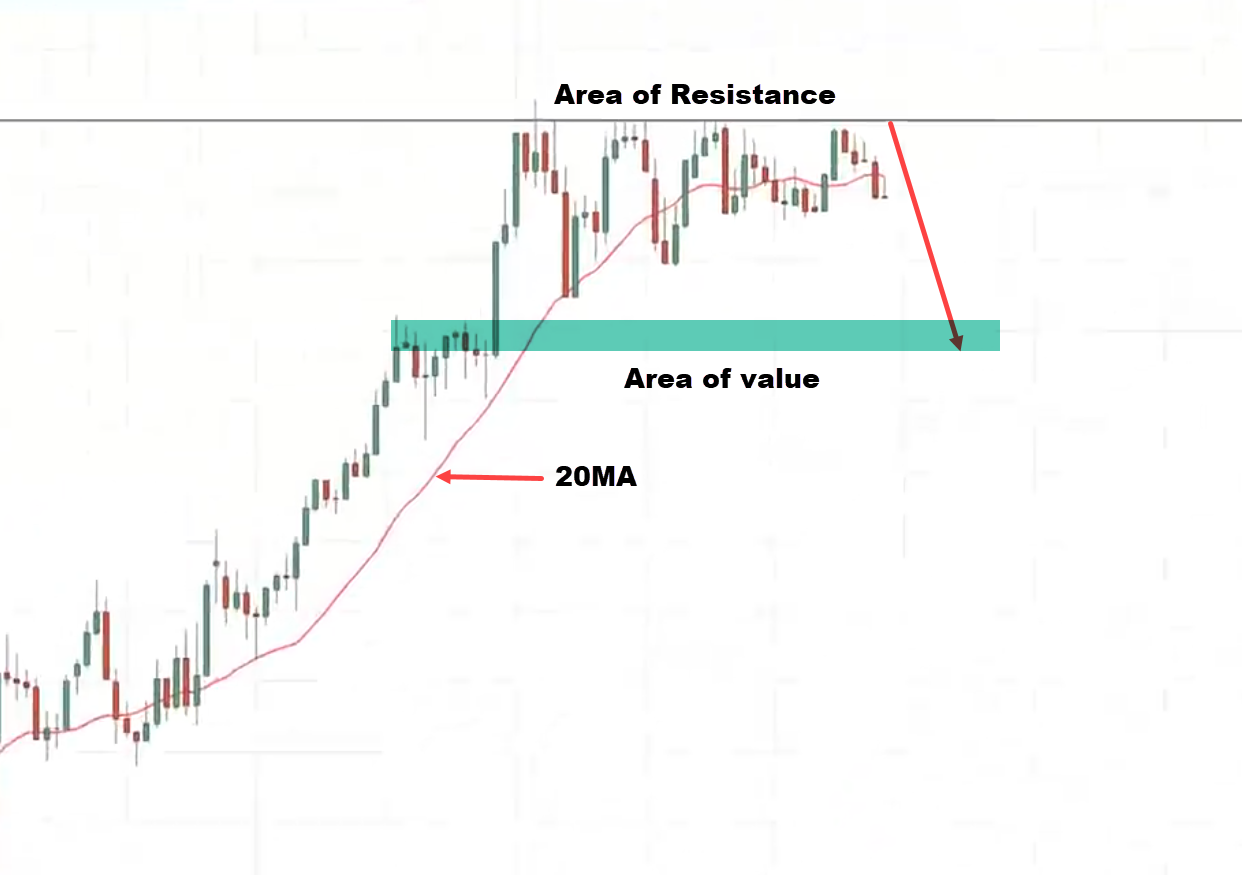
If the market comes with a power move into this area of support
Are you looking to short or long the market?
You can look for a reversal higher allowing you to capture one swing higher into resistance.
Here is what I mean:
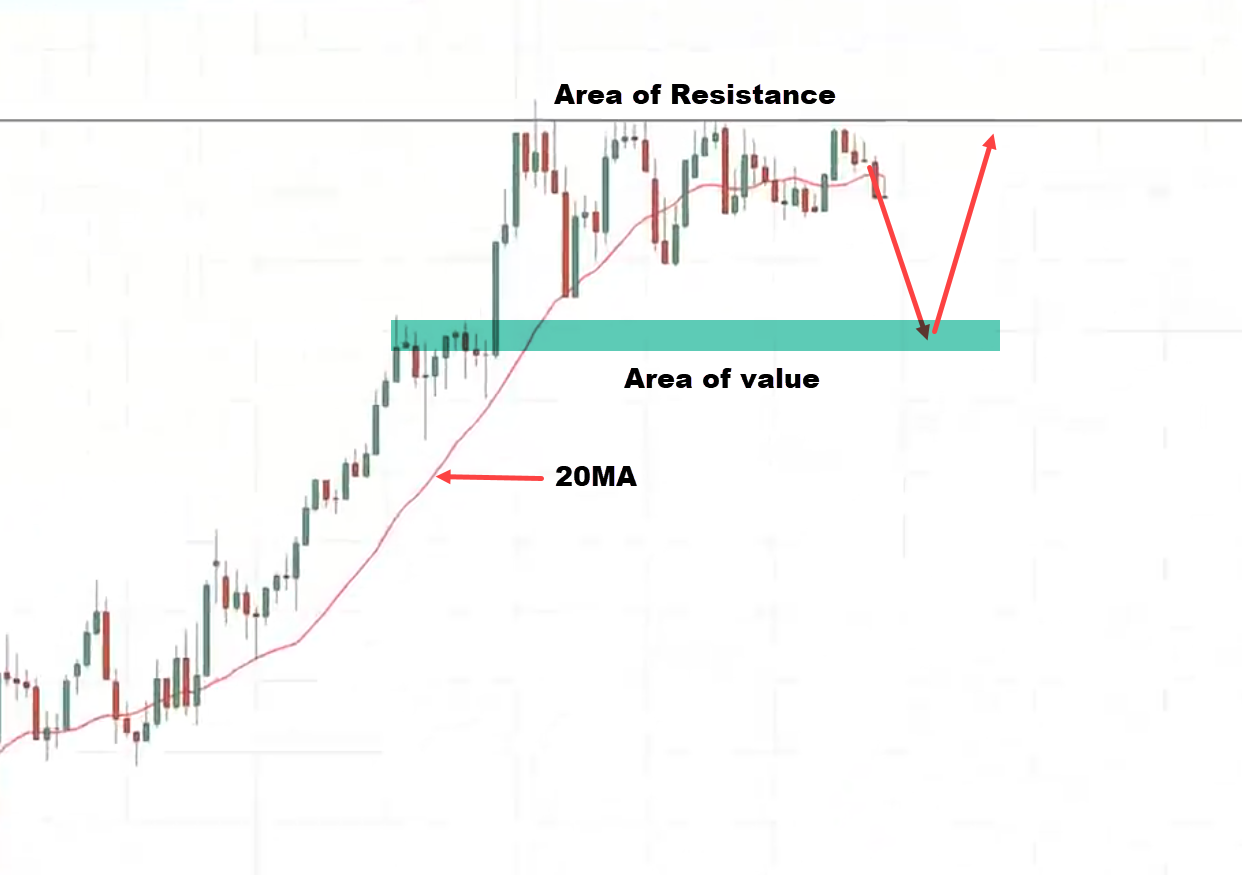
Allowing you to capture a swing into resistance.
With proper risk management, it’s possible to exit a portion of your trade at these highs and then let the remaining half go higher.
Conclusion
While learning how to draw support & resistance is crucial…
Knowing when it would break and bounce is of same importance as well which I have shared with you in this guide!
Nonetheless, here’s what you’ve learned today:
- Seeing “power moves” have a high tendency to bounce off your support levels
- Having a descending triangle (or a crawler move) occur into an area of support is a sign that sellers are gradually breaking the area of support
- Using the MAEE formula is the most effective way to trade with support and resistance levels
- When managing trades, you can use tools such as the Fibonacci extension and the 20-period moving average
There you go!
An all-in-one support & resistance guide that teaches you how to spot, interpret, and trade!
But now I want to hear your thoughts…
Are there any other “tips” you can share with me when dealing with support & resistance?
Are you already using some of the strategies I’ve shared with you today?
Let me know in the comments below!


