Free eBook Download!Get A Simple 5-Step Momentum Trading Strategy
In this article, we will teach you one of the best price action trading strategies. It is simple to learn and not confusing, mainly because it does not require any indicators on your chart.
This is forex price action trading at its core. You will also benefit from this strategy by learning a price action trading method, the best price action tutorial, daily price action, price action trading setups, price action day trading, and more.
Before diving into this price action trading strategy, I am going to explain the core elements of price action. This can fully equip you to execute the strategy I am teaching. Also, read about the Forex Mentors and the best investment you can make.
What Is Price Action?
Price action is simply how the price will react at certain levels of resistance or support. This technical analysis approach will help you learn things from the price history to identifying the swing high/swing low, trend lines, and past support or resistance areas.
Now, this could be the price testing a support or resistance area. It could even be when the price movement creates a swing high or swing low.
Price action requires no lagging indicators or moving averages to distract you from the price. The chart will have a clean look to it. It’s refreshing to see a clean chart with no indicators. In fact, some traders make a living trading without ever looking at an indicator.
Moreover, price action trading stands out from other strategies by its unique focus on raw price movements, eschewing reliance on lagging indicators. This approach offers traders the agility to make swift decisions based on the immediate market context, reducing reliance on predictive models that often lag real-time events.
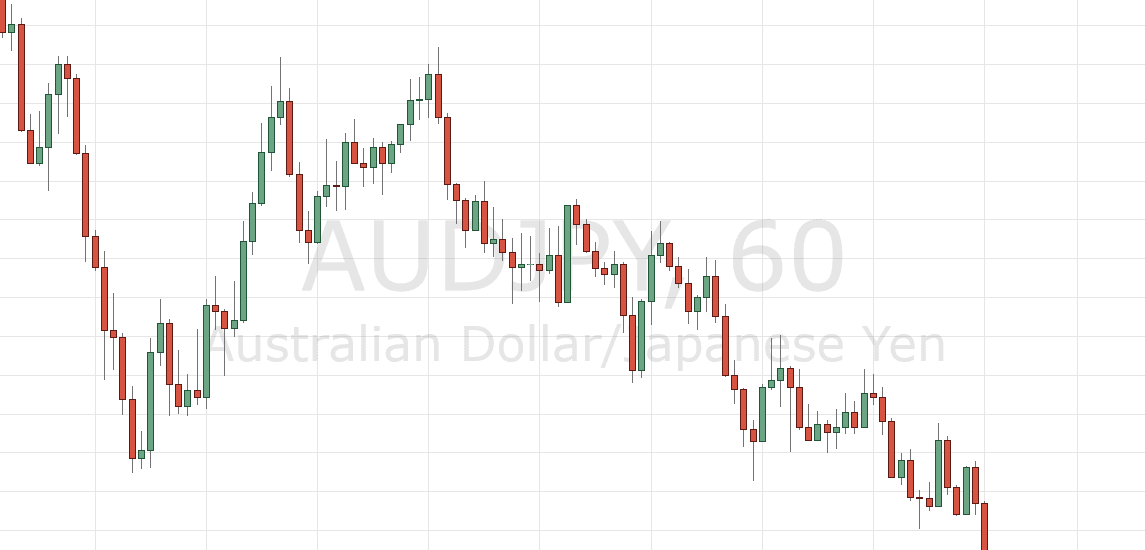
Unlike typical indicator-based strategies, price action provides real-time insight into the market sentiment and directional bias. Notable patterns in price action trading include flags, pennants, and double tops/bottoms. These formations offer valuable clues about potential market moves.
For instance, a flag pattern, characterized by a small rectangle following a steep trend, often signals trend continuation. On the other hand, a double top, marked by two consecutive peaks, can indicate an impending bearish reversal.
Next…
Discover the most powerful price action trading secrets that no one tells you.
See below:
What Are the Best Price Action Trading Secrets?

The top five price action trading secrets that will take your trading from consistently losing money to becoming the king of price action trading are:
- The location is more important than the price action itself. In other words, the “where” is more vital than the “what.” Even the worst possible price action at the right location can lead to a profitable signal.
- Price action will always follow the path of least resistance, aka the trend.
- Price action follows three phases: accumulation, markup, and distribution.
- Price action moves from small price ranges to big price ranges.
- The size of the price action is more important than you think.
Price action is the footprint left behind by institutional money, aka the smart money. More important than understanding price action is grasping the action behind the curtain, aka the supply and demand forces that affect the price action.
Last but not least, if you want to improve your price action reading skills, you can combine the price action with indicators. This will allow you to discount a lot of the false signals.
Moving forward…
You’ll learn some practical ways to master price action trading and become a better price action trader.
See below:
How to Master Price Action Trading
Mastering the art of trading with price action doesn’t need to be complicated. This is why we have put together a simple and effective way to analyze the price action.
Without further ado, these are the four trading steps to analyze the price action in any market.
See below:
Step #1: Start by Analyzing the Swing Highs and Swing Lows
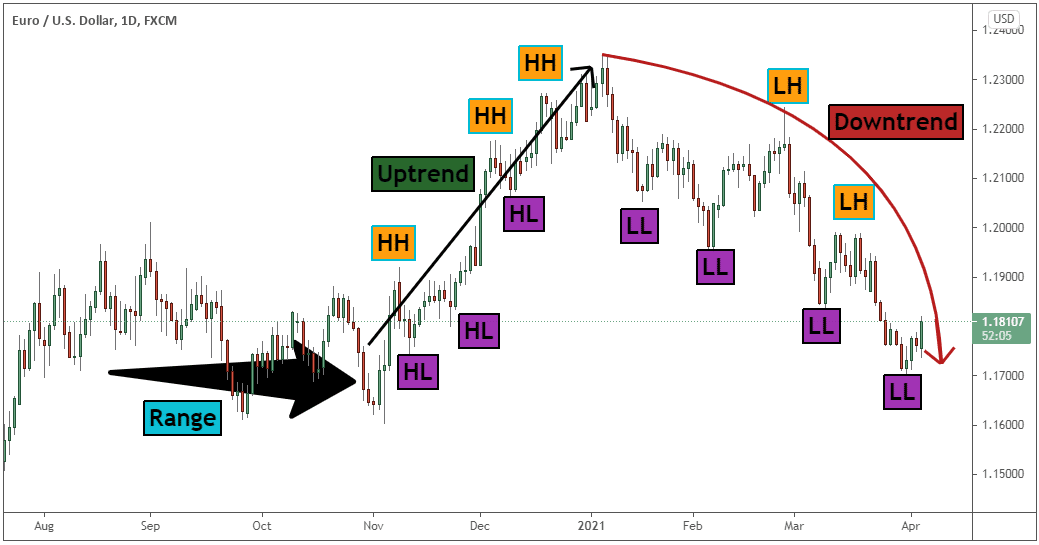
Whenever you open a chart, start by studying the relationship between the swing highs and swing lows.
If the market is in an uptrend, the price action will post a series of higher highs and higher lows.
On the other hand, if the price action posts a series of lower lows and lower highs, we’re in a downtrend.
However, if there is no clear direction or you’re unable to spot a clear trend, then we’re in a ranging market.
Step #2: Measure the Distance Between the Swing Highs and Swing Lows
Step two is to measure the distance between these swing points.
What we’re concerned with is whether the distance between these swing points is increasing during the development of a trend.
If the wave distance is increasing, it suggests a strong momentum.
On the other hand, if the wave distance is shrinking, we know that the momentum is fading.
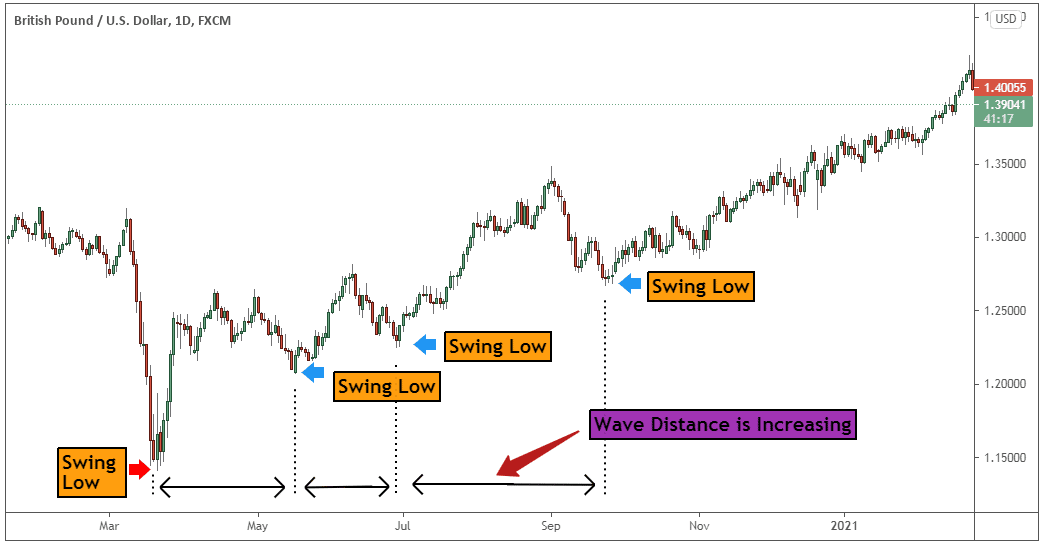
By combining wave analysis with price action, you can make much more sense of what is going on in the market.
Step #3: Real Support and Resistance Occur with Big Candle Wicks
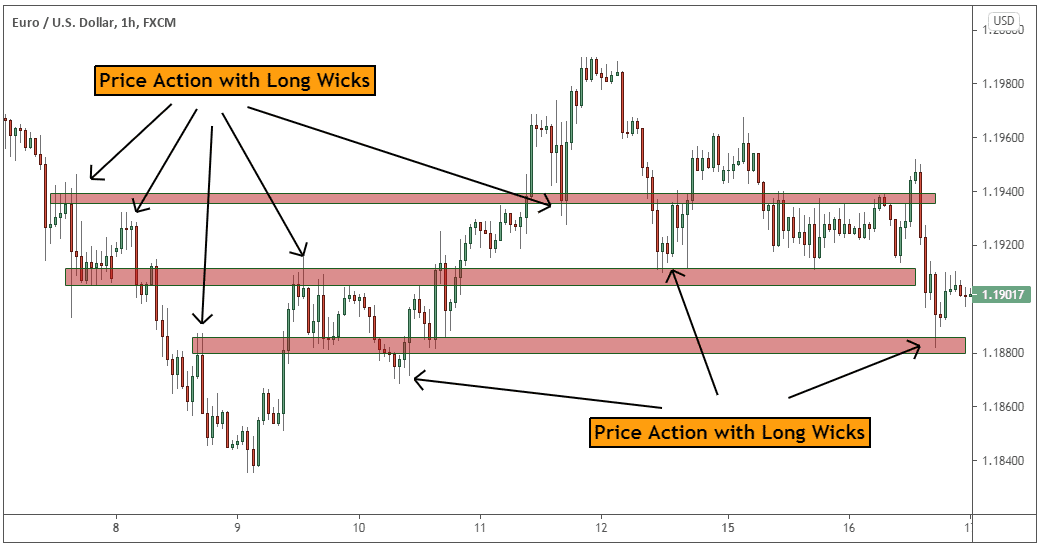
Another trading principle to follow is that real support and resistance usually develop where we have price action with long wicks.
By observing the long wicks, we can find price levels that line up to form powerful support and resistance levels.
The long wicks usually show strong rejections of prices.
As a general rule, we want to draw our support and resistance levels near price action with long wicks, as seen in the figure below.
Step #4: Combine Price Action with Indicators
An example of combining price action with indicators is to combine pin bars, engulfing bars, inside bars, etc., with technical indicators such as moving averages, stochastic, RSI, and more.
Forex technical indicators are great to filter out some of the bad signals.
Check out what are the best technical indicators to generate buy and sell signals.
Moving forward…
Let’s see what the must-read books on price action trading are.
See below:
Which Are the Top 10 Price Action Trading Strategy Books?

The top 10 price action trading books every forex trader must read are:
- Trading Price Action Series by Al Brooks – Al Brooks price action book is considered to be the bible of price action
- Beat the Forex Dealer: An Insider’s Look into Trading Today’s Foreign Exchange Market by Agustin Silvani – reveals dirty tricks that happen behind the curtain
- Pring on Price Patterns: The Definitive Guide to Price Pattern Analysis and Interpretation by Martin J. Pring – a best-selling book on price action
- Trader Vic: Methods of a Wall Street Master by Victor Sperandeo – a price action trading book written by a successful trader
- Getting Started In Chart Patterns by Thomas Bulkowski – this book is considered to be the encyclopedia of chart patterns
- Street Smarts by Larry Connors and Linda Raschke – this book reveals +20 unique price action trading strategies
- Japanese Candlestick Charting Techniques by Steve Nison – the beginners’ guide into price action
- The Education of a Speculator by Victor Niederhoffer – teachings from a hedge fund manager
- Day Trading With Short Term Price Patterns and Opening Range Breakout by Toby Crabel – contains old trading techniques that have stood the test of time
- Short Term Trading Strategies That Work by Larry Connors – comes with invaluable trading secrets
Please let us know which price action trading book is your favorite and why.
Next…
You’ll learn one of the simplest trading strategies in the world.
See below:
Pin Bar Price Action Trading Strategy
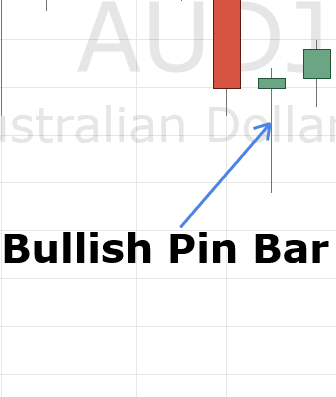
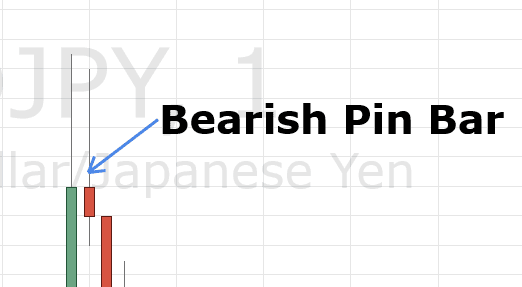
This price action strategy will focus entirely on a price pattern called pin bars. This candle is simply the price hitting a certain level and being “rejected” from it. This bar has a long tail on it with a small body. A pin bar can look like this:
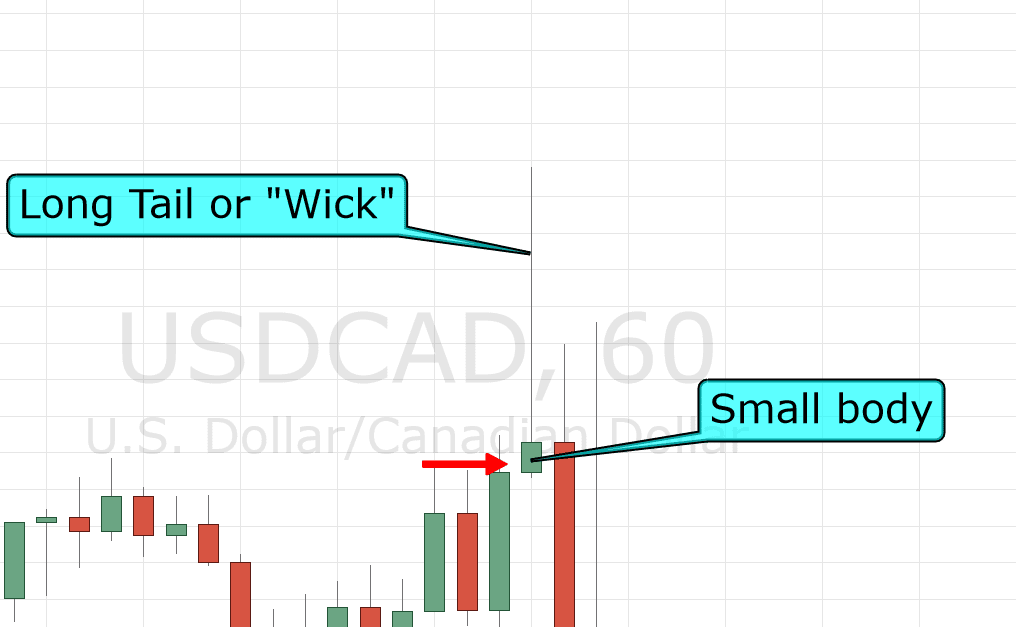
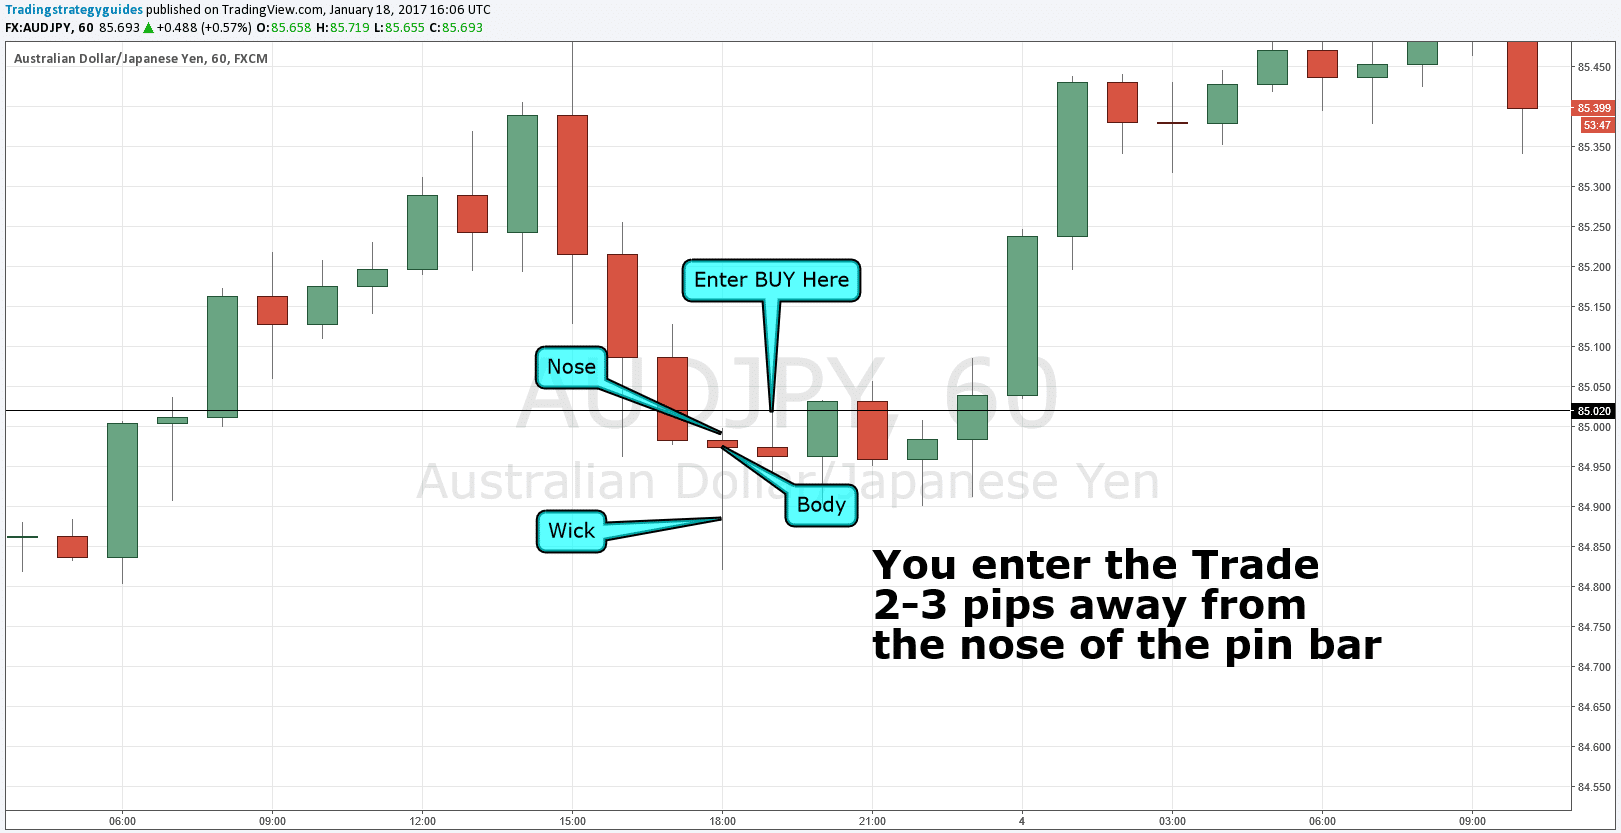
There are different types of characteristics for a particular pin bar. For instance, the long end of the candle is the wick, while the small end (the opposite side of the body) is called the nose.
Most agree the long tail, or “wick,” will be at least two-thirds the total length of the pin bar itself. The other part of the pin bar will naturally be, at the most, one-third of the candle. Moreover, the open price of the candle and the close should be relatively the same price. This forms the ‘Body.’
To confirm a pin bar, you must wait for the candle to close. Just because the current candle “looks” like a pin bar does not necessarily mean it is. In the example above, the price movement could have continued upward and closed at the top of the candle. In turn, it would not be considered a pin bar. Learn more about Candlestick Trading here.
Basic Guidelines:
- Timeframe – ANY
- Market – ANY
- Indicators – NONE
- OTHER – Trend lines, horizontal lines, support resistance lines (anything to help you find these areas).
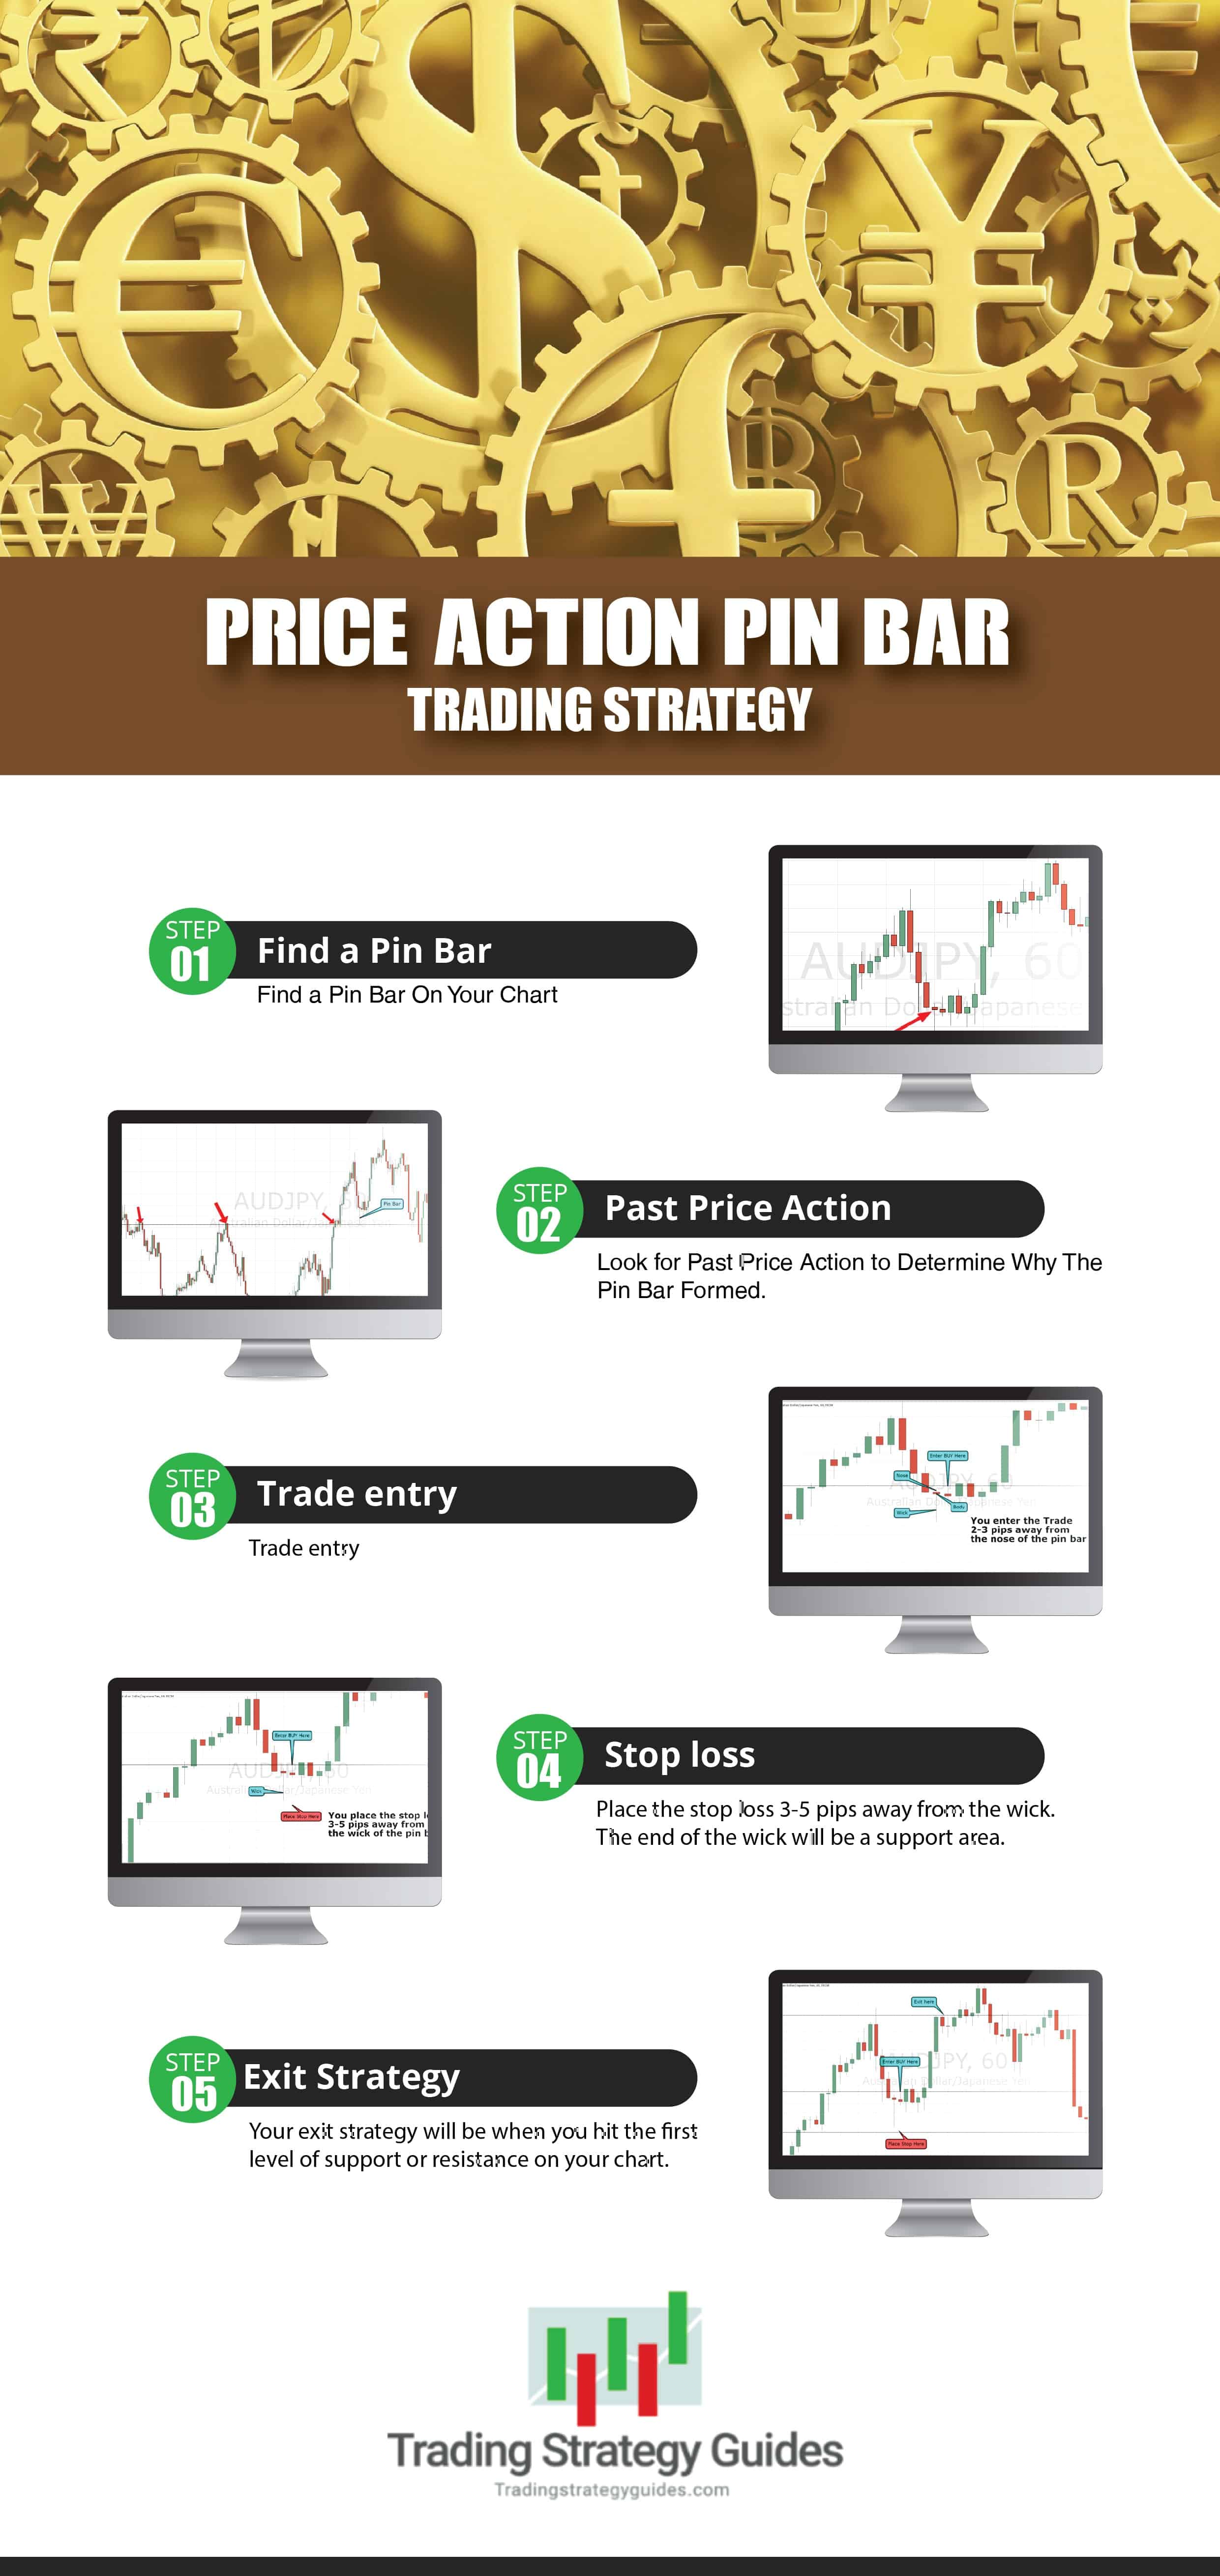
Step 1: Find a Pin Bar on Your Chart.
*Note: This is a stock price action strategy and a forex price action strategy. I will use a currency pair as an example. Price action charts are with any market and timeframe.
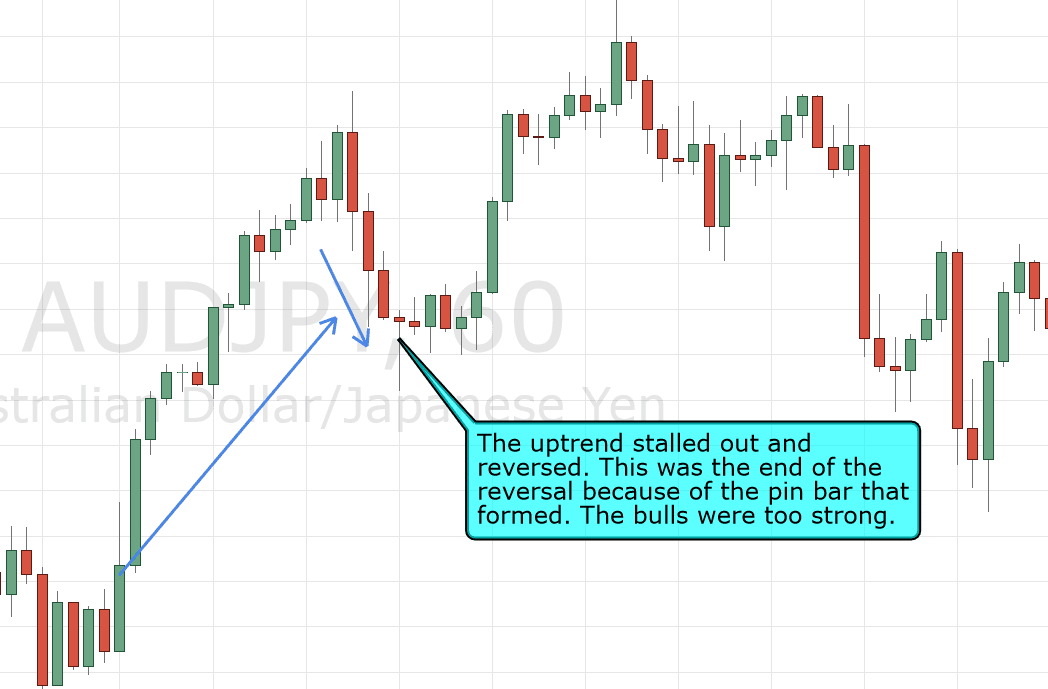
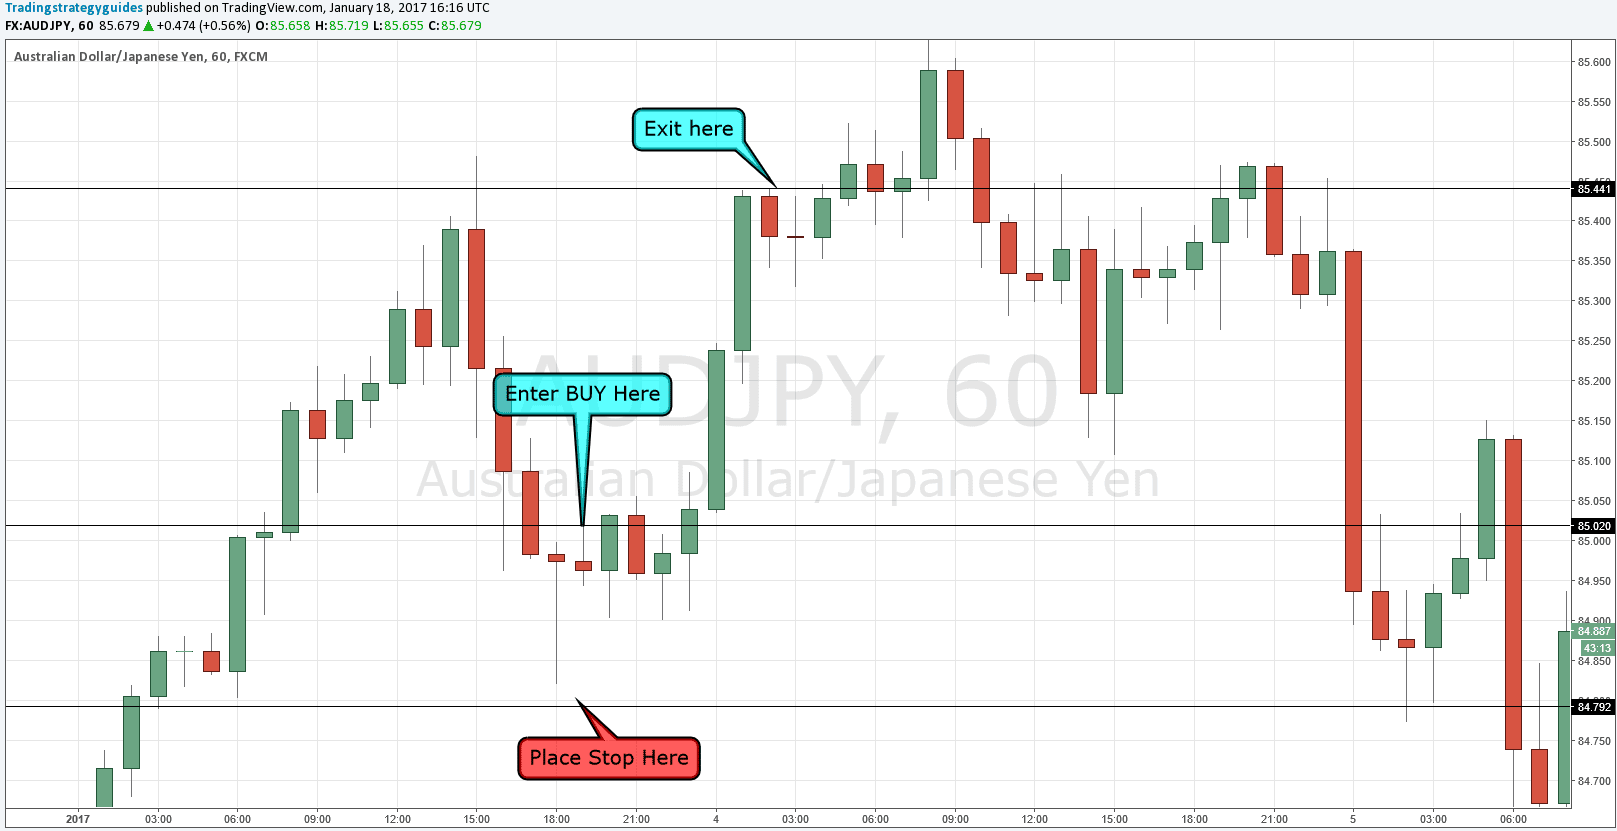
First, identify a pin bar that has formed. In the example, this is considered a bullish pin bar because of the long wick below the body.
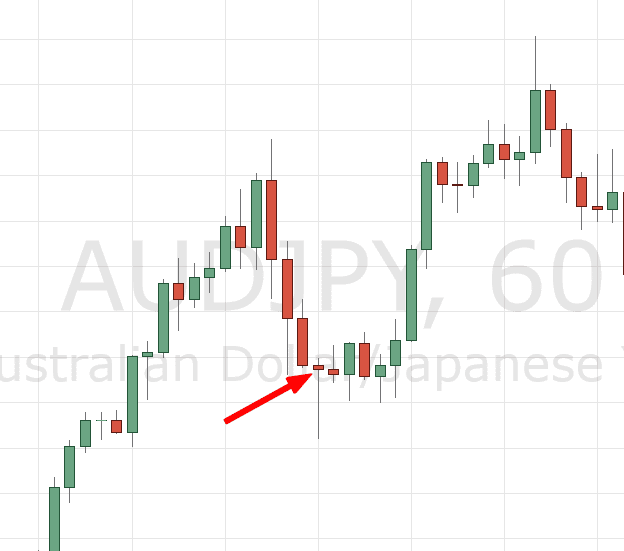
As you can see, the pin bar “wick” is below the body, which is considered a bullish pin bar.
In this case, we are looking for a continuation of this uptrend. This is a one-hour time chart of the AUDJPY currency pair.
You can see the Bears tried their hardest to stop this uptrend from occurring. The Bulls were too strong, which is why you see the pin bar form.
This is a perfect example of a pin bar price action reversal setup.
So what happened?
It’s crucial to interpret pin bars within the context of the market environment. In an uptrend, a bullish pin bar can be a continuation signal. On the other hand, a downtrend might indicate a potential reversal.
Similarly, in a ranging market, pin bars can signal impending breakouts, as traders test and reject key price levels.
Step 2: Look for past Price Action to Determine Why the Pin Bar Formed.
Why did the reversal suddenly hit a price and then continue back to the upside?
Let’s zoom out a bit on this one-hour chart. We’ll figure out if we can see anything that explains what happened.
Note: You can either look at the current time frame you are on, in this case, a 1-hour time period. However, you can also bump up one or two periods to gather information.
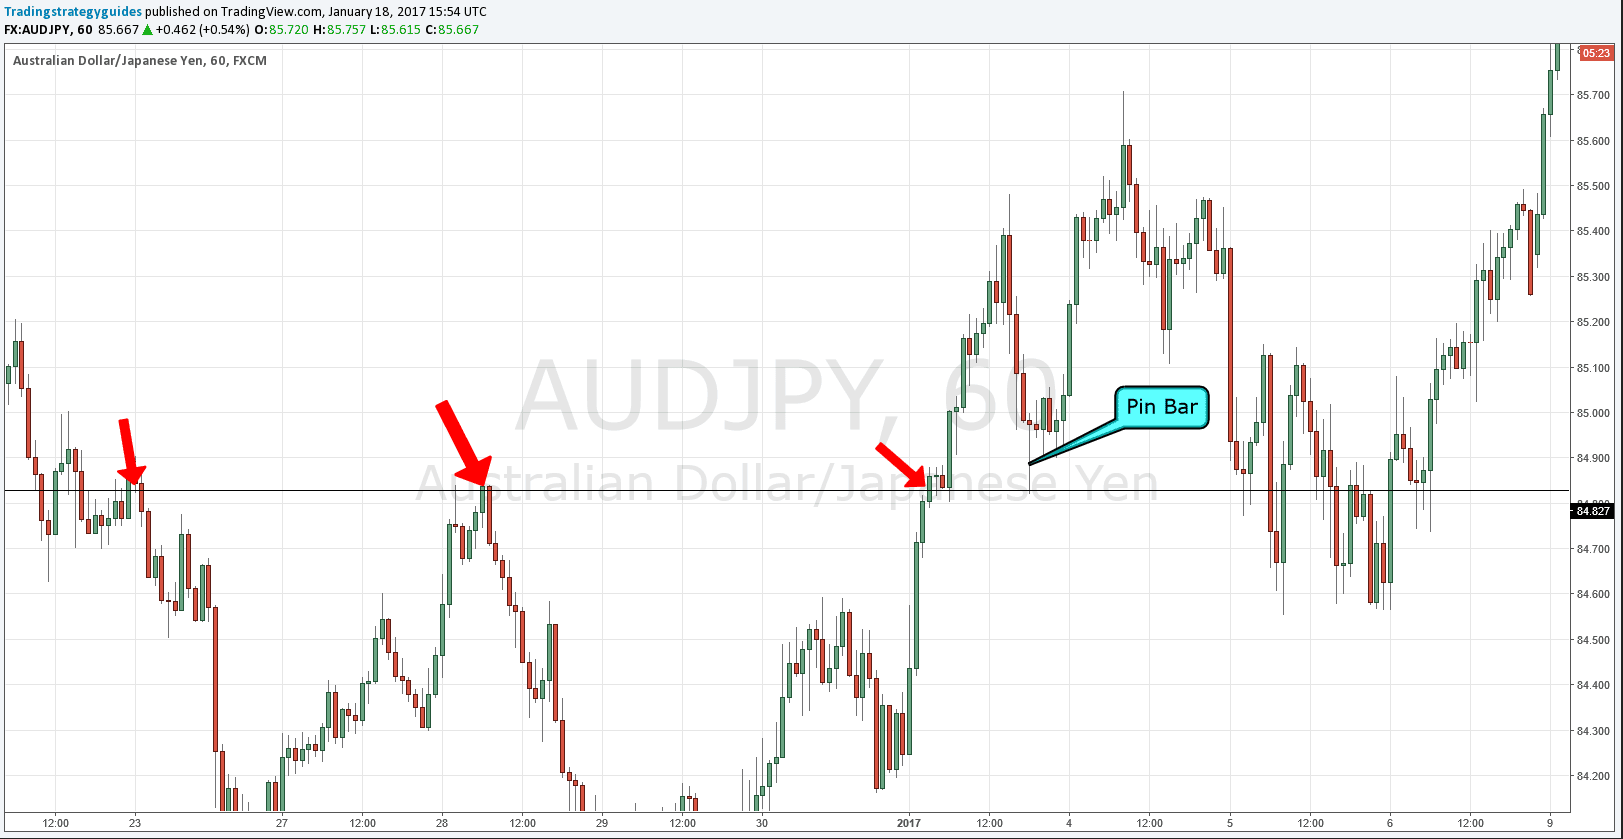
Aha! So take a look at those resistance price areas the wick touched.
Resistance in the past can mean support in the future. What happened is the price hit this level but failed to break through it.
Since the long bullish wick formed, we decided it was time to enter this trade based on what we learned from the prior days.
This is what Price Action is all about. No two trades are the same. However, we can take what we’ve learned from the past. Then, make the best judgment as to where the price is going in the future.
You are essentially like a detective when you trade price action. The goal is to gather many pieces of evidence to back up your conclusion. You are trading with confluence, and sometimes simple is best. Study the charts and form an educated conclusion as to where the price will go.
Step 3: Trade Entry
You just enter the trade 2-3 pips from the break of the nose of the pin bar.
Step 4: Stop Loss
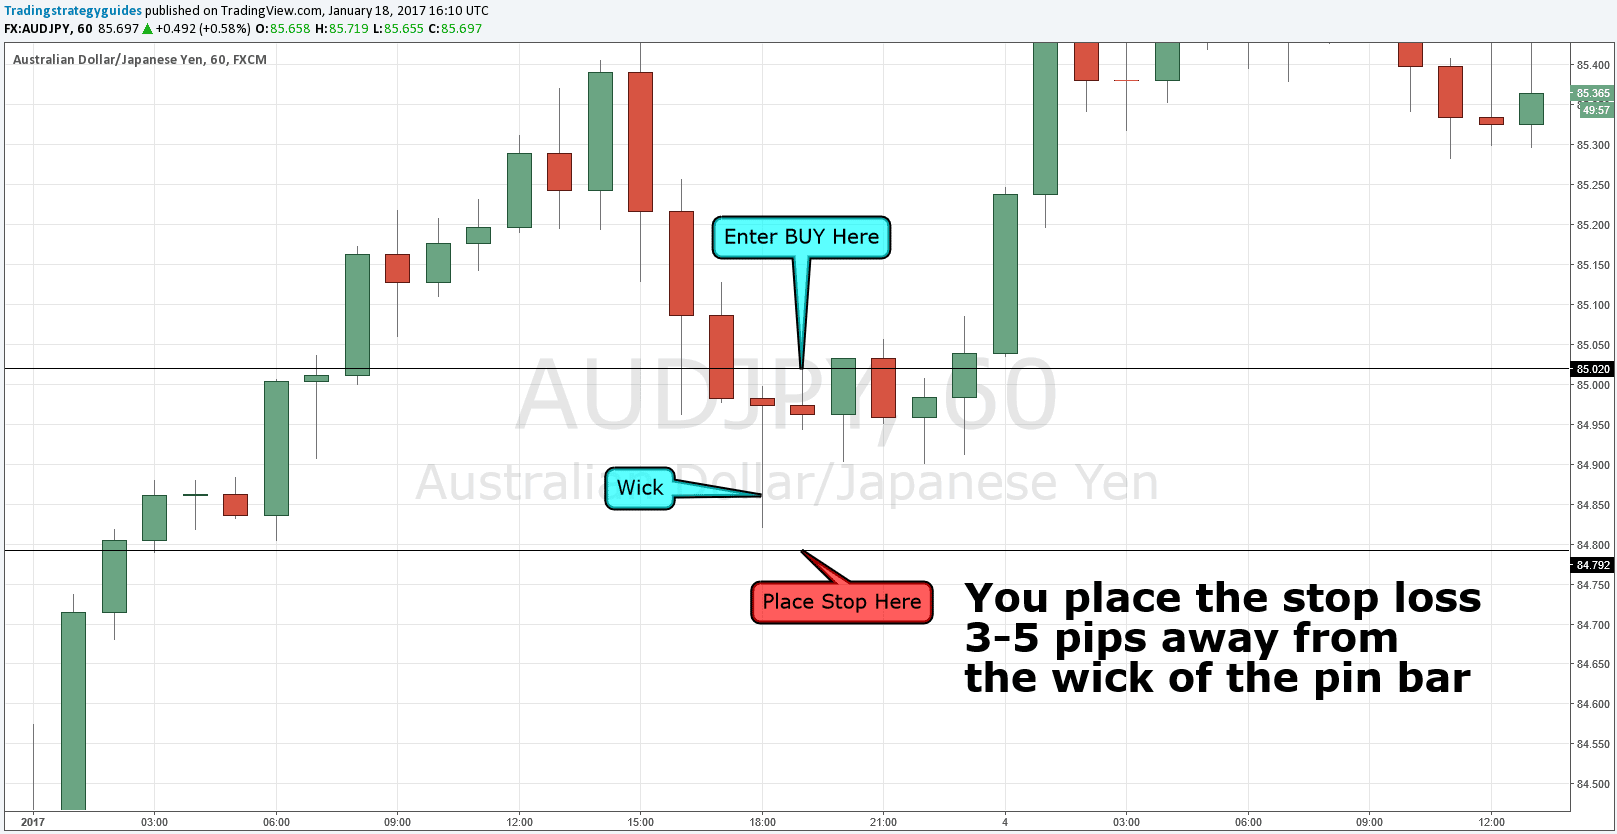
Place the stop loss 3-5 pips away from the wick. The end of the wick will be a support area. So, if this is broken, the trend may continue downward. This is why you place your stop 3-5 pips away from this.
Step 5: Exit Strategy
Your exit strategy is when you hit the first level of support or resistance on your chart. As you can see, the price hit a point and then stalled out. Once we see the price action stalling out, we exit the trade immediately.
Price action is another fundamental element to learn when trading the market. There are thousands of strategies you can use with price action. It is important to find something that works for you.
These pin bars are hard to miss. They are relatively accurate when you learn why a pin bar formed. Pin bar candles are shown in any time frame. The rule of thumb is that the higher the time frame, the stronger the signals. However, that does not mean that this will not work in a five-minute time frame.
Do not trade every pin bar you see that forms. Gather up key information from the charts. Then, form the best conclusion to determine if you should enter the trade based on the rules.
If you would like to read a strategy that uses indicators check out our Fibonacci trendline trading strategy. This strategy focuses on the retracement of a trend.
Try the price action trading strategy out on a demo account first and see if it works for you! If you find something that you think can improve it, let us know! We love hearing from you guys. Also, please give this strategy a 5 star if you enjoyed it!
Thanks for Reading, and Stay Tuned for More Great Trading Strategies!
-Trading Strategy Guides
Like this Strategy? Grab the Free PDF Strategy Report that includes other helpful information like more details, more chart images, and many other examples of this strategy in action!

Please Share this Trading Strategy Below and keep it for your own personal use! Thanks, Traders!
Free eBook Download!Get A Simple 5-Step Momentum Trading Strategy


