Video Transcription
First and foremost.
This is an example of a market in an uptrend:
If you know a market is in an uptrend, you only want to identify an area of support on the chart.
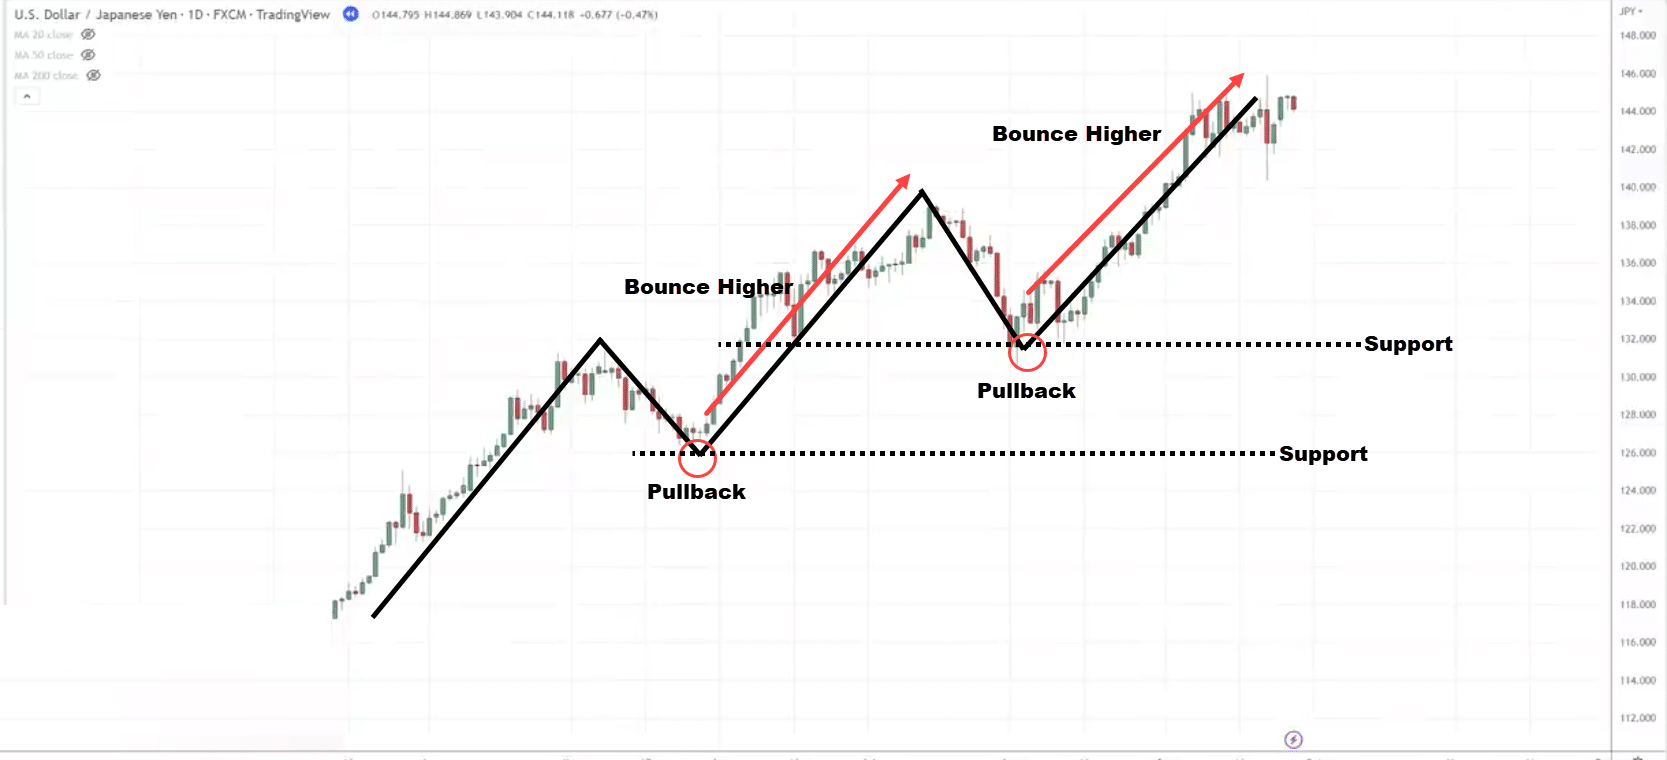
The way I do it is to identify the areas on a chart where the market bounces off higher.
What I will do is I will draw an area of support.
Here is what I mean:
How do I fine-tune my level?
The way I like to do it is that I like my area of support to get as many touches as possible.
I would just adjust my support and push it slightly higher.
This way, I got multiple touches.
Again, another tip I would like to share with you is that support and resistance are an area on your chart, I like to draw them as lines on the chart.
That’s my habit.
But you can use the rectangle tool on TradingView to highlight the area on your chart. This is what I mean:
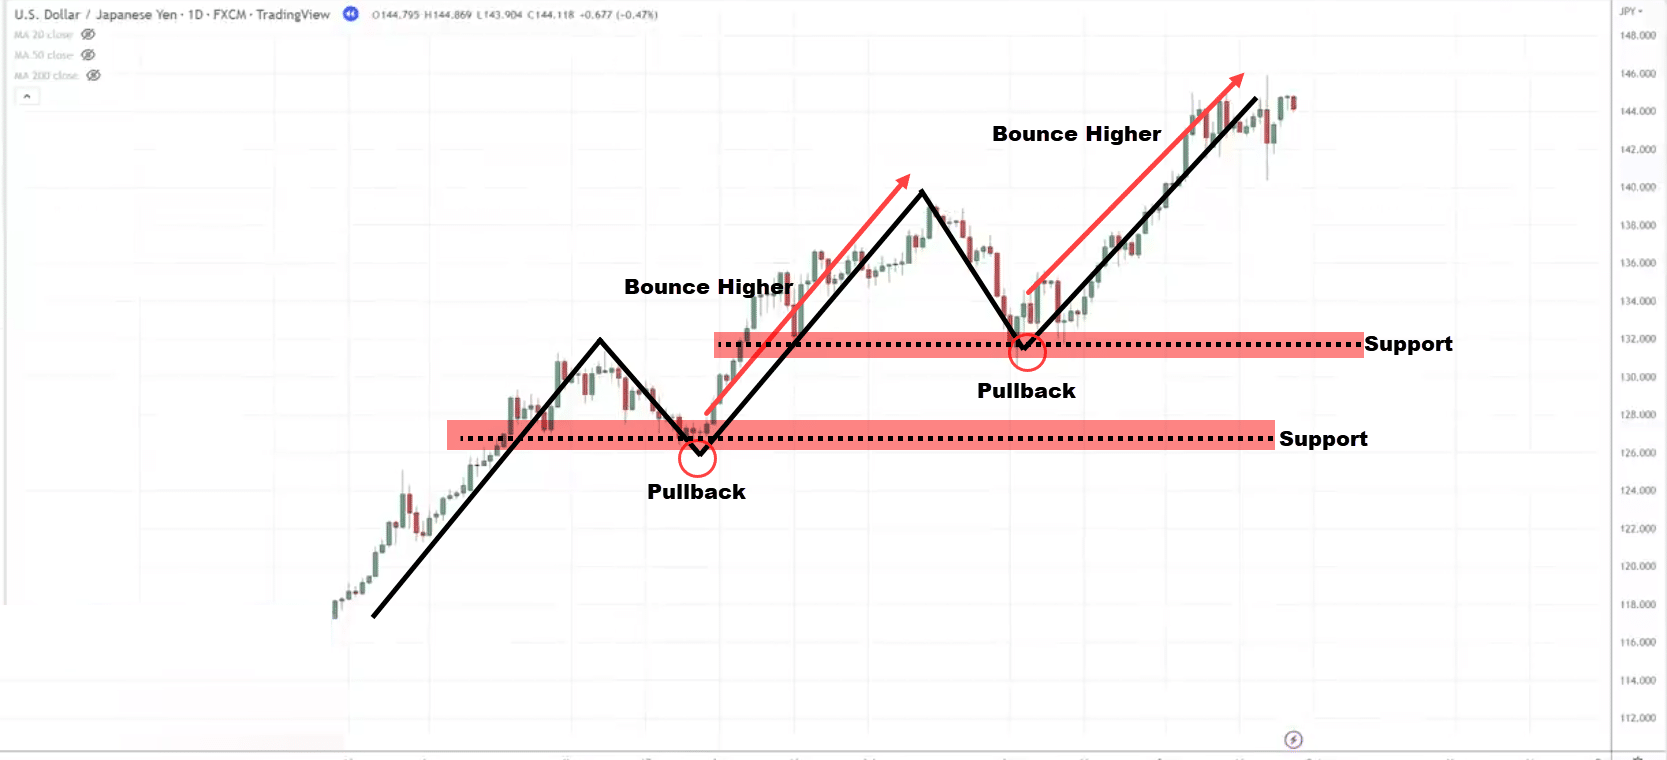
This reminds you that it’s not a line but rather an area on your chart.
Another thing to share with you is that when you draw support and resistance, I typically have not more than two areas on my chart.
Because if you have too many, you’re going to feel overwhelmed.
You might be thinking…
“Rayner, what about this one over here, this is another level you can draw”
That’s true, those are levels that you can draw.
But here’s the thing…
They will just clutter your chart with a lot of unnecessary information.
I usually just want to keep only the two most recent ones.
Why is that?
Let me explain…
Why don’t I have this particular level over here to leave it as support?
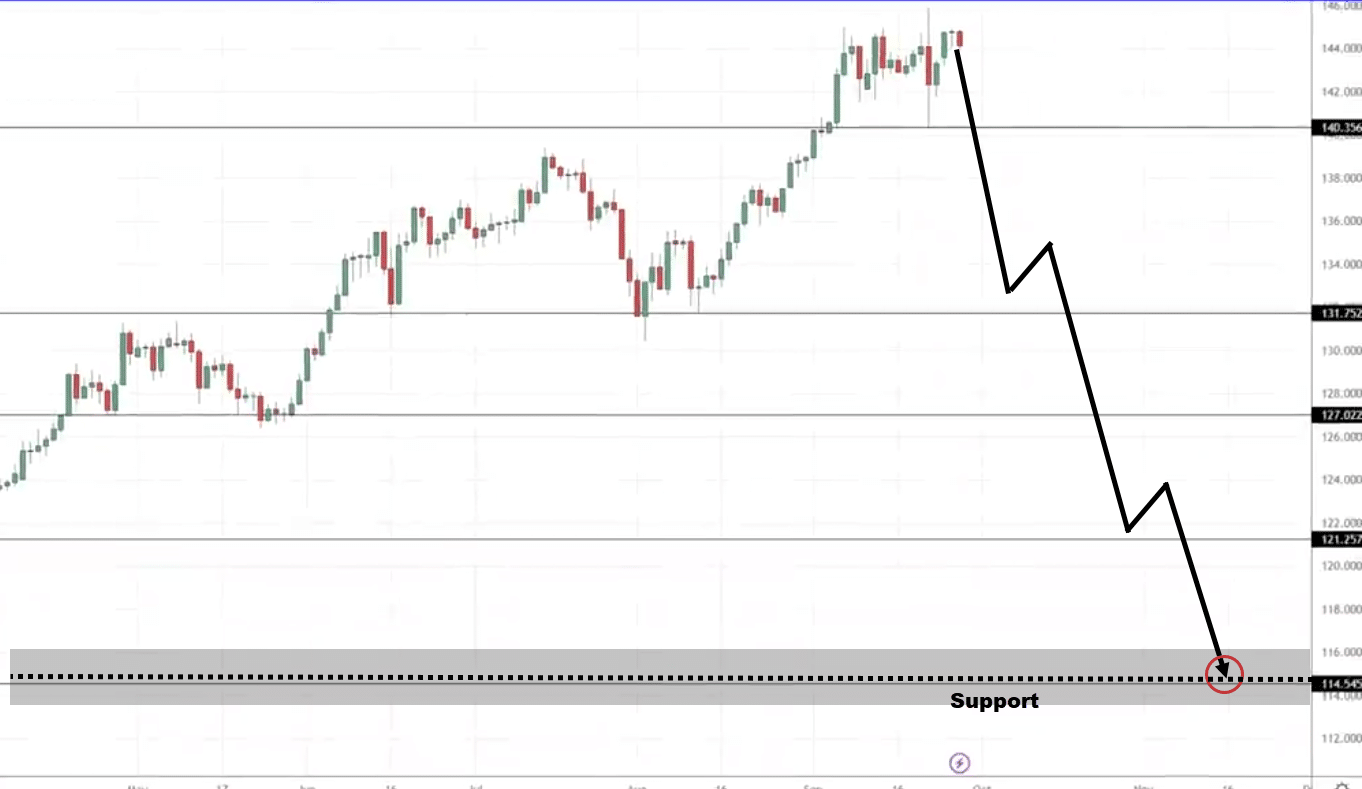
Think about this if the market comes down to this area of support over here, the market reverts down twice.
Do you want to be buying at this price point?
The answer is no even though it’s an area of support.
Why?
Because by then the market is no longer in an uptrend!
At that point, the market is likely to be in a downtrend.
If the market is in a downtrend, I want to sell it resistance, not buy at support.
This is why I just have no more than two areas of support on my chart.
Also, one more thing to add is that this level over here will be significant.
Why is this level significant?
Recall about uptrend invalidation. The uptrend would be invalidated when the price breaks and close below the swing low that precedes the breakout. This is what I mean:
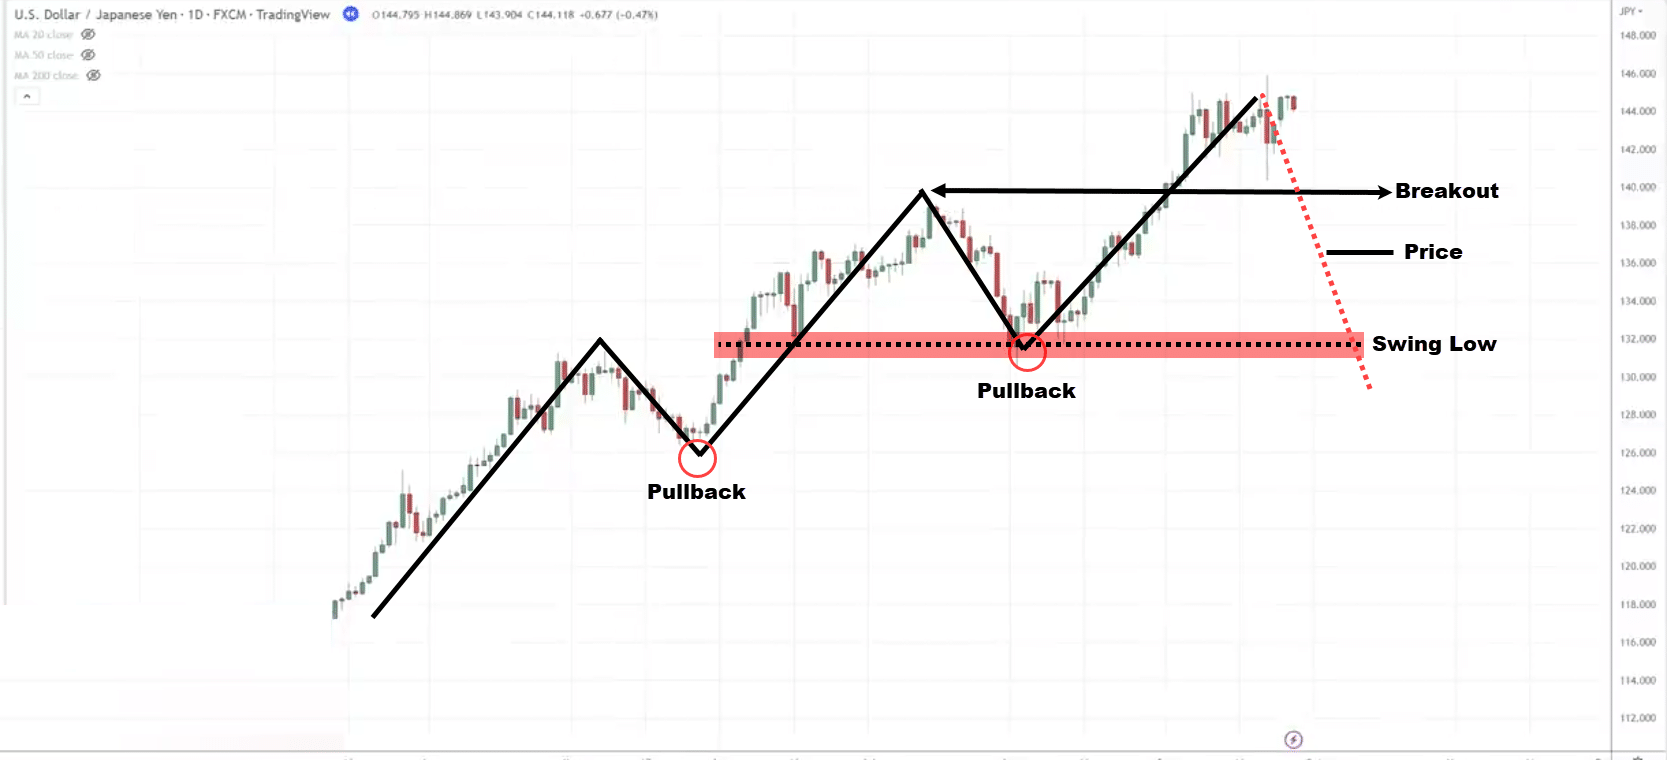
To me, it’s no longer in an uptrend it possibly could go into range or even a downtrend altogether.
This is what I call “The last line of defense”
Example:
Look at this chart over here:
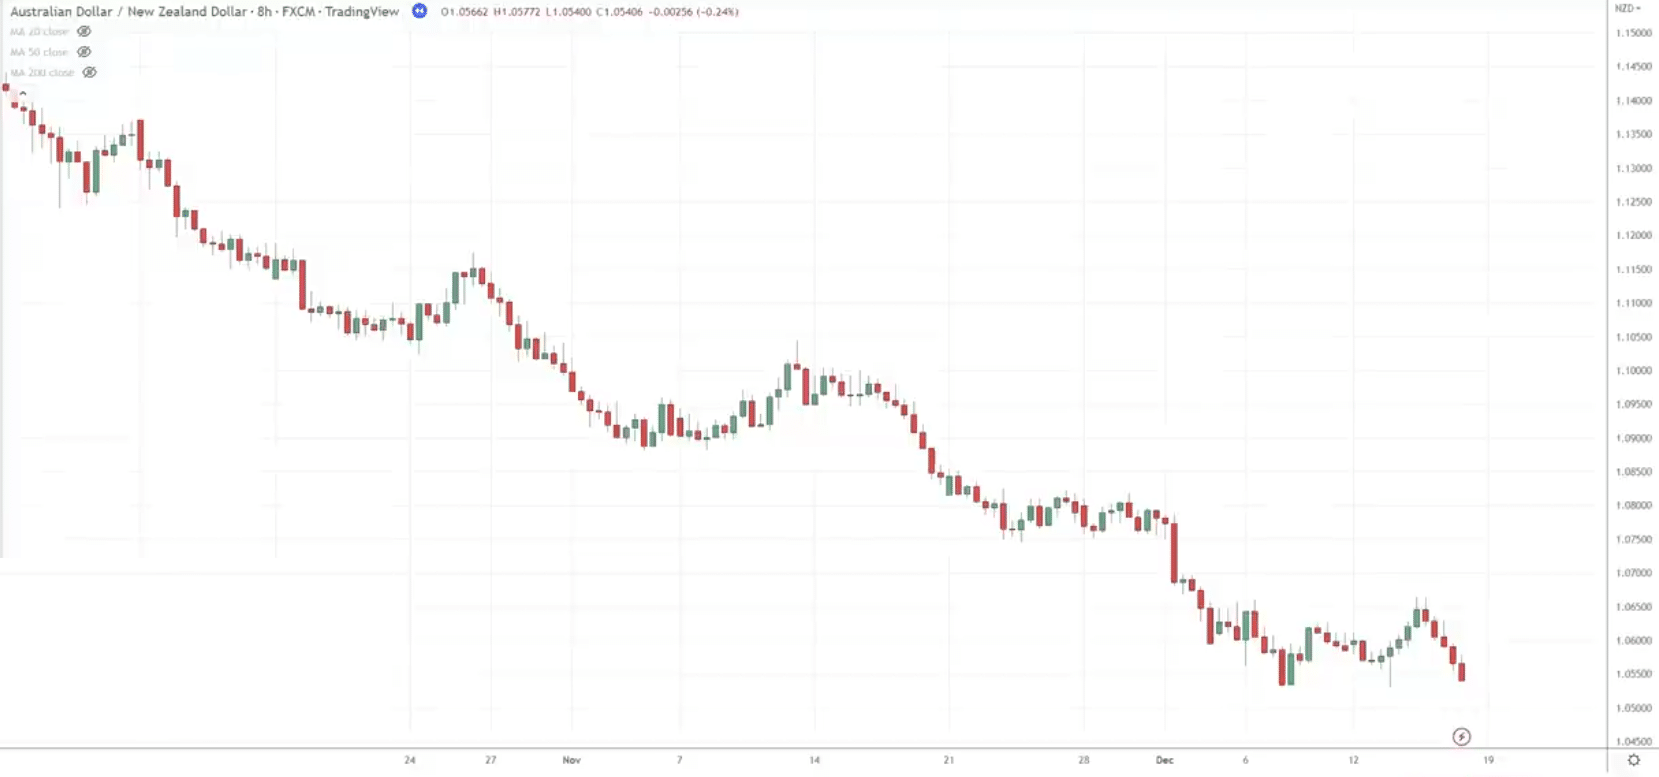
How will you draw resistance in this downtrend?
Where will you draw your area of resistance in this downtrend?
I want to say that there’s no right or wrong. It’s just my way of identifying resistance. If you have a method that works for you, that’s great.
But if you’re new, you have no idea where to start then you can try using my method first. Then tune what works for you.
For me, I like to pay attention to the two most recent highs where the market declined. Here is an example:
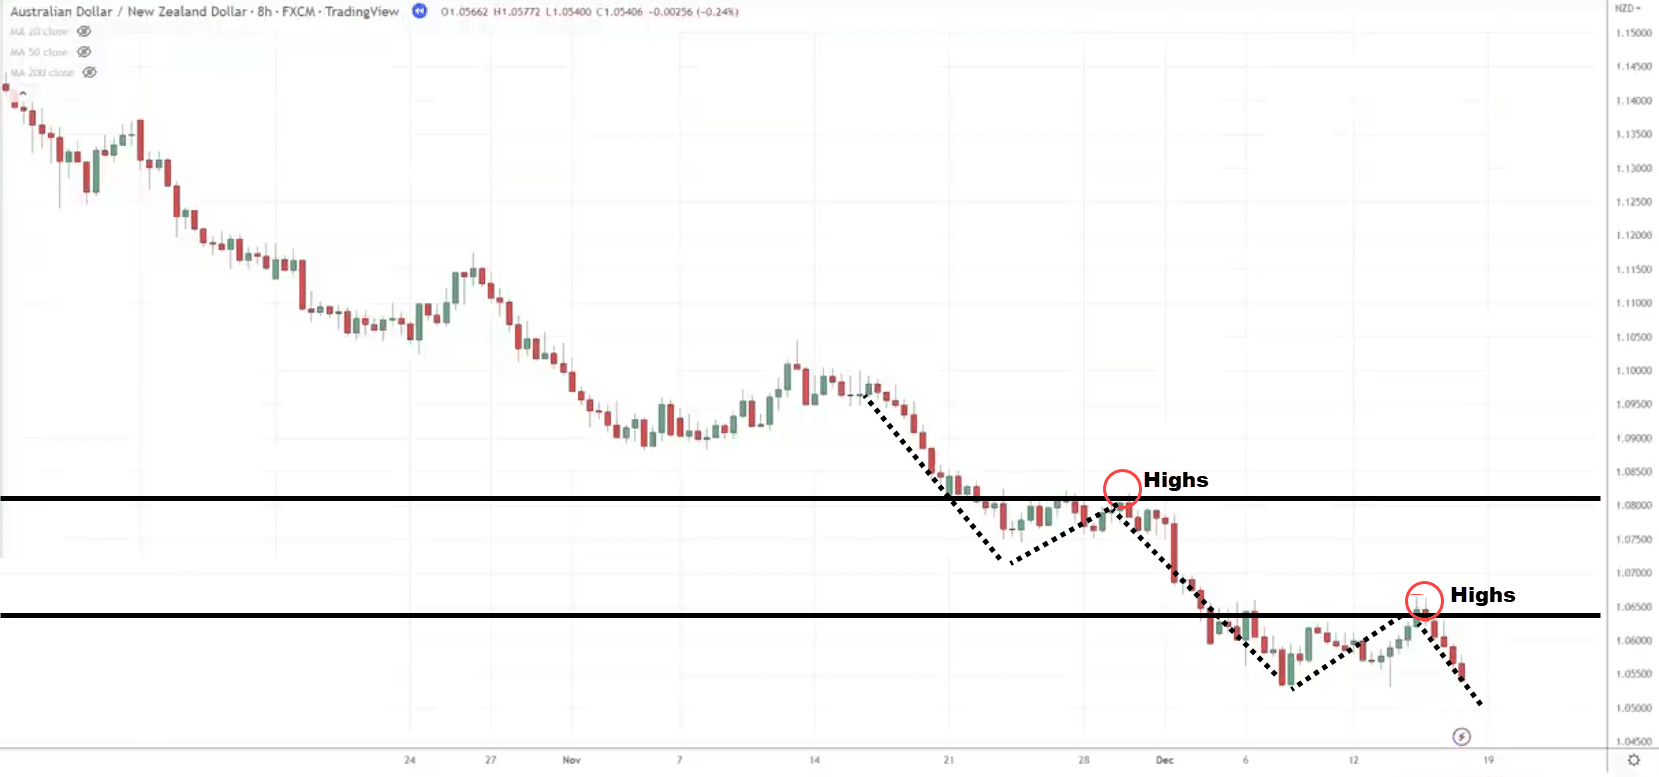
Why I don’t have so many resistance levels is very simple.
Imagine where the price is now, let’s say the market rallies up to this highs:
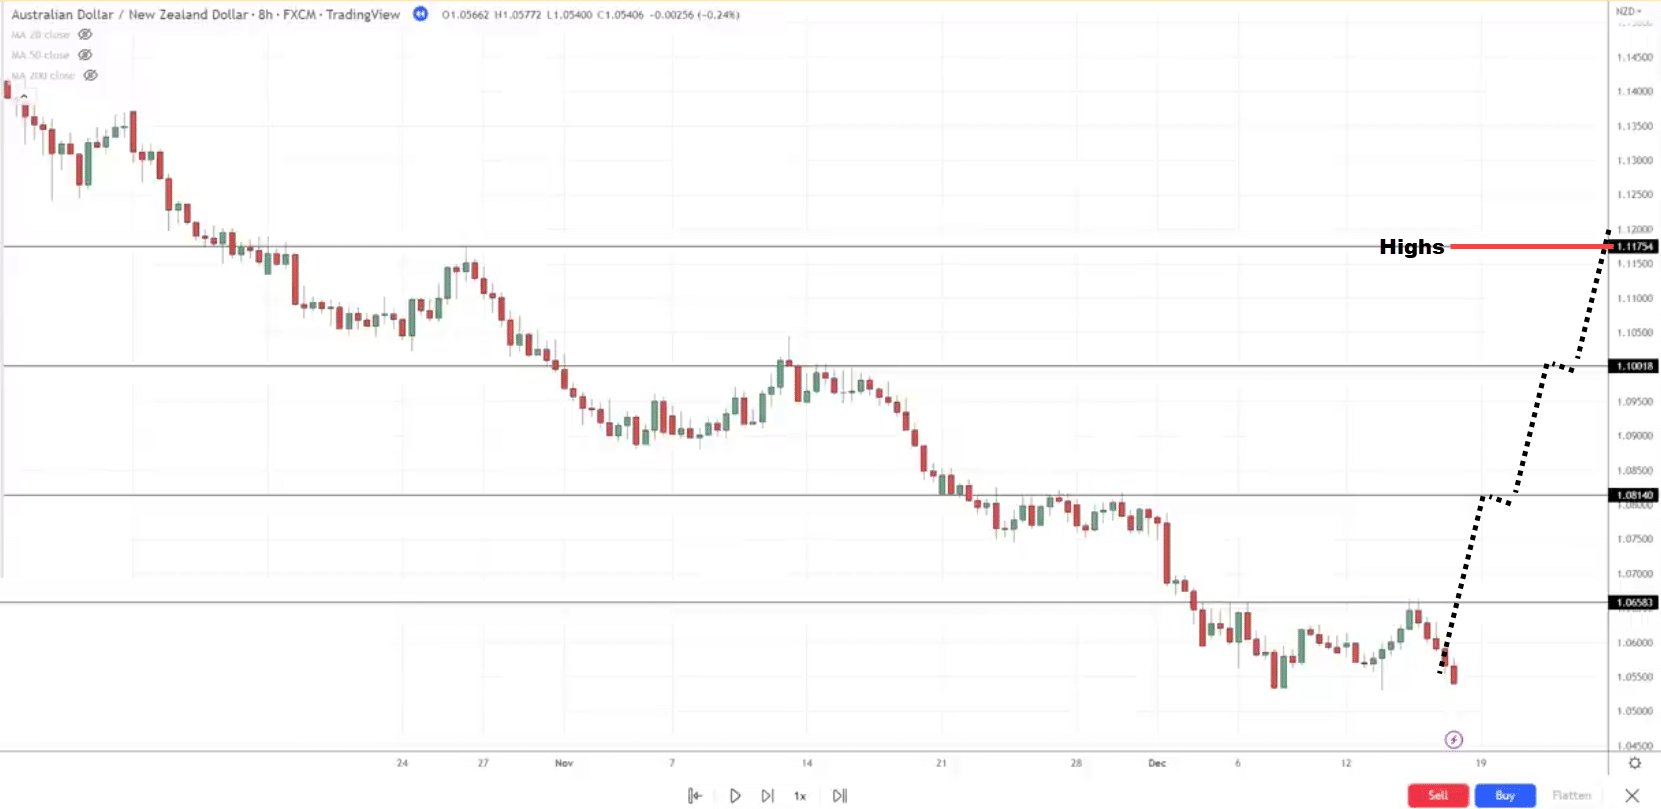
Do you still want to be selling at this price point?
Probably not.
Because this market is likely no longer in a downtrend, it’s probably in an uptrend.
As you have learned, in an uptrend you want to be looking to buy at support.
This is why I typically have just the two most recent resistances on my chart.
That’s pretty much it.
In this case, let’s say the market comes up to this area of resistance, this is where I look for selling opportunities to short this market:
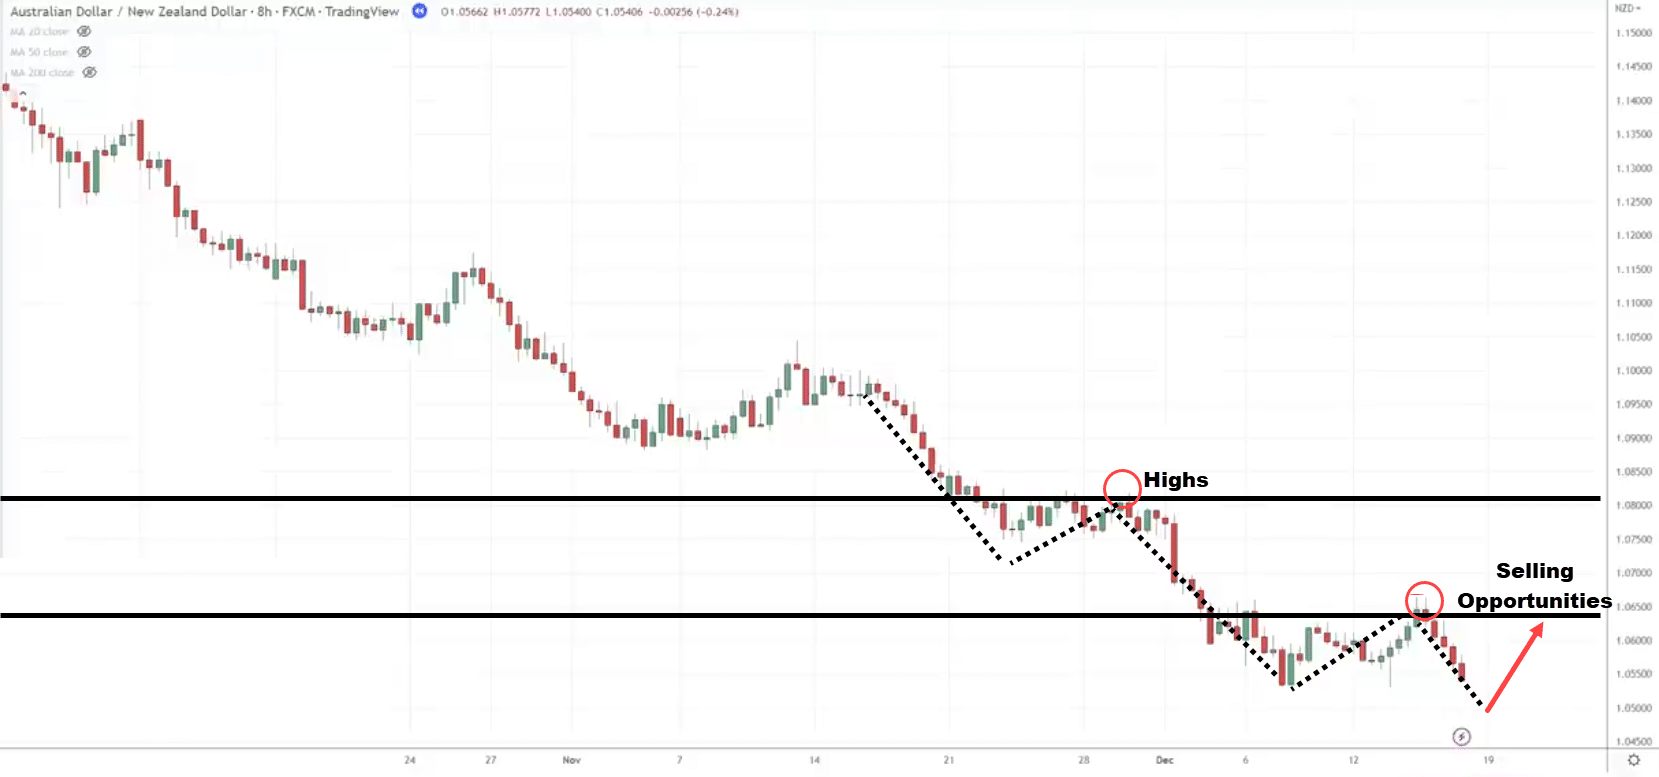
But of course, I don’t blindly sell when the market comes to this price level, there’s another thing to look out for which I’ll share with you.
How to Draw Support and Resistance in Range Market
The concept is similar, you want to identify the areas on the chart, where the market has a huge swing.
Example:
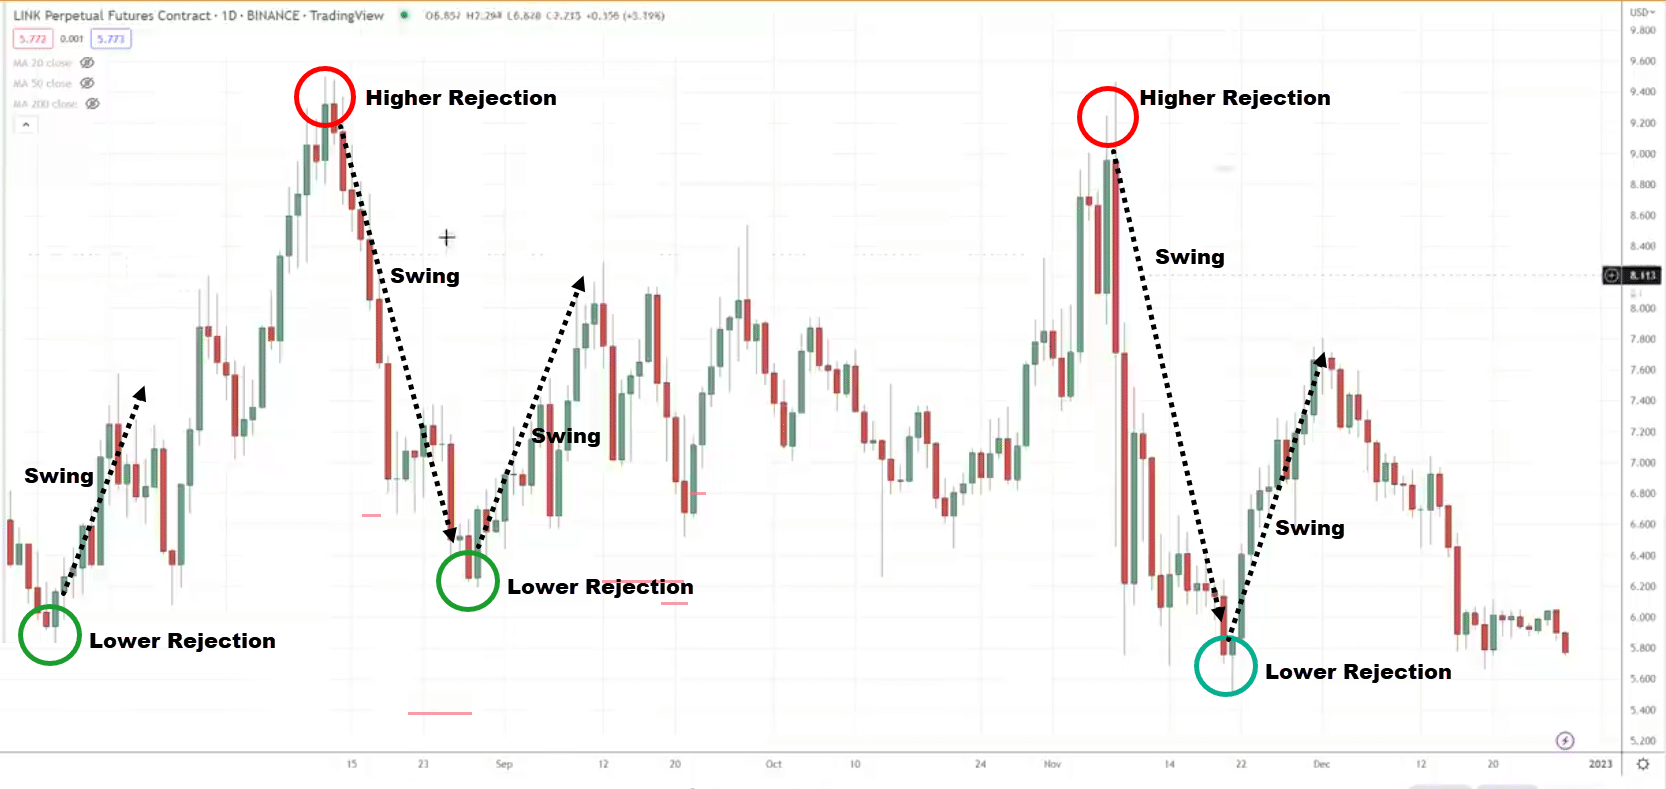
These are key areas because the market has a strong collapse from it.
Once you identify these key points where the market just kept getting rejected higher and lower, this is an area on the chart where you want to pay attention.
I recommend using the rectangle tool as previously discussed, so you can better identify your support and resistance.
You have learned how to draw support and resistance like a pro.
Trading Strategy That Allows You Profit in a Bull and Bear Market
Take a look at this chart:
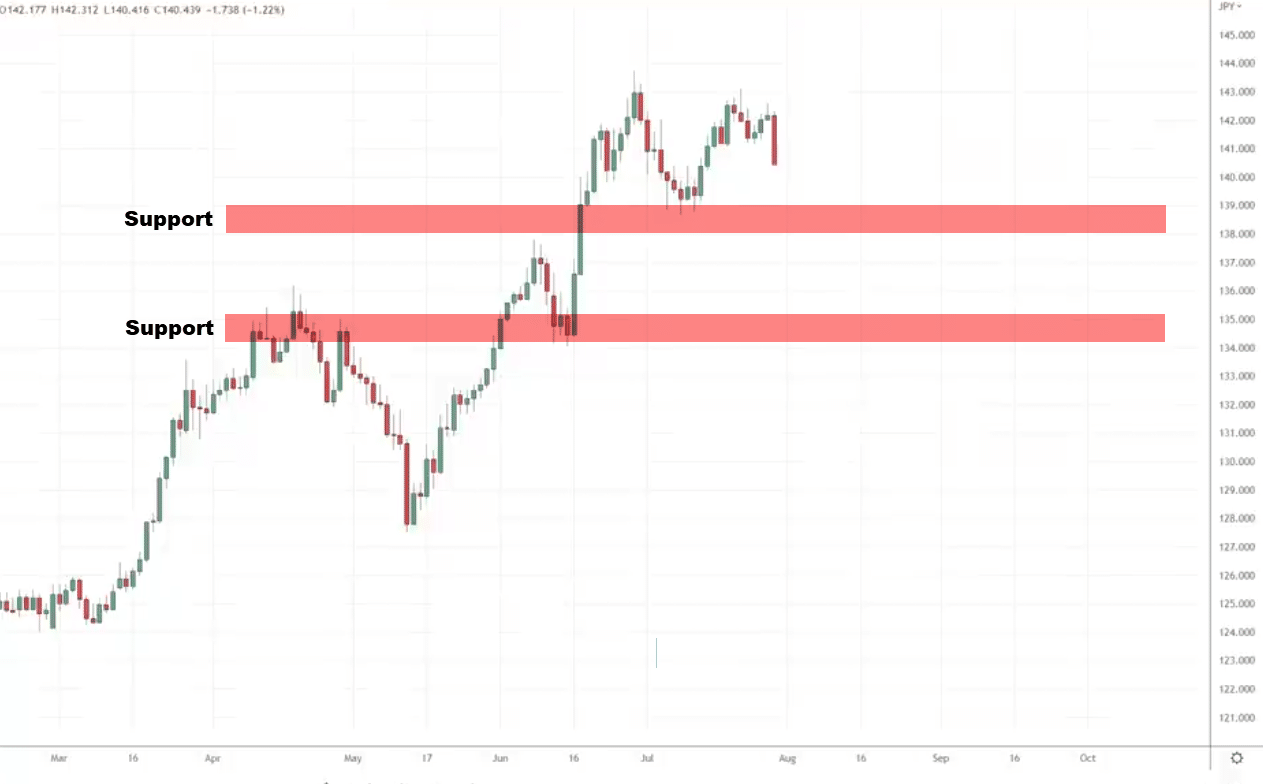
What is the market structure?
Market Structure
When the market is in an uptrend, we want to be buying as much as possible at support.
Area of Value
Let’s identify our area of support on this chart:
These are the two most recent swing points.
My next plan is that I will be looking for buying opportunities in the first and second areas of support if the price comes down.
Let’s see what happens next…
Entry
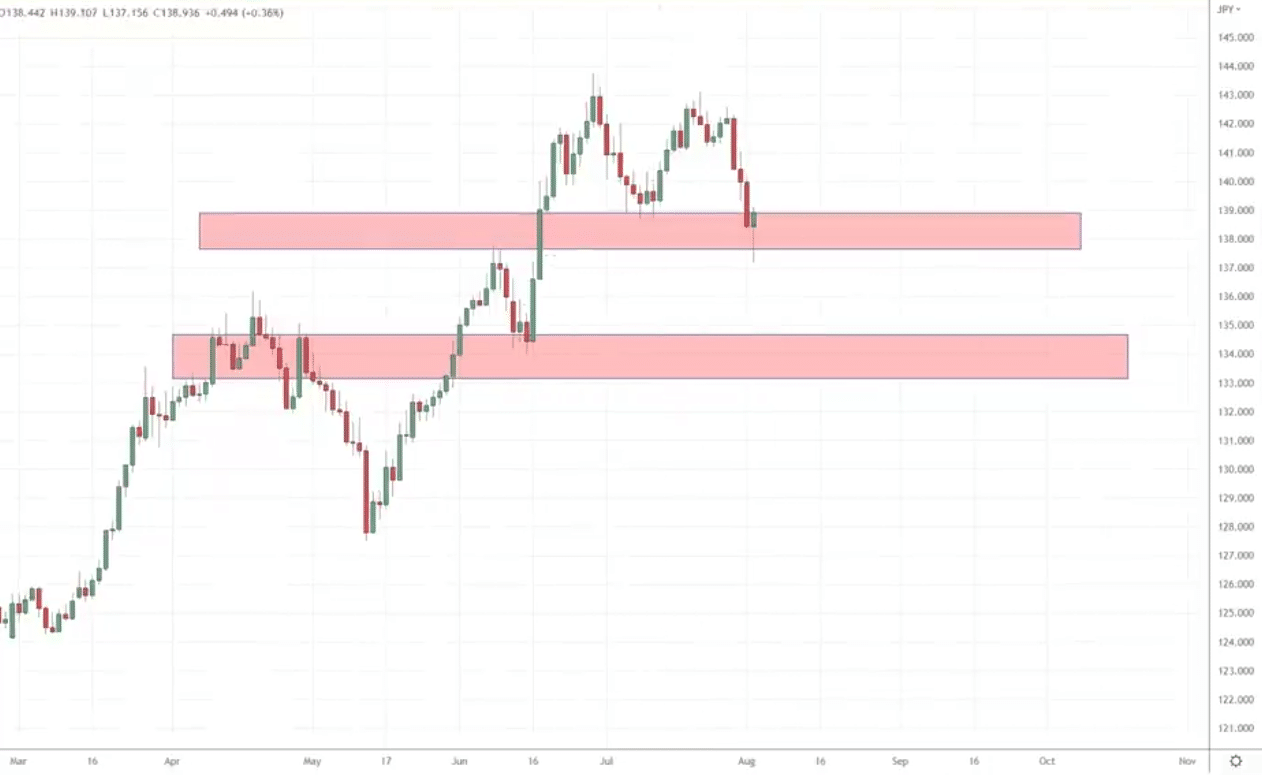
The market comes down into this area of support and we have a hammer.
If you remember a hammer tells us that the buyers are temporarily in control as they have managed to push the price and close near the highs of the day.
So, this is a valid entry trigger to go long. We go long on the next candle open.
Exit
Generally, when I set my stop loss, I’d like to have it a distance below the area of support.
The one way to go about doing it is that we can use the ATR indicator to help us with it.
So just search ATR, and pull it up. I typically go with our 20-period ATR and SMA
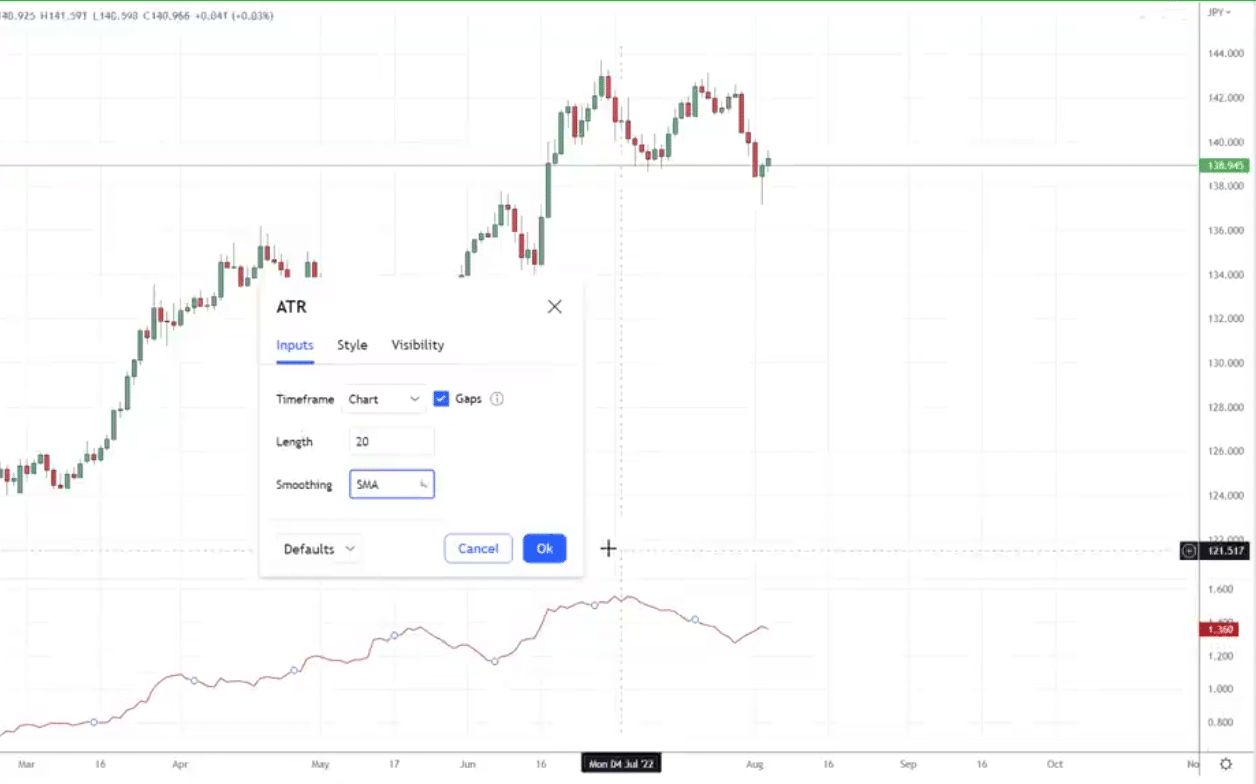
The ATR Value is 1.221
We identify the lows of the candle and minus 1.221
The low of the candle is 137.15
137.15 – 1.221 = 135.93
This would be our stop loss.
Targets
There are many ways to go about setting your target, but for simplicity’s sake, we can set our target just before the recent swing high.
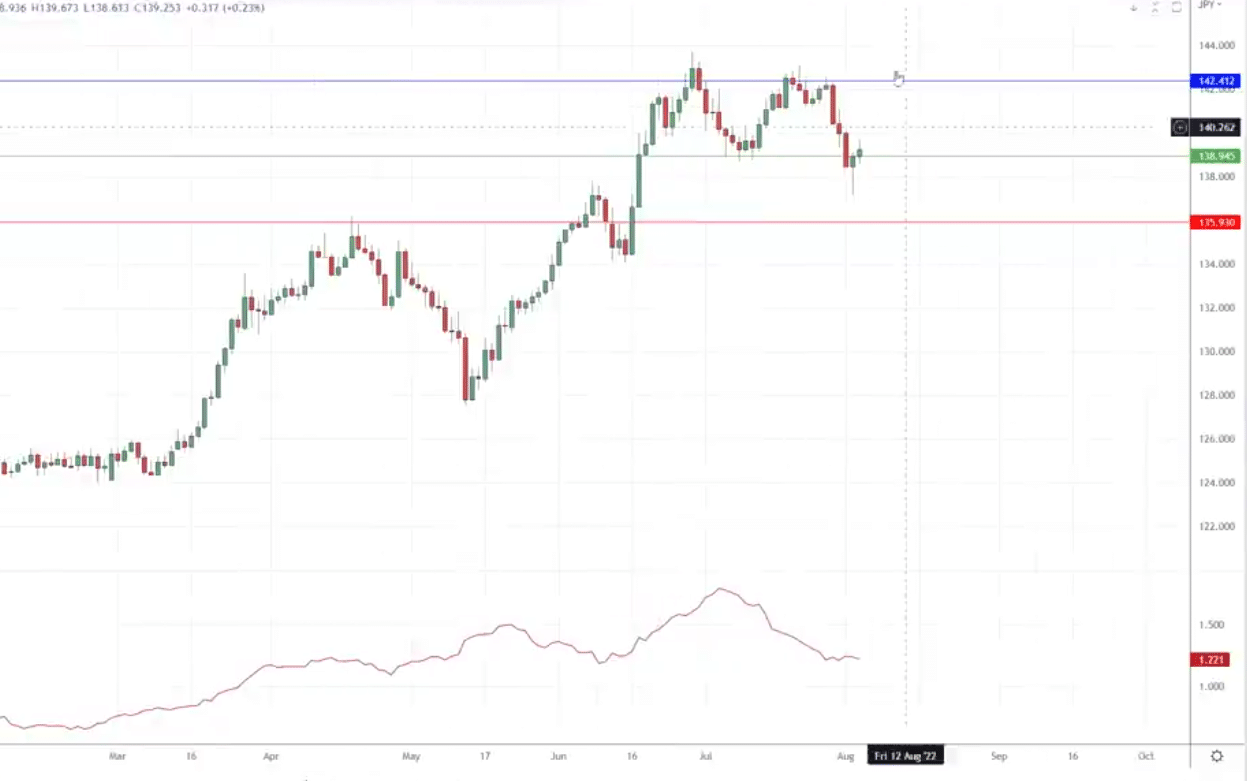
This swing high over here could be a good reference point for us to take profit where sellers might come in and put some selling pressure over here.
This a good example of how you can use support and resistance to time your entry and identify trading setups in the market.
Conclusion
Support and resistance levels are the most versatile tool you can ever learn and master.
However, learning how to draw support and resistance levels accurately can be a double-edged sword.
It can provide you with accurate entries and trade management ideas.
But at the same time…
Learning how to draw and apply them accurately can be quite challenging.
Nonetheless, here’s what you’ve learned today:
- You can fine-tune your support and resistance levels by always taking into account the most touches in an area
- Support and resistance levels are areas on your chart: drawing them using boxes and lines captures the principle that they are areas (and not lines) on your chart
- In a range market, always look out for higher and lower rejections as a reference for your support and resistance levels
- Support and resistance levels are powerful tool to time your entries as the price rejects from support and to also time your exits if the price reaches resistance
Over to you…
Has support and resistance stuck in your trading for the longest time?
If so, are there any other tips you can add to the list on how to draw them accurately?
Let me know in the comments below!


