Entry Trigger
What is an entry trigger?
An entry trigger is simply a specific price pattern to help you time your entry.
A few common ones I want to share with you are called the hammer and the shooting star.
Example:
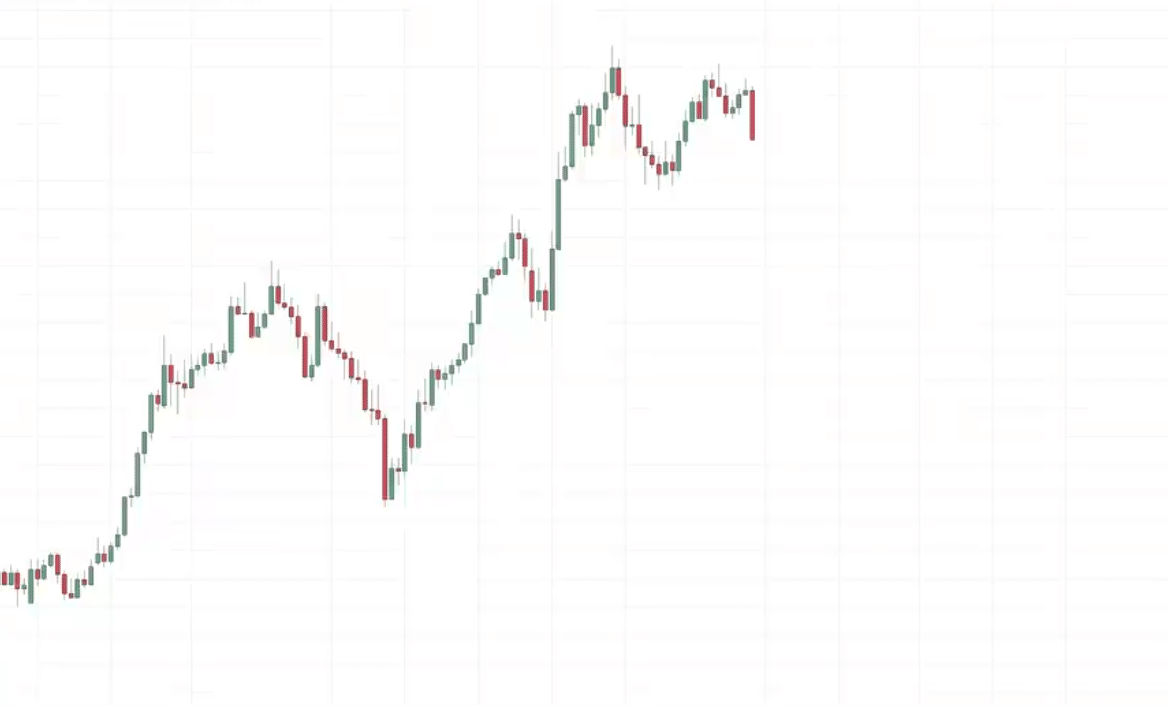
What is this market structure?
You can see this market is in an uptrend.
When a market is in an uptrend, we want to be buying as much as possible at support.
Let’s identify our area of support on this chart.
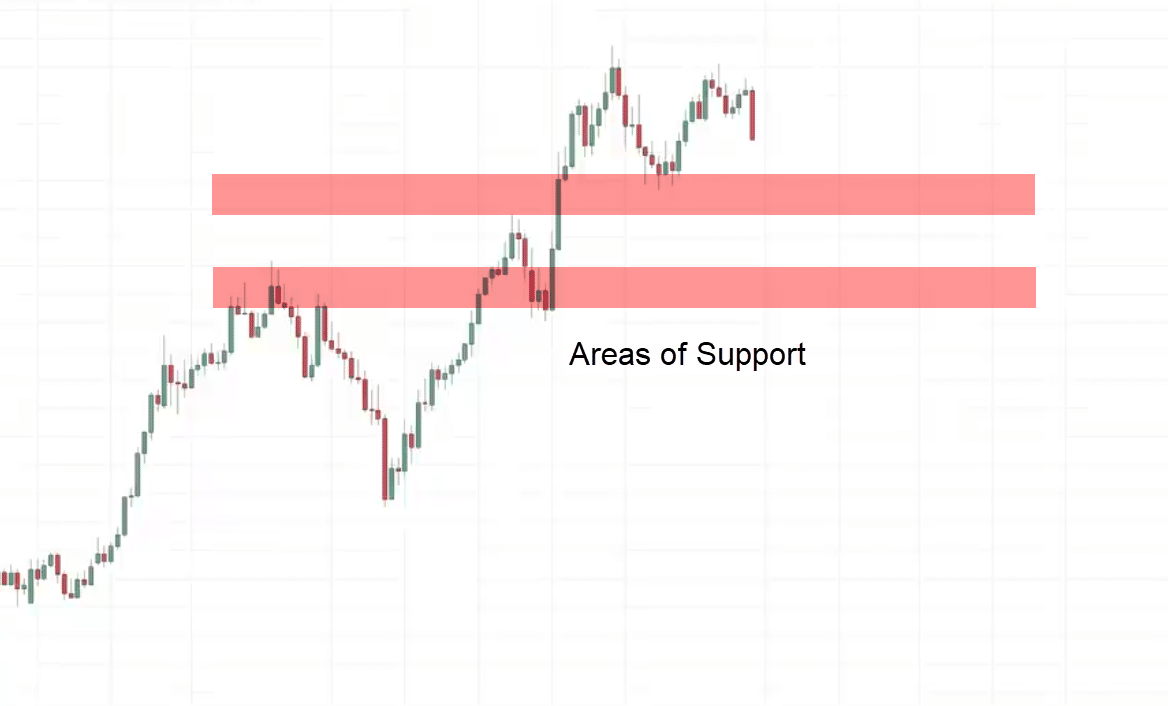
These are the two most recent swing points on the chart.
I will be looking for buying opportunities in the area of support
Let’s see what happens next…
The market comes down
We have a hammer.
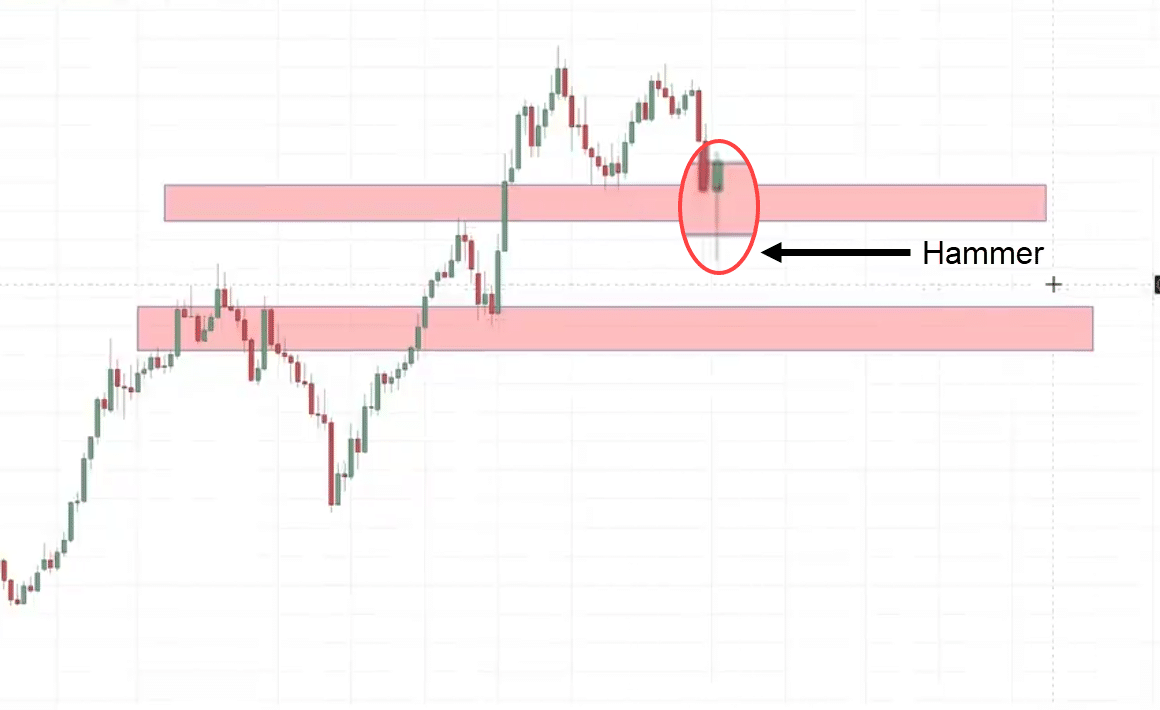
If you remember, a hammer tells us that the buyers are temporarily in control as they have managed to push the price and close near the highs of the day.
This is a valid entry trigger to go long.
We go long on the next candle open.
What about our stop loss?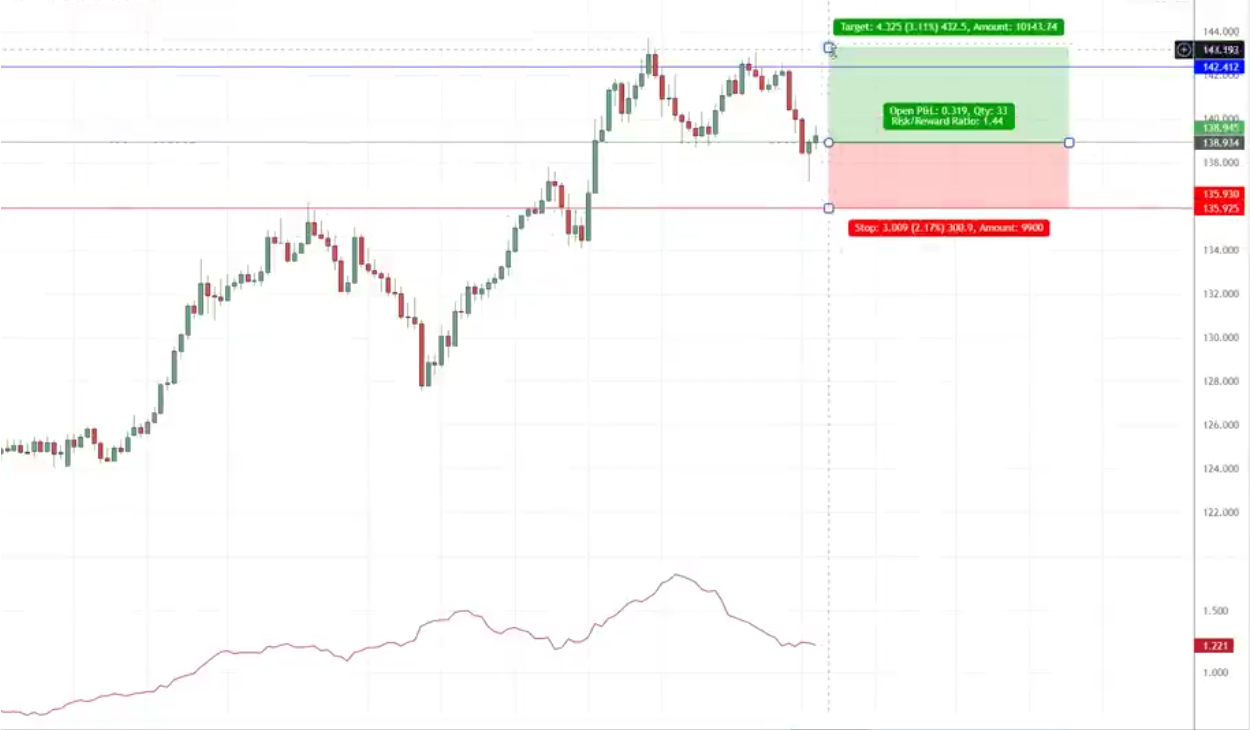
Generally, when I set my stop loss, I like to have it a distance below the area of support.
The ATR indicator can help us with that.
What about targets?
There are many ways to go about setting your target, but for simplicity’s sake, we can set our target just before the recent swing high.
This will be a potential level to set your target.
If you want to assess this from a risk-to-reward standpoint, you use this particular tool over here, click long position.
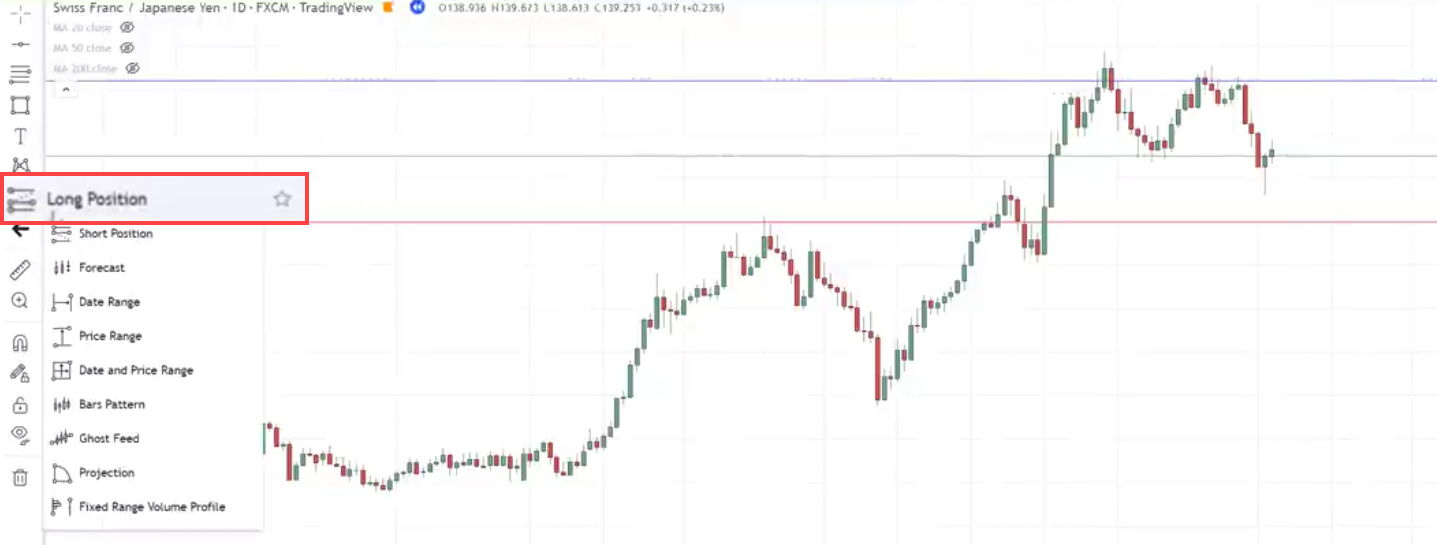
This means you’re risking $1 to potentially make $1.14 for this particular trade, and just to walk you through this particular trade.
Let’s see…
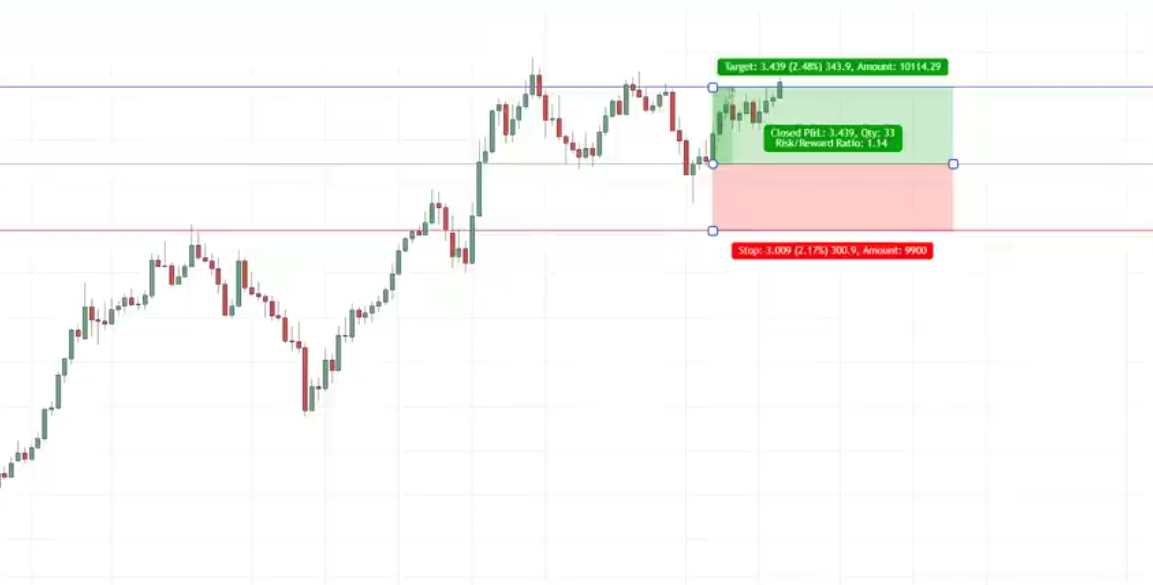
Eventually, the market did hit our target over here on this candle giving us a profit.
Conclusion
Support and resistance is probably the very first thing you learn in technical analysis.
While some traders “outgrow” this concept…
It is still by far one of the most powerful price action concepts out there.
Nonetheless, here’s what you’ve learned in today’s training…
- Support and resistance is much more relevant in a range than in an uptrend
- Drawing your support and resistance as a box instead of a line gives a complete picture of the area of value on your chart
- You can use candlestick reversal patterns as an effective entry trigger when trading support & resistance
- Waiting for the price to reach the area of value first allows you to have monster risk-to-reward ratios
Over to you…
How do you plot your support and resistance?
Using a box, or using a line?
Also, what kind of setups do you usually take when using support and resistance?
Let me know in the comments below!


