Let me ask you…
What’s a popular trading tip you ways hear?
That’s right.
“The trend is your friend”
“Trade the path of least resistance”
“Never trade against the trend”
And of course, to most extent…
This conventional trading wisdom is pretty important!
But for today’s guide…
I’ll teach you the dark arts of technical analysis, something that goes against conventional trading wisdom:
Trend reversals.
I’ll teach you not only how to properly spot them but also give you the essential trend reversal indicator you need to profit from them.
Sounds good?
So, here’s what you’ll learn today…
- What is a trend reversal and how to exactly identify one so you avoid getting “trapped” with false signals
- A crucial criterion to keep in mind when choosing trend reversal indicator or indicators in general
- The Donchian channel, a versatile trend reversal indicator that works both in catching trends and trend reversals
- A zigzag indicator that ensures you never second-guess yourself again when timing reversals
- An all-in-one Supertrend indicator that spits all the right trend reversal signals for you to take
Wow, that’s a lot to discuss!
That’s why at the end of this trading guide…
You’ll find yourself being a master of trend reversal indicator.
Sounds good?
Then let’s get started!
Trend reversal indicator: How to consistently spot trend reversals in the market
You know what a trend looks like, right?
Good.
How about a trend reversal?
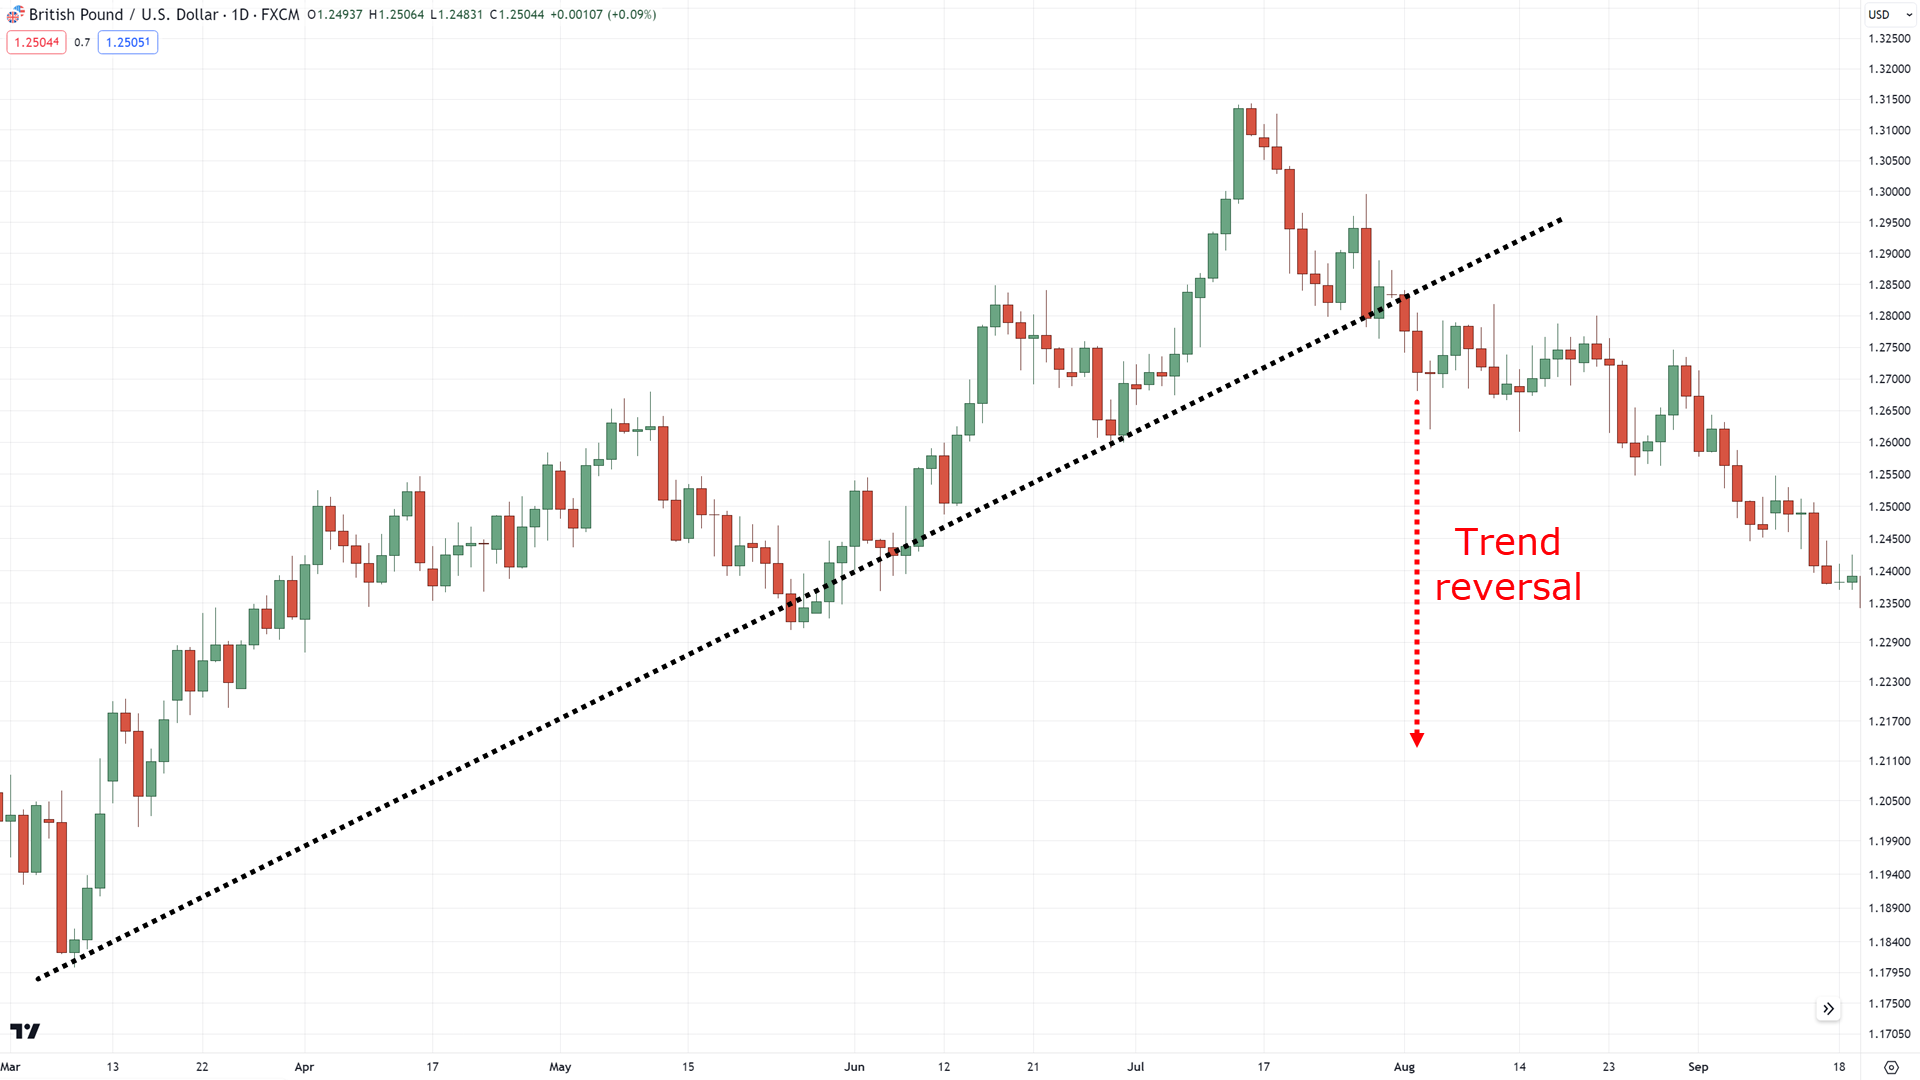
Yep, that’s right!
But here’s the question…
“When” does the trend reversal happen?
Sure, you can point to this as the start of a trend reversal.
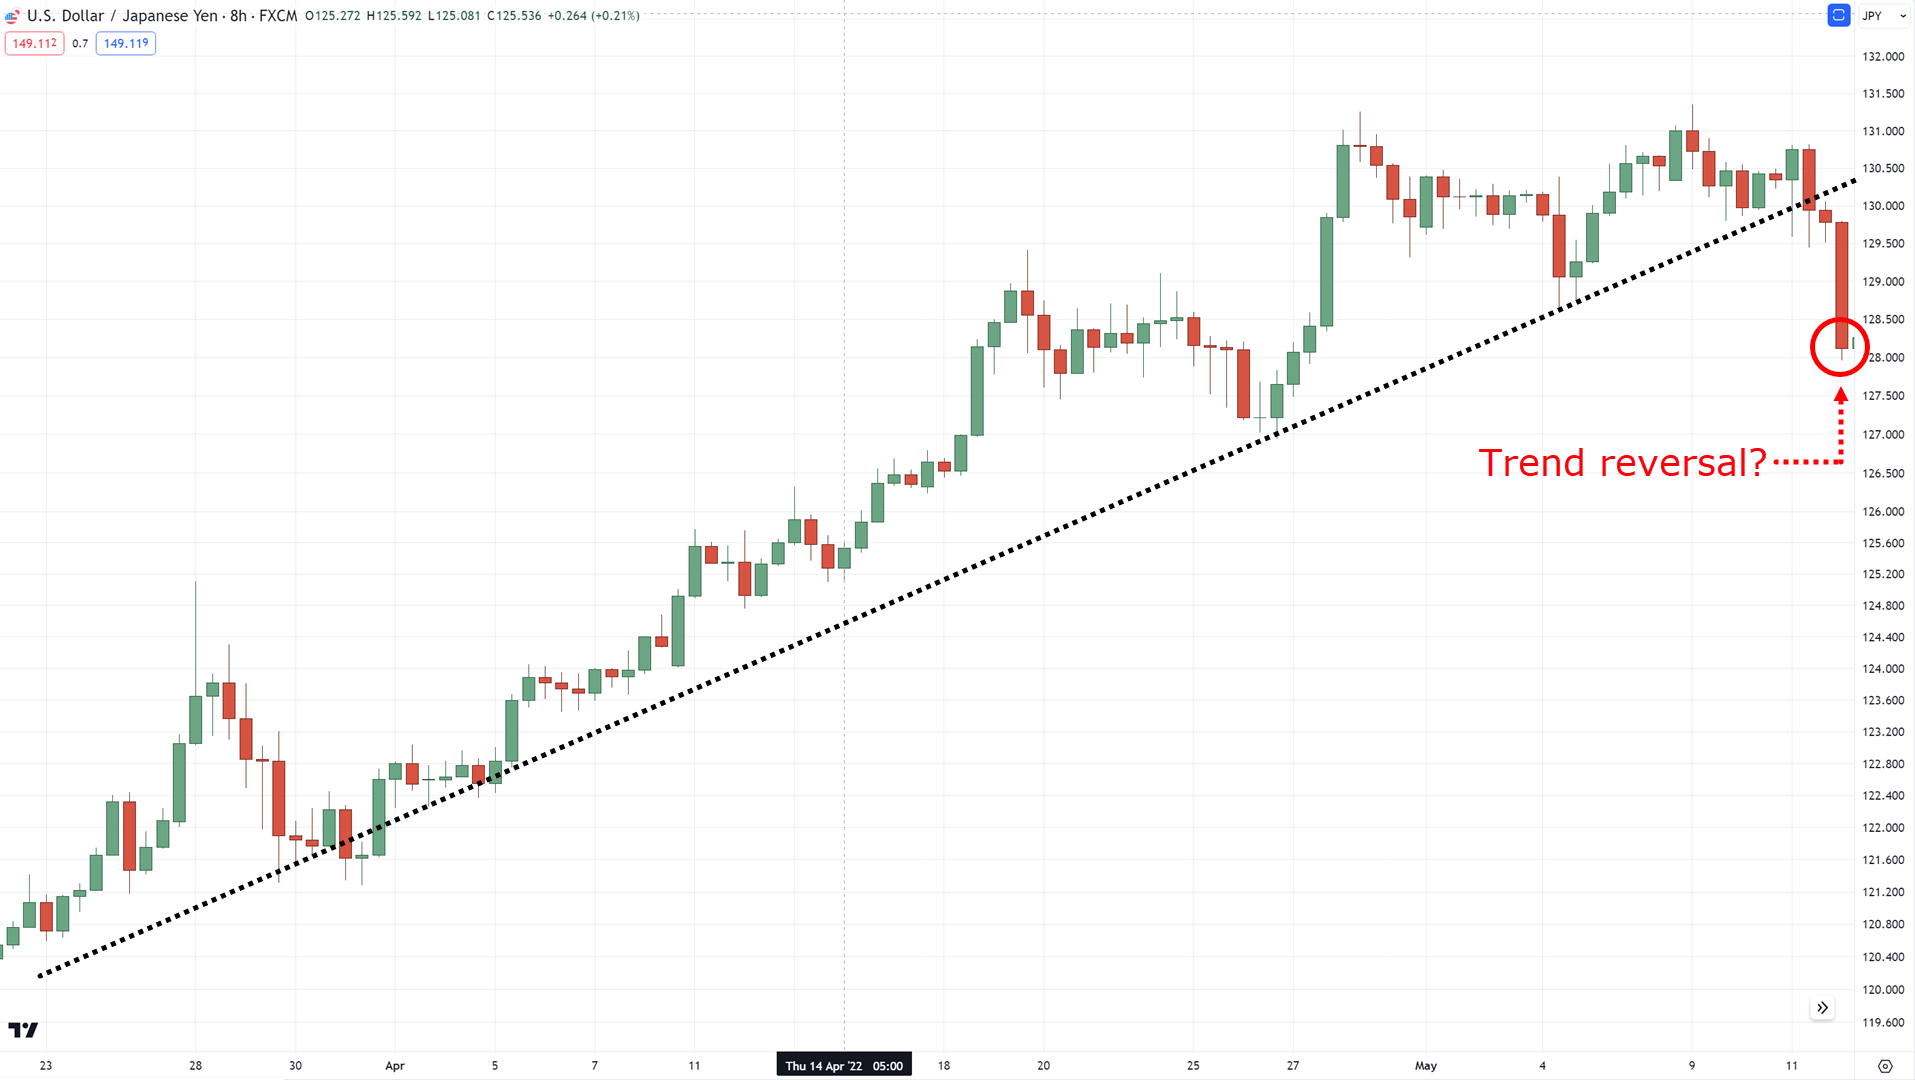
But how sure are you that it’s not just a pullback?
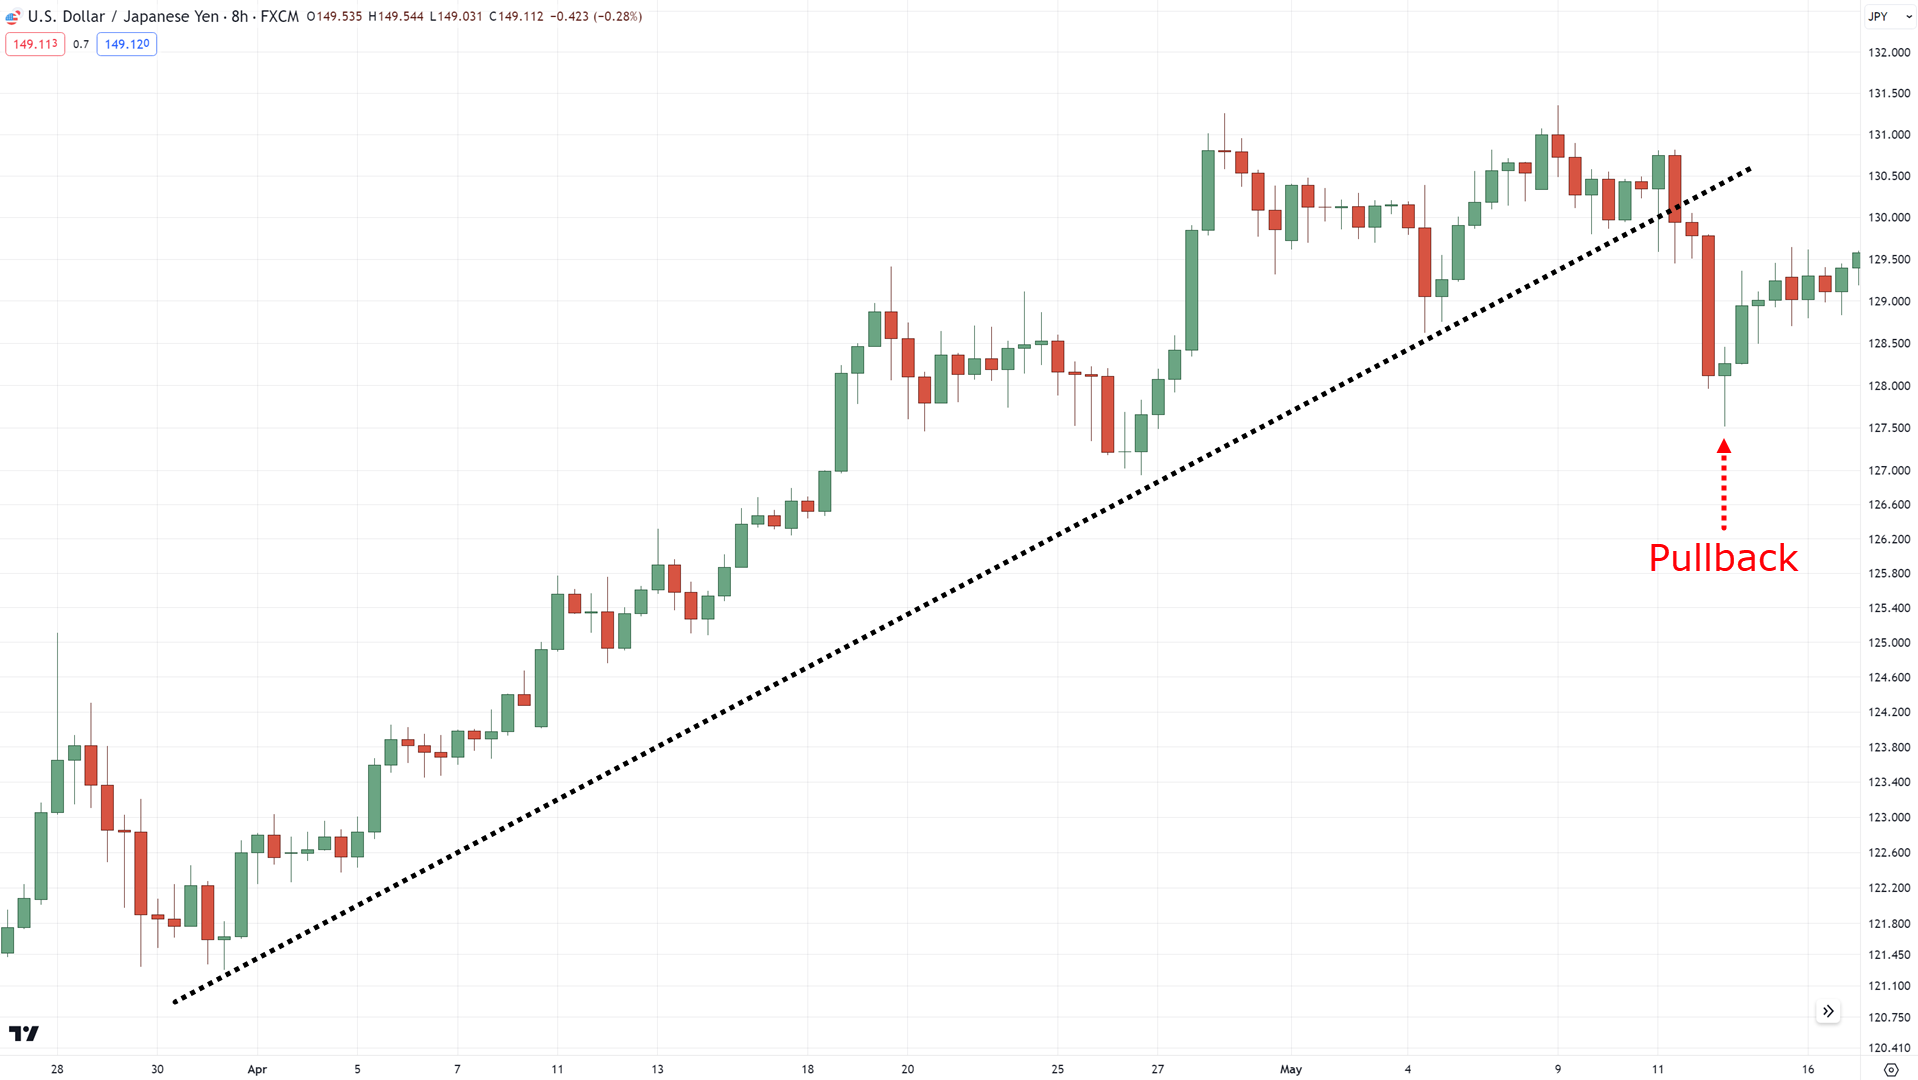
Yep, we can never be sure!
You’d just be guessing!
So, when exactly can we say that a trend reversal is happening?
Here’s how…
Break of the trend line and two new lower lows
To put it simply…
You’d first want the price to break the trend line of the trend.
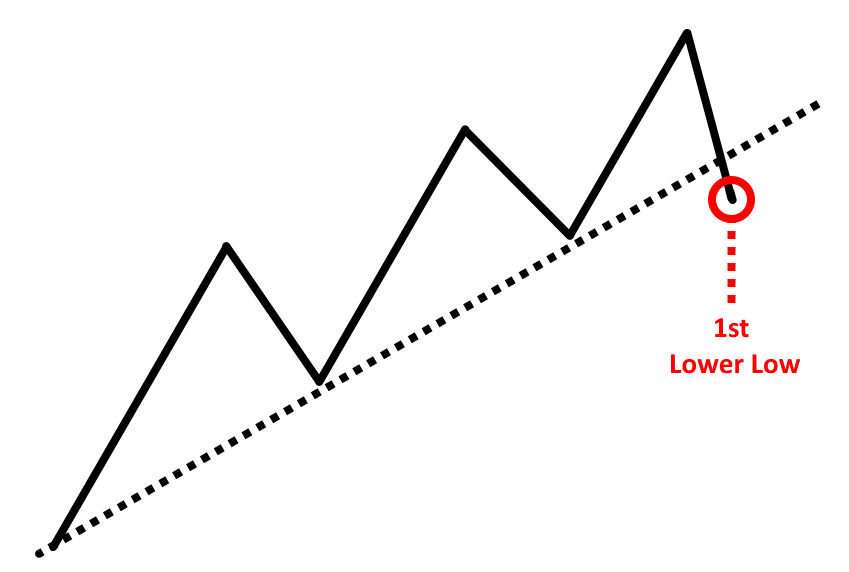
Which now counts as the first lower low!
But if you recall…
It’s often too early to call this a trend reversal.
So, what do you do?
Wait for the price to pull back…

Then BOOM!
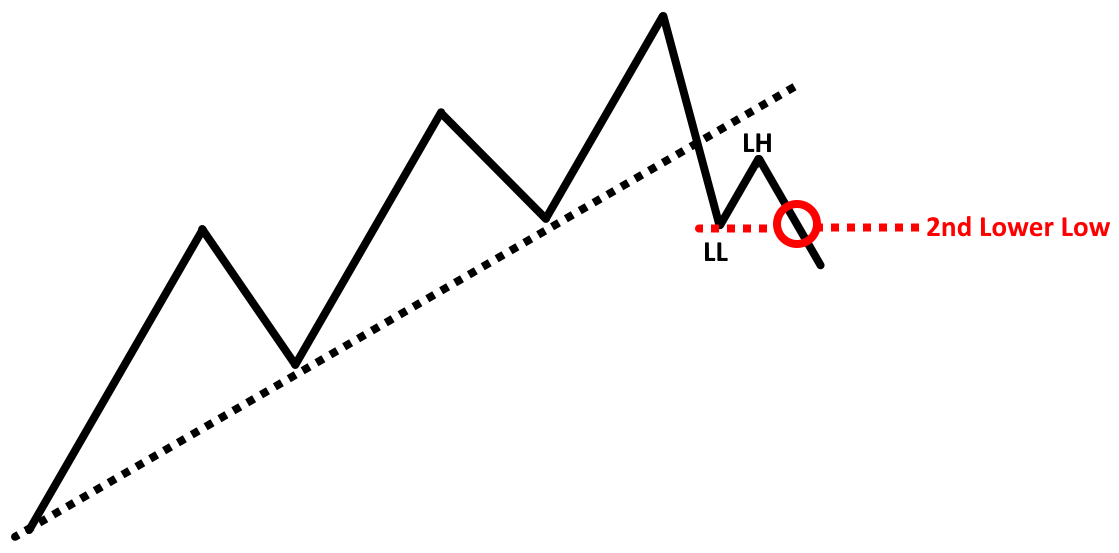
Wait for the price to make a 2nd lower low!
So, to put things in perspective…
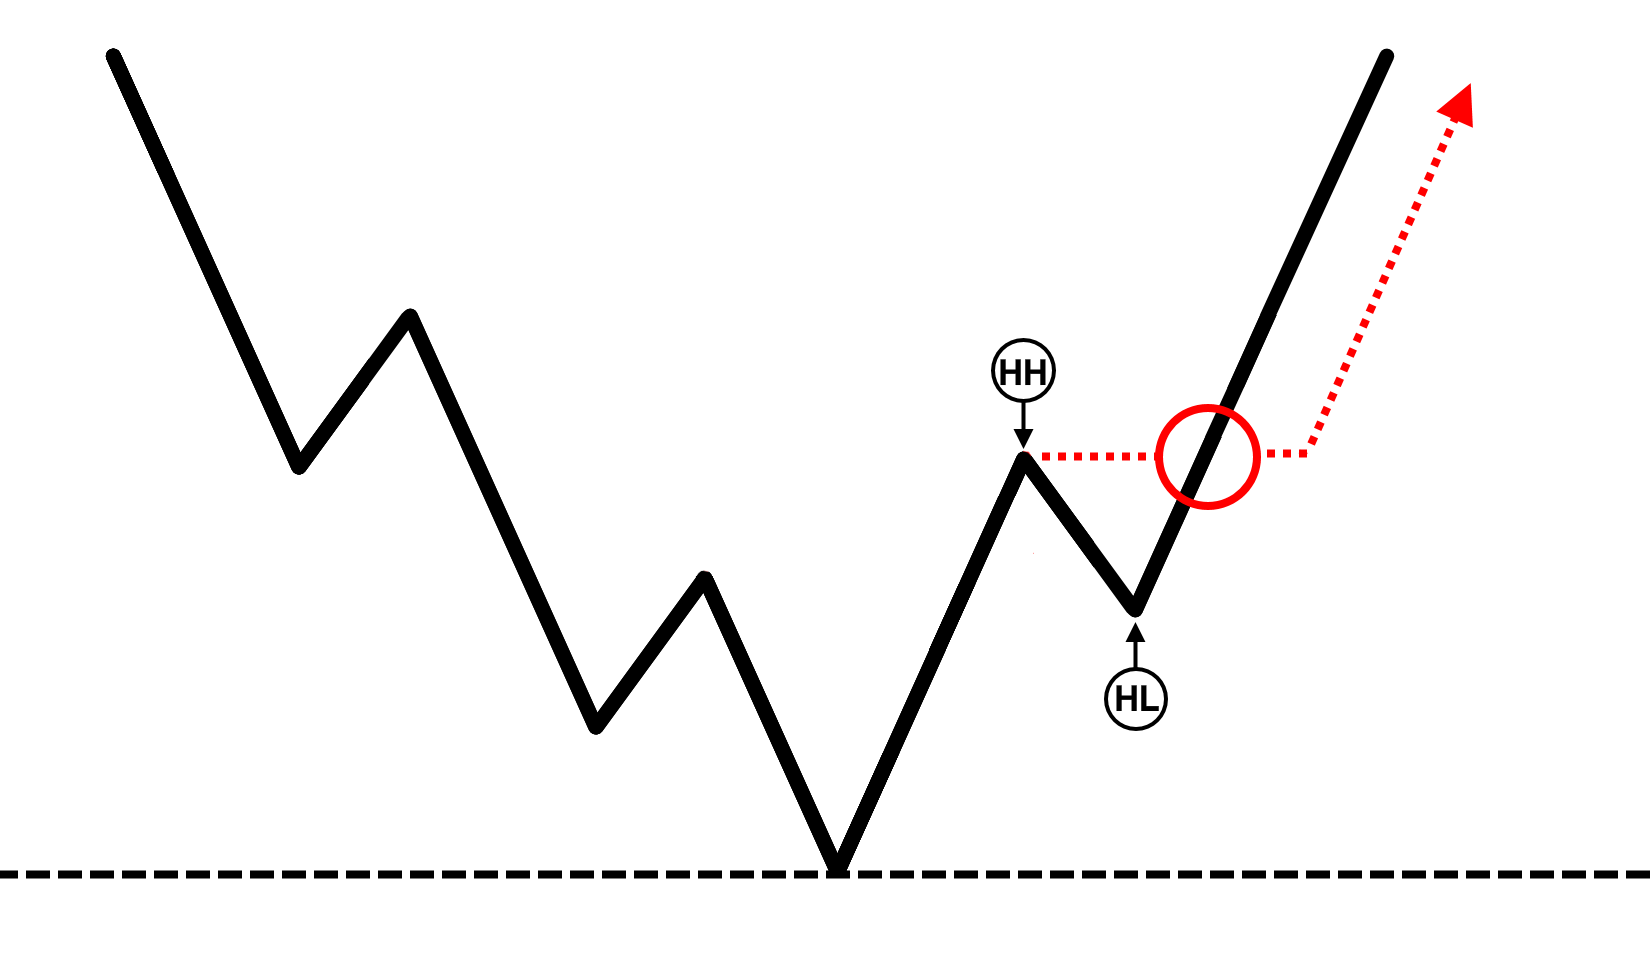
A trend reversal is valid once it closes below the 2nd lower low.
Or, in this case…
A 2nd higher high for bullish trend reversals:
Makes sense?
Now that you know the nitty-gritty details on what a trend reversal is and when it happens…
It’s time to simplify things.
That’s right.
Everything from now on will be much simpler as I share with you a trend reversal indicator that should make your life easier.
So, are you interested?
If so, then keep reading, and let’s get started…
What do you need to look for on a trend reversal indicator?
Repeat after me:
Indicators should not simplify and not complicate your trading.
How so?
Because trading indicators are tools!
And tools should make our trading much easier!
It just makes sense, right?
And that, my friend
This is the first thing we’re looking for in a trend reversal indicator…
The indicator must be simple to understand
No, you might be wondering:
“Shouldn’t we just look for a buy and sell signal?”
Sure!
However…
I want you to keep in mind that you are trusting your hard-earned money with these indicators.
So, it only makes sense for you to understand them, right?
That is why if you can’t understand how your indicator produces its signals…
Then you will not have the confidence to be consistent with that indicator when losses come your way.
Makes sense?
The next thing we are looking for on a trend reversal indicator is that…
It must be free and accessible
Good news, am I right?
Because the goal here is that after you have finished reading this trading guide…
You will be able to instantly apply something to your trading plan.
Finally, the last thing we are looking for on a trend reversal indicator is…
The indicator must fulfill the principle behind detecting trend reversals systematically
Remember the example I showed you before?

That’s right, we want to find a trend reversal indicator that aims to systematize this.
Because, after all…
Trading indicators should make our lives easier by detecting trend reversals.
And that my friend is what we are looking for.
So, the first one on the list is…
Trend reversal indicator #1: The Donchian Channel
“Wait a minute, the Donchian channel is a trend-following indicator, right?”
You’re not wrong!
But that’s what makes this indicator special…
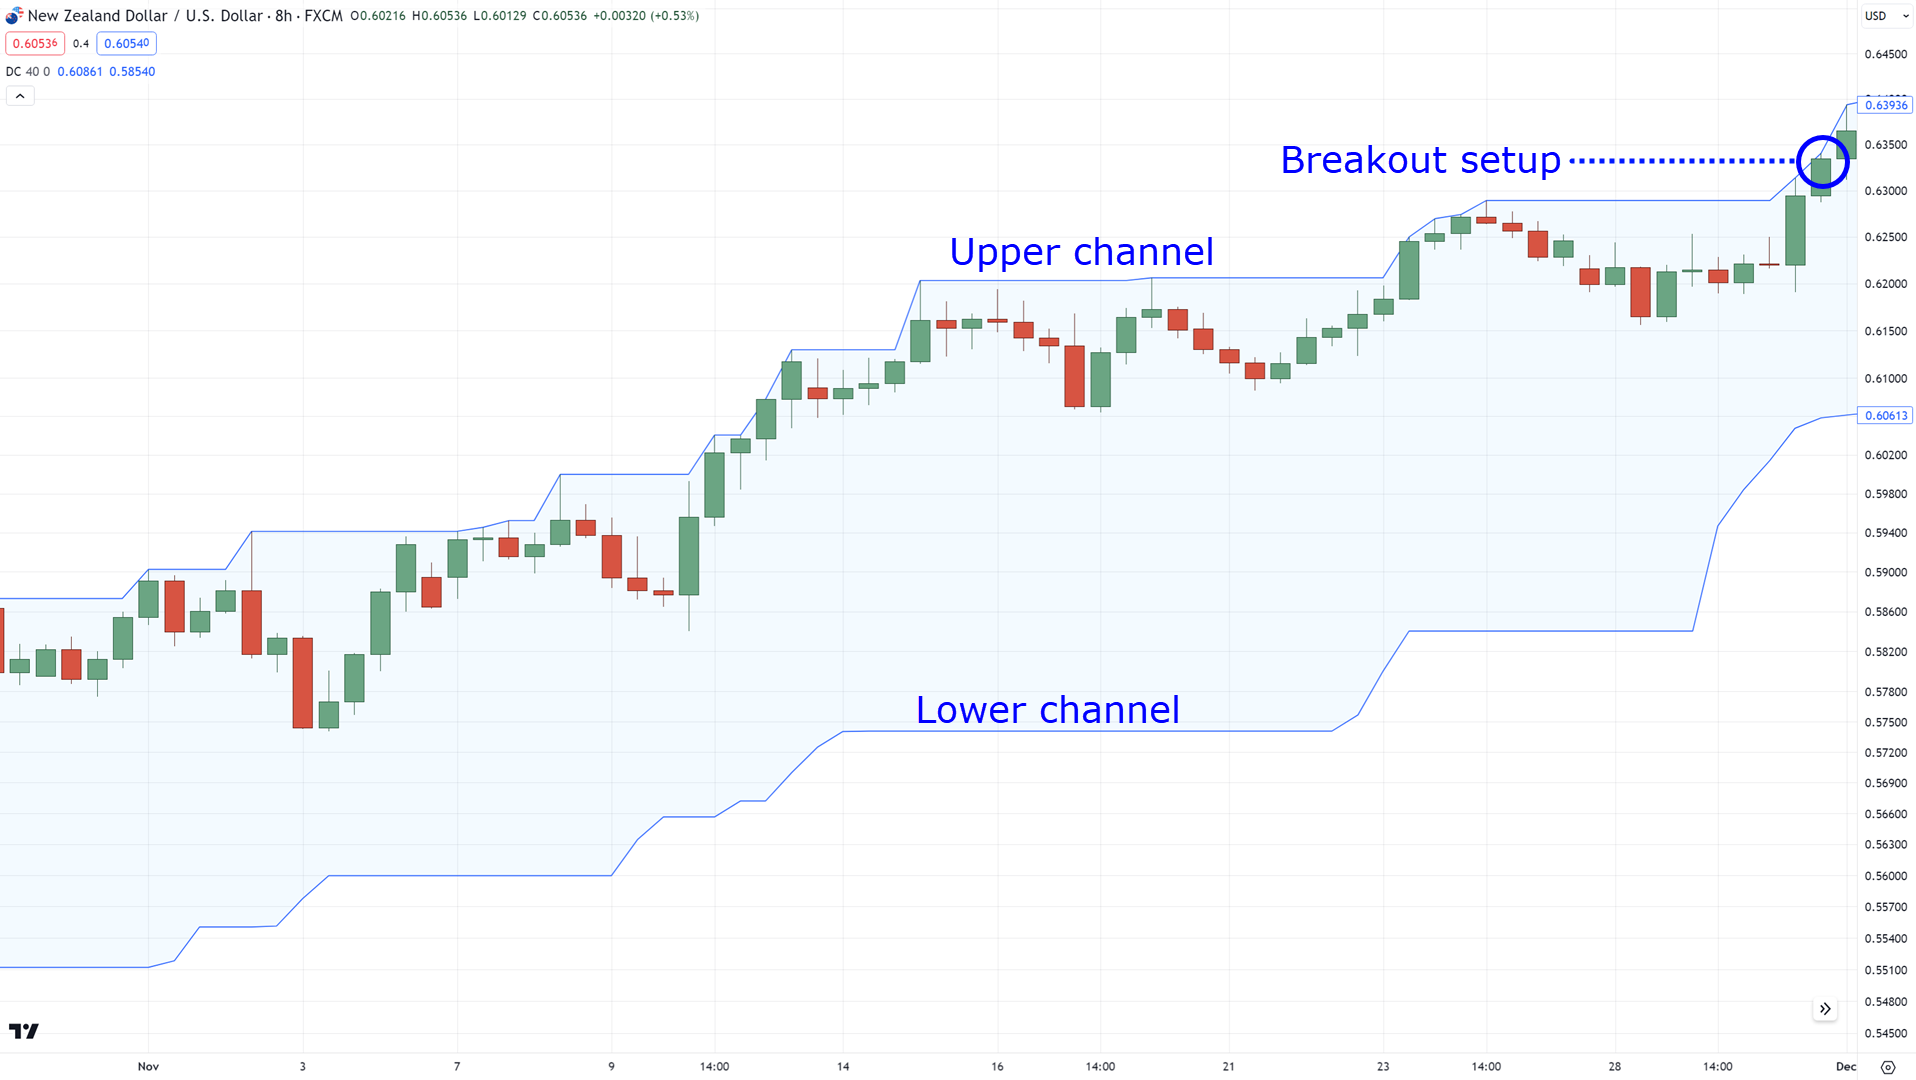
You can use it to time breakouts:
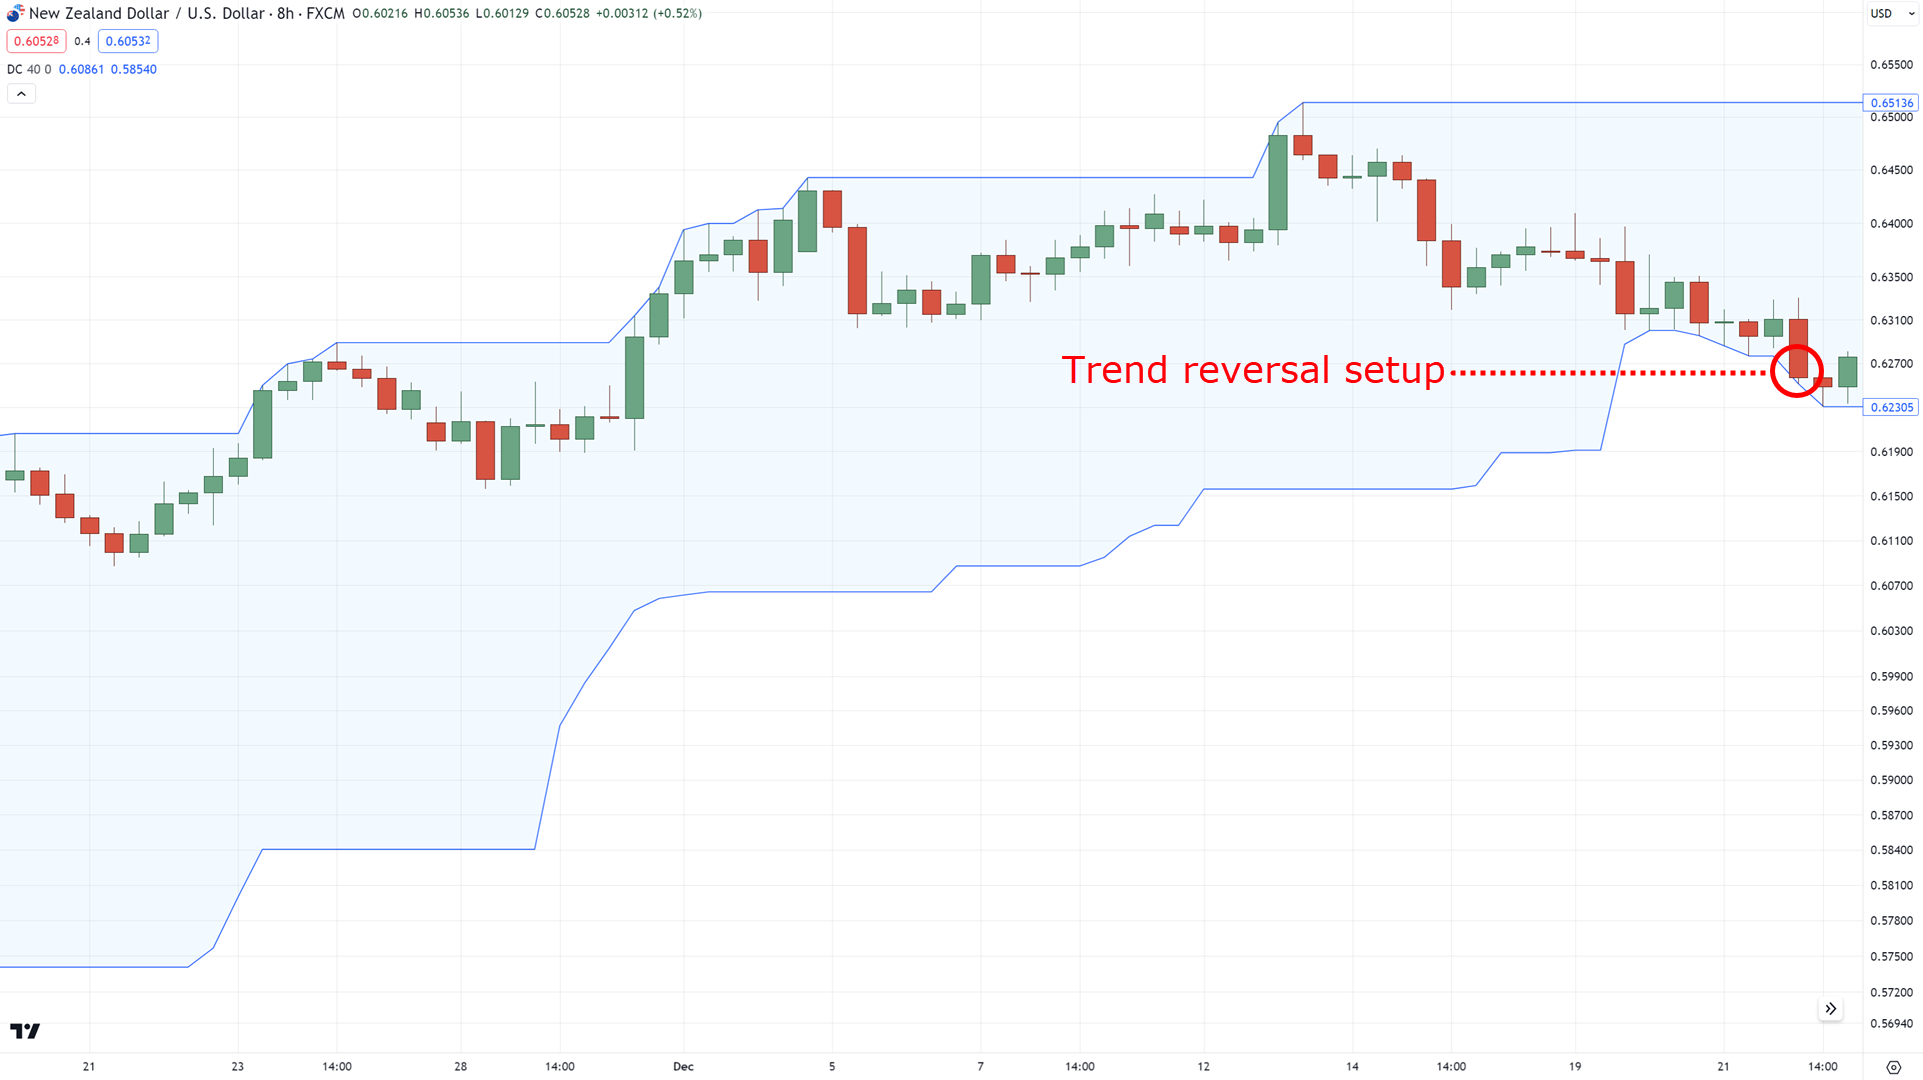
And time trend reversals:
Pretty awesome, right?
So, to get straight to the point:
How can you trade trend reversals using the Donchian channel?
The first step is to look for a valid uptrend:
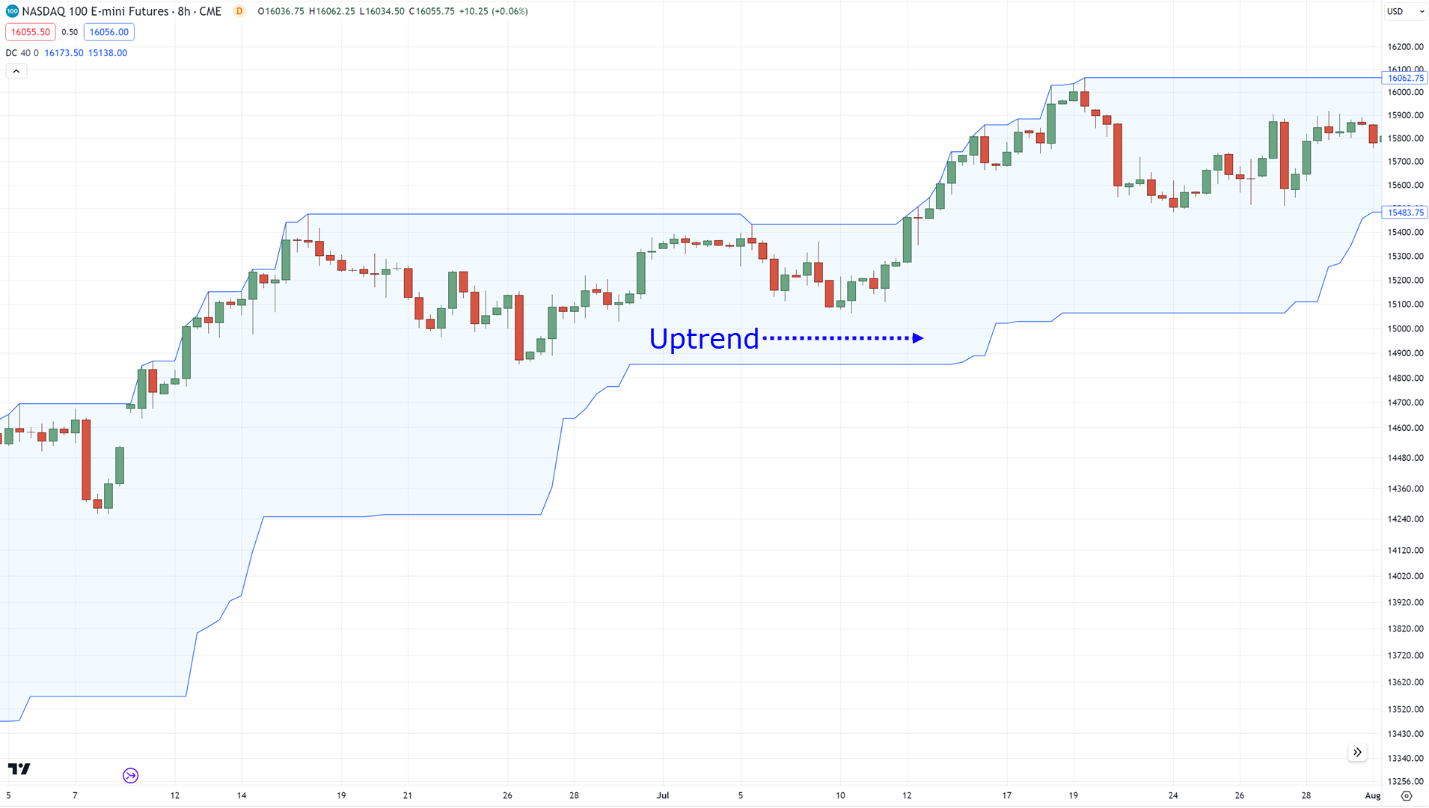
If you’re an avid user of this indicator, I wouldn’t be surprised if you’re already in the trade!
Now, one thing to take note of is that the price must be constantly close to the upper channel (I’ll explain more later):
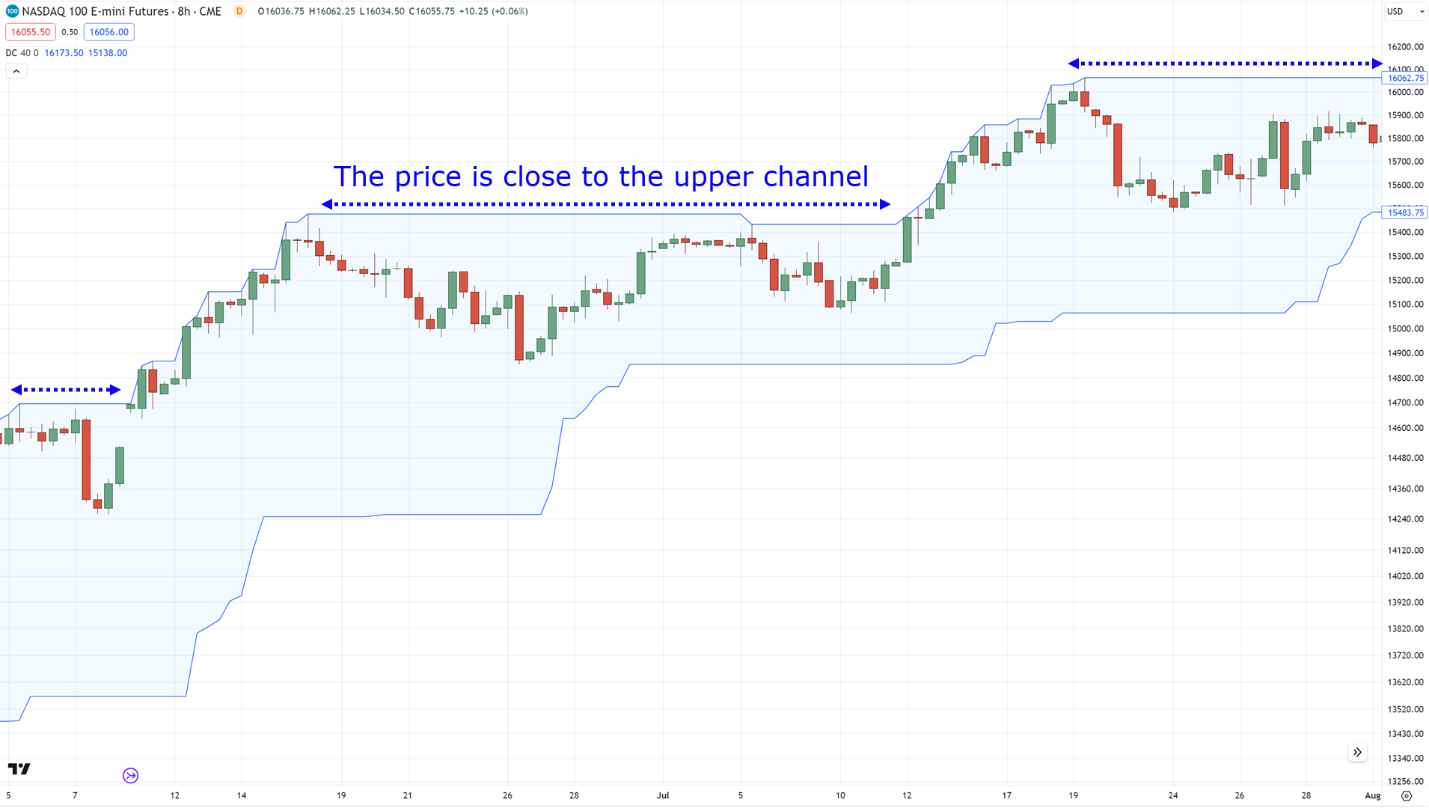
Got it?
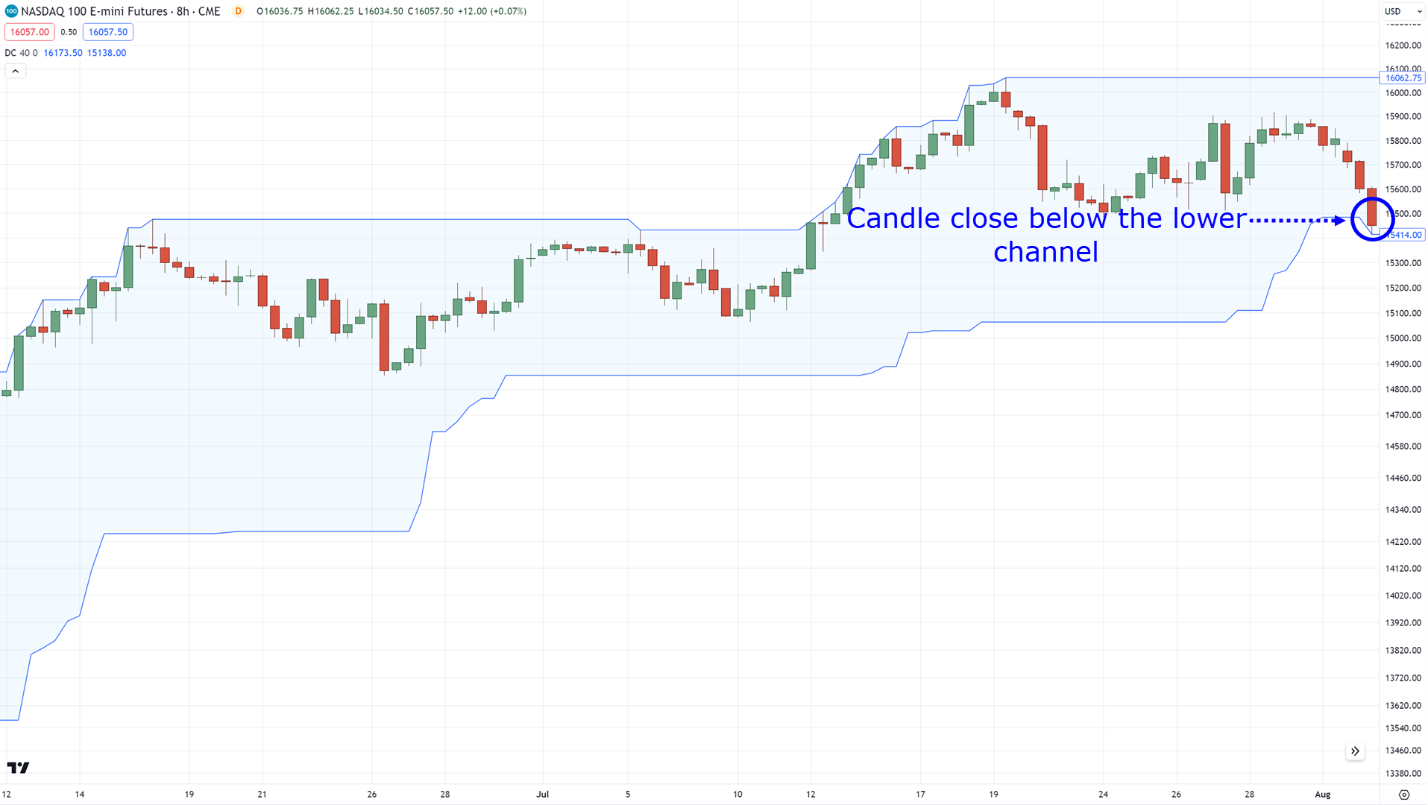
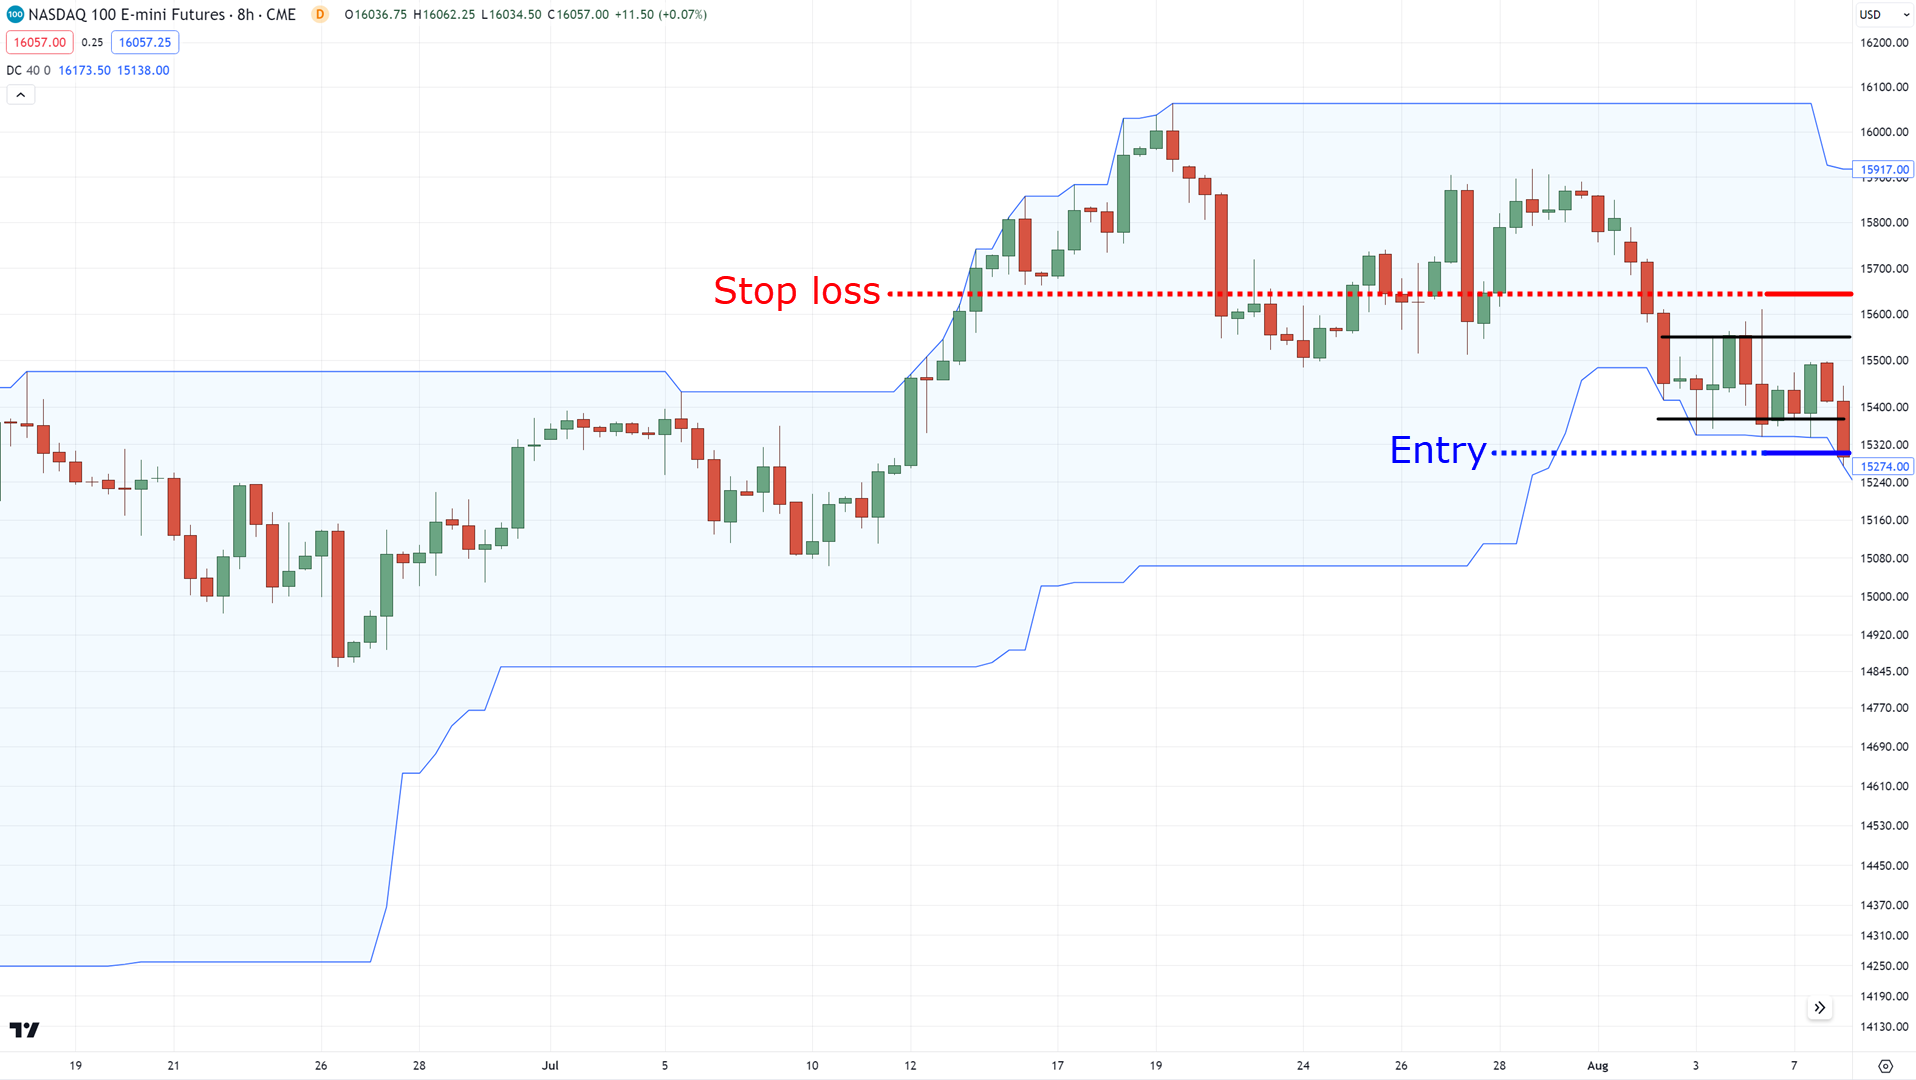
So, the next step is to wait for it to close below the lower channel:
Then wait for a bearish flag pattern to form at or above the lower channel, and break below it:
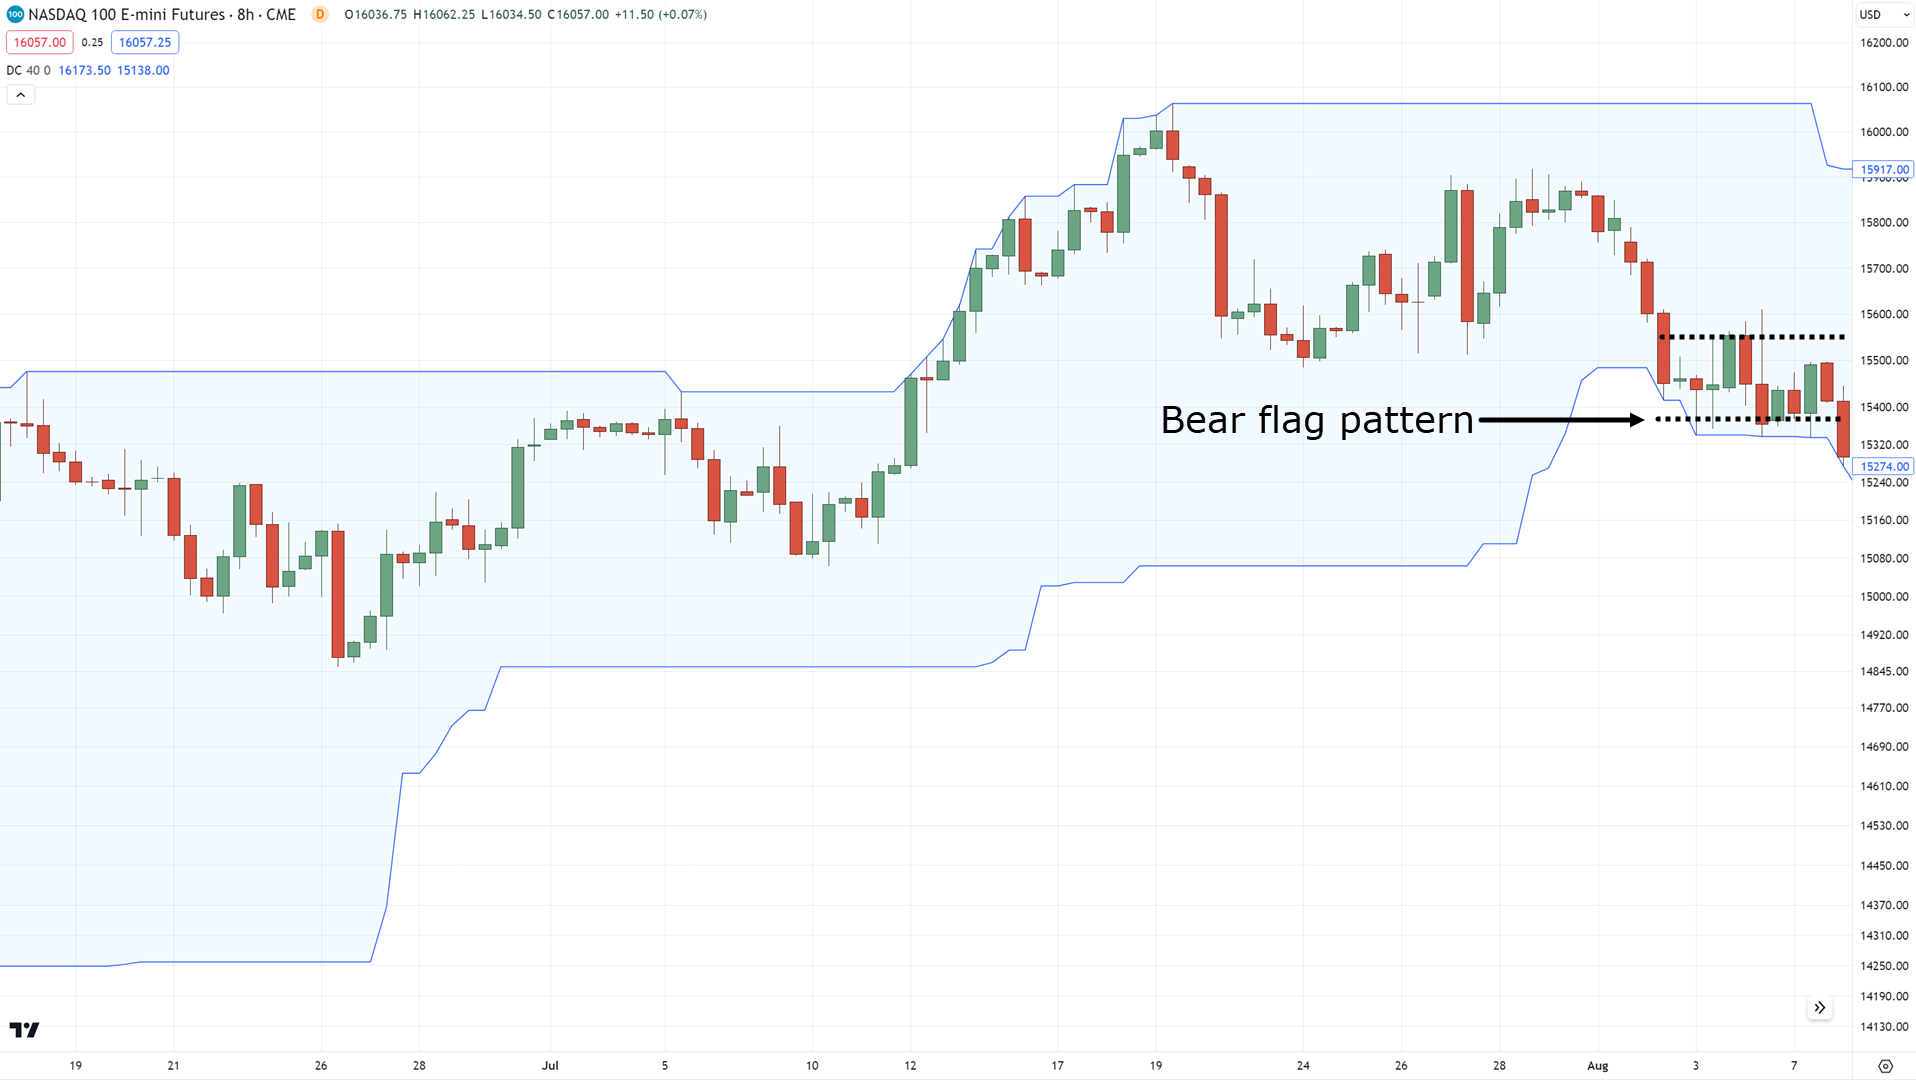
Before setting your entries at the break of the flag pattern stop loss at the upper channel.
Here’s what I mean:
At this point, I feel like you already have a lot of questions in your mind:
“Why do we need to wait for a flag pattern”
“Why aren’t there any take profit levels?”
Don’t worry, my friend as I will answer them for you.
First, the reason why we wait for a flag pattern to form is so that we don’t become overly dependent on the indicator itself.
Because if you recall…
We use indicators to make our life easier, but at the same time accomplish the principle that we are looking for in a trend reversal:

It’s all starting to make sense now, right?
And now you might be wondering…
“What is the best trend reversal indicator period to use?”
Now, here comes the important part…
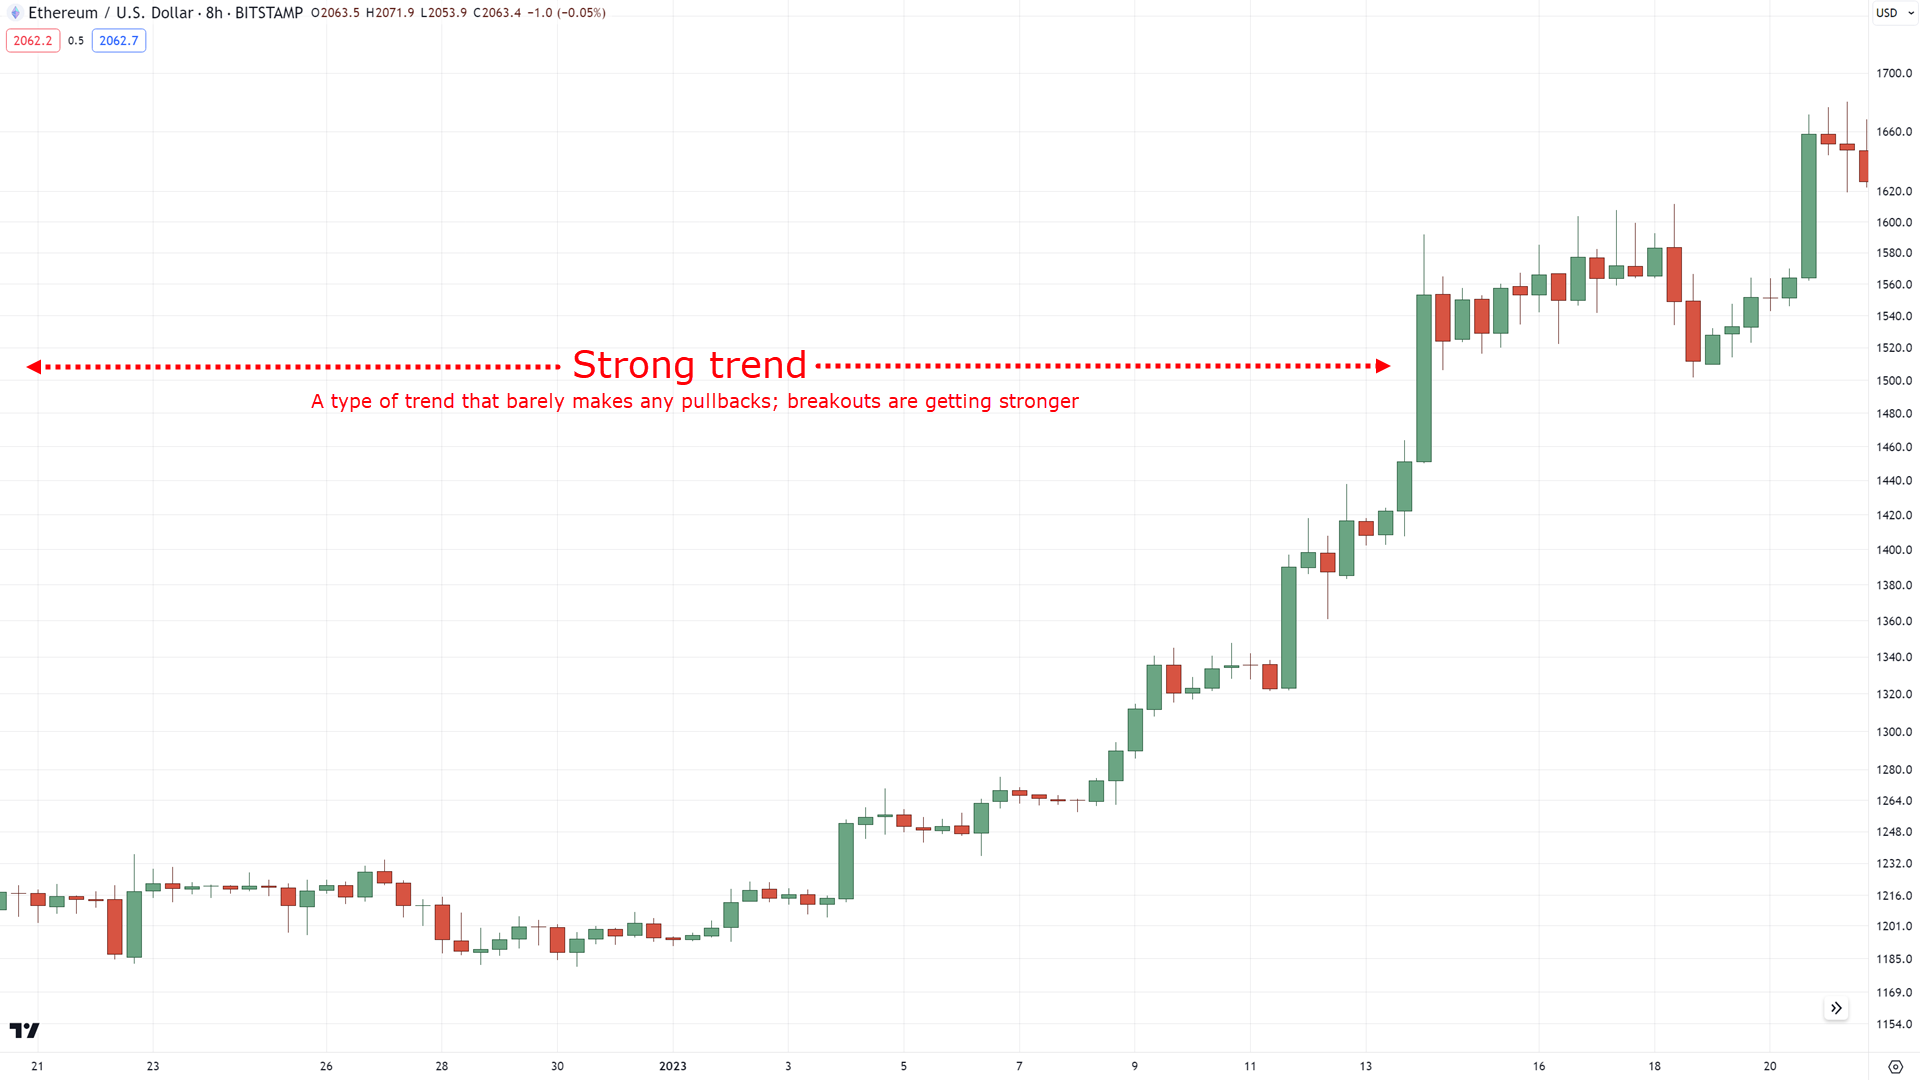
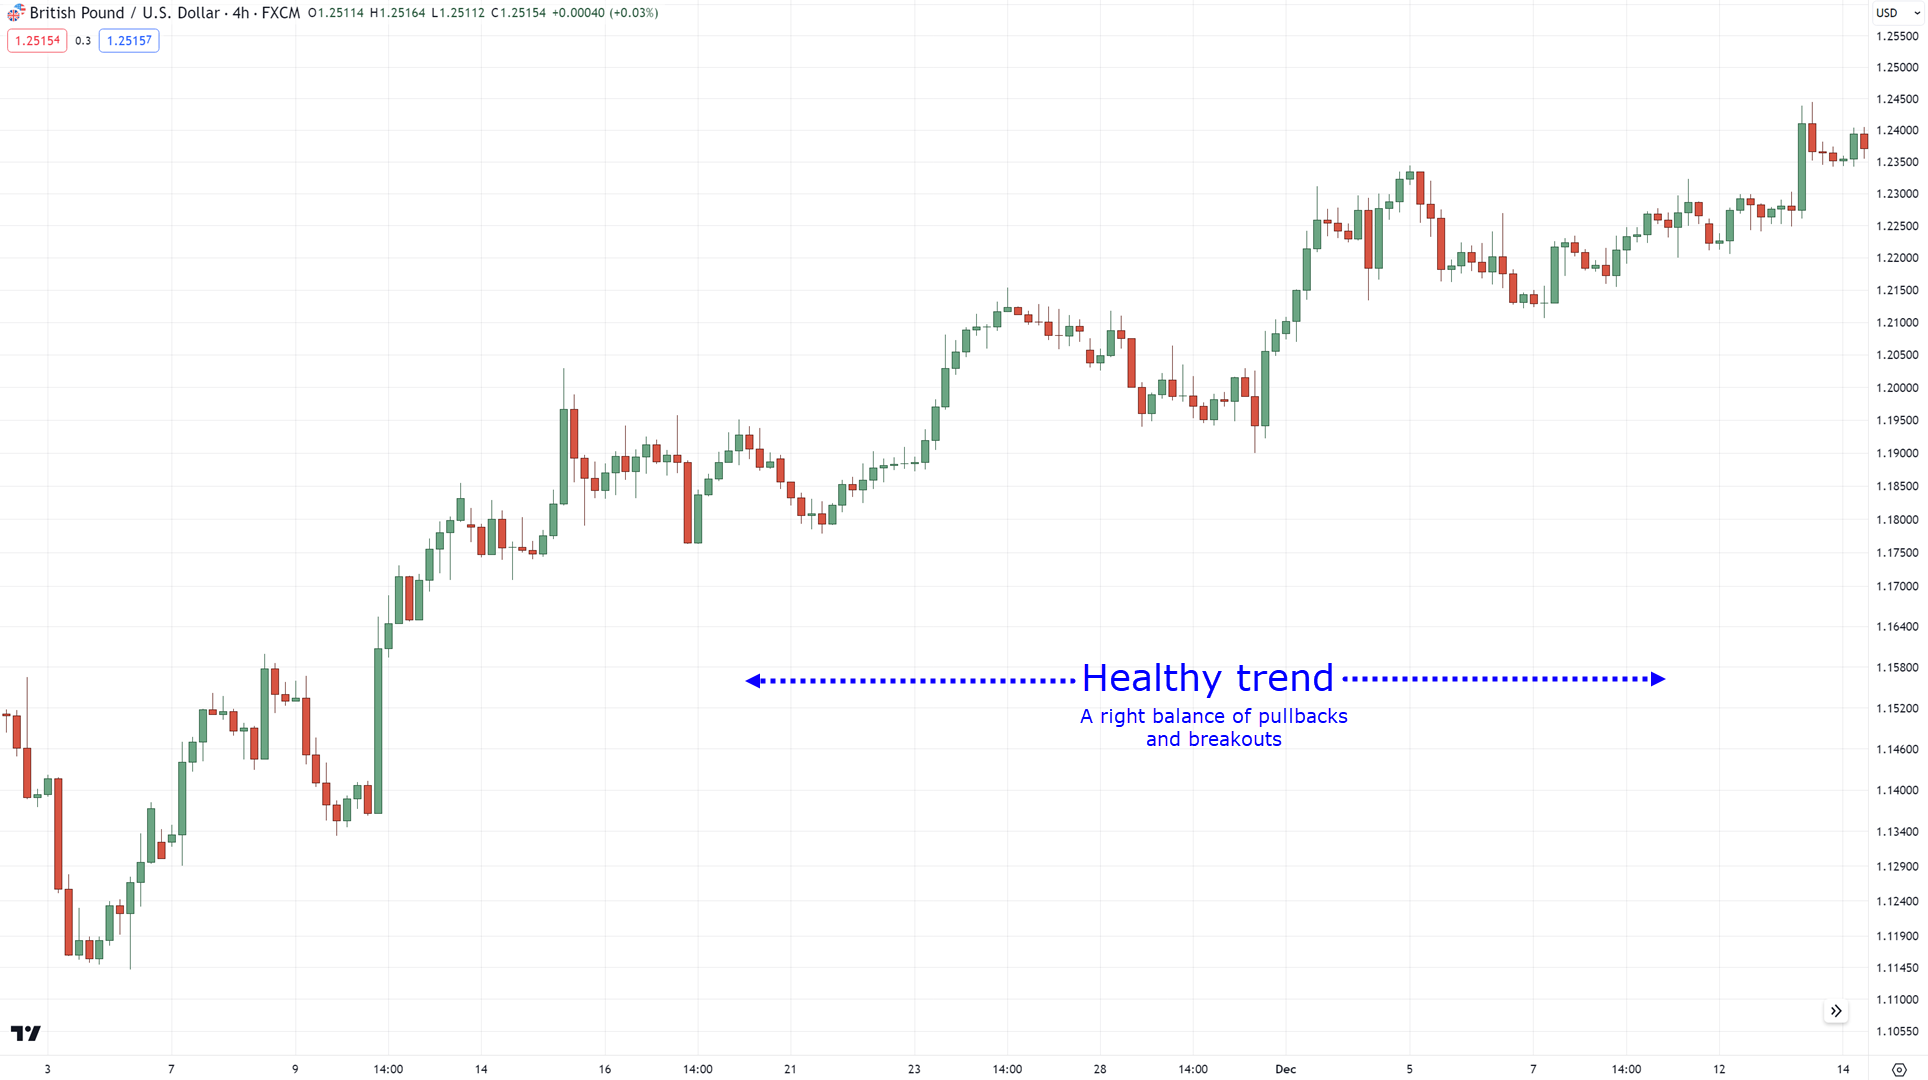
It depends on the type of trend you want to capture
Here is the truth:
Not all trends are equal.
There are strong trends:
Healthy trends:
And weak trends:
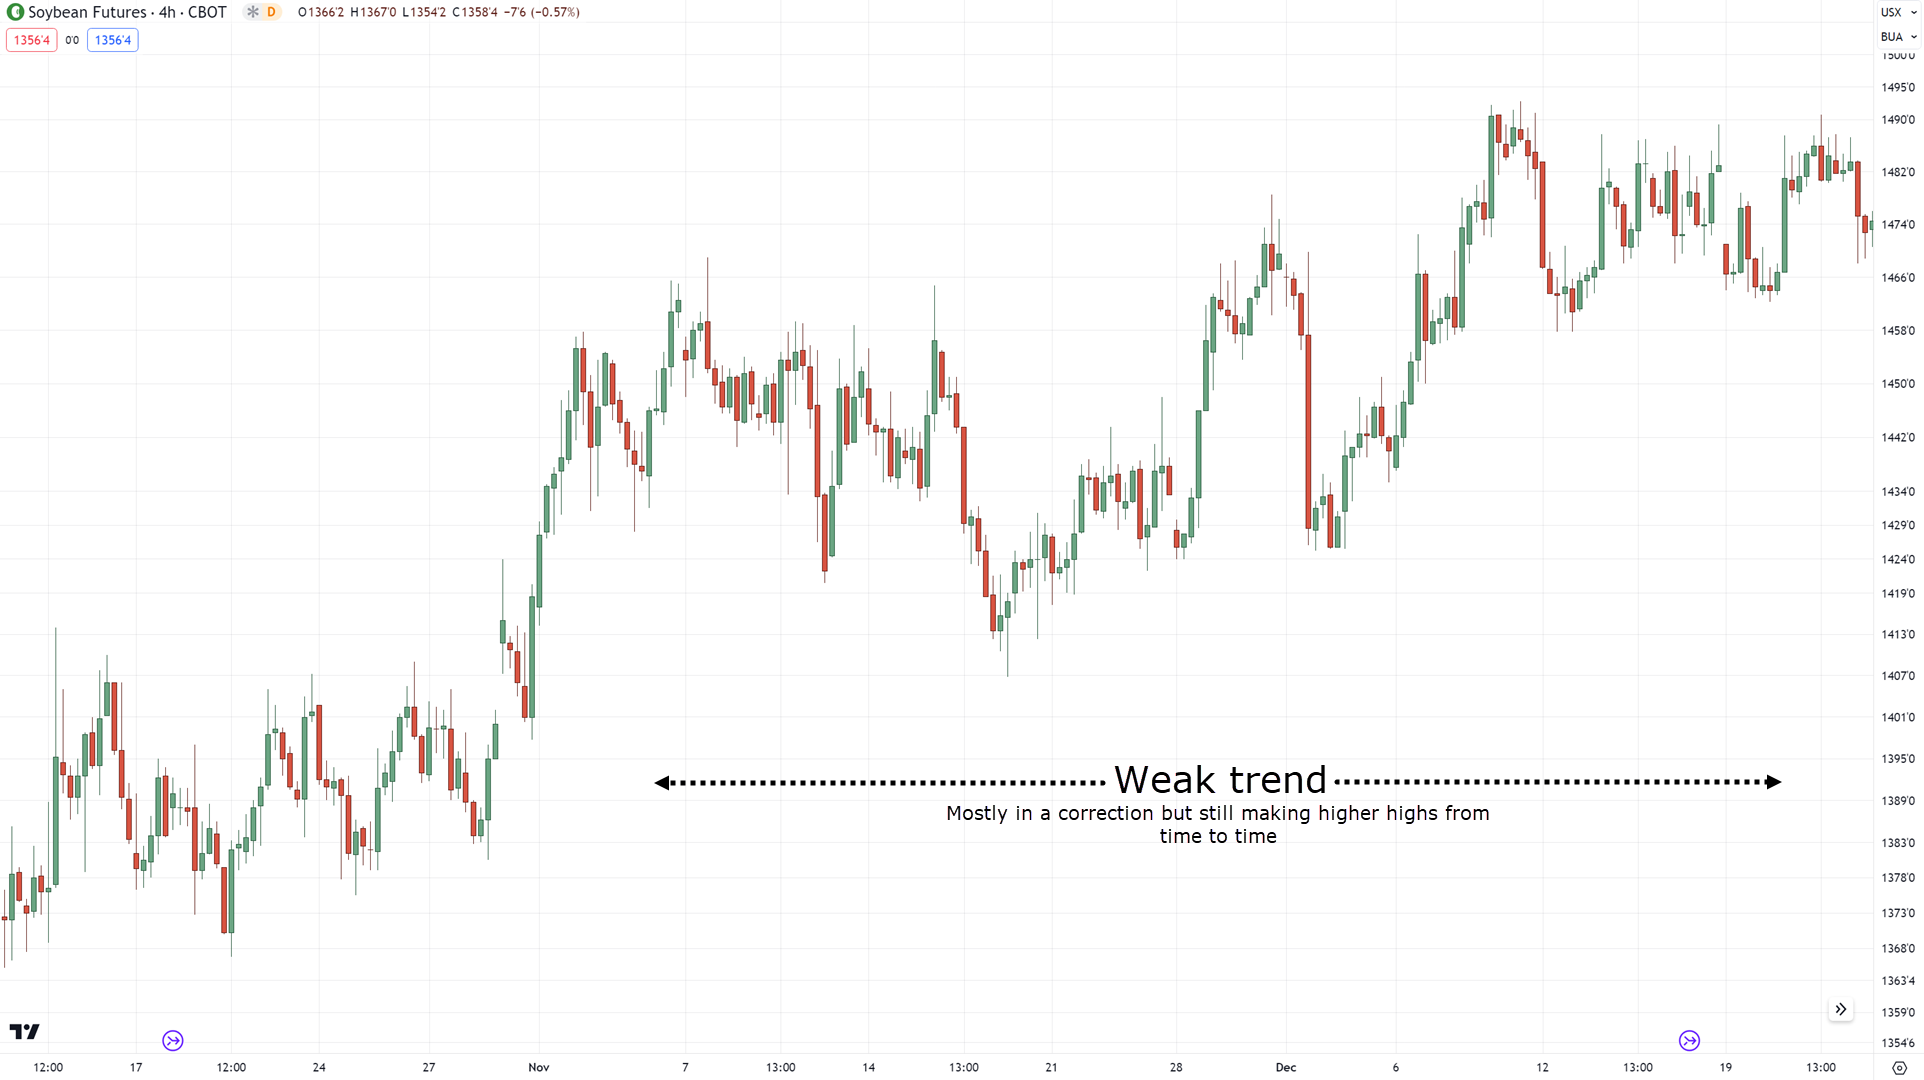
So, the goal is to identify the right period that would be relevant to the type of trend you want to capture!
P.S. I took the Donchian channel out of the example so you can use it as a reference moving forward.
This means that if you want to capture short-term trend reversals…
You’d want to use a 20 to 40-period Donchian channel.
For healthy trends, around 40 to 80-period.
Finally, for weak trends, around 80 to 200-period.
So, choose what type of trend you want to capture, (regardless of timeframe) and work yourself from there.
This is important.
Because this concept applies to all of the trend reversal indicators will discuss today.
With that said, are you ready for the next trend reversal indicator?
If so, then keep reading.
Trend Reversal Indicator #2: Zigzag Indicator
If you want a more practical trend reversal indicator then this is for you.
Because if you recall…
What makes a valid trend reversal is when the price makes two lower lows:

And do you know what the zigzag indicator does?
It practically visualizes it!
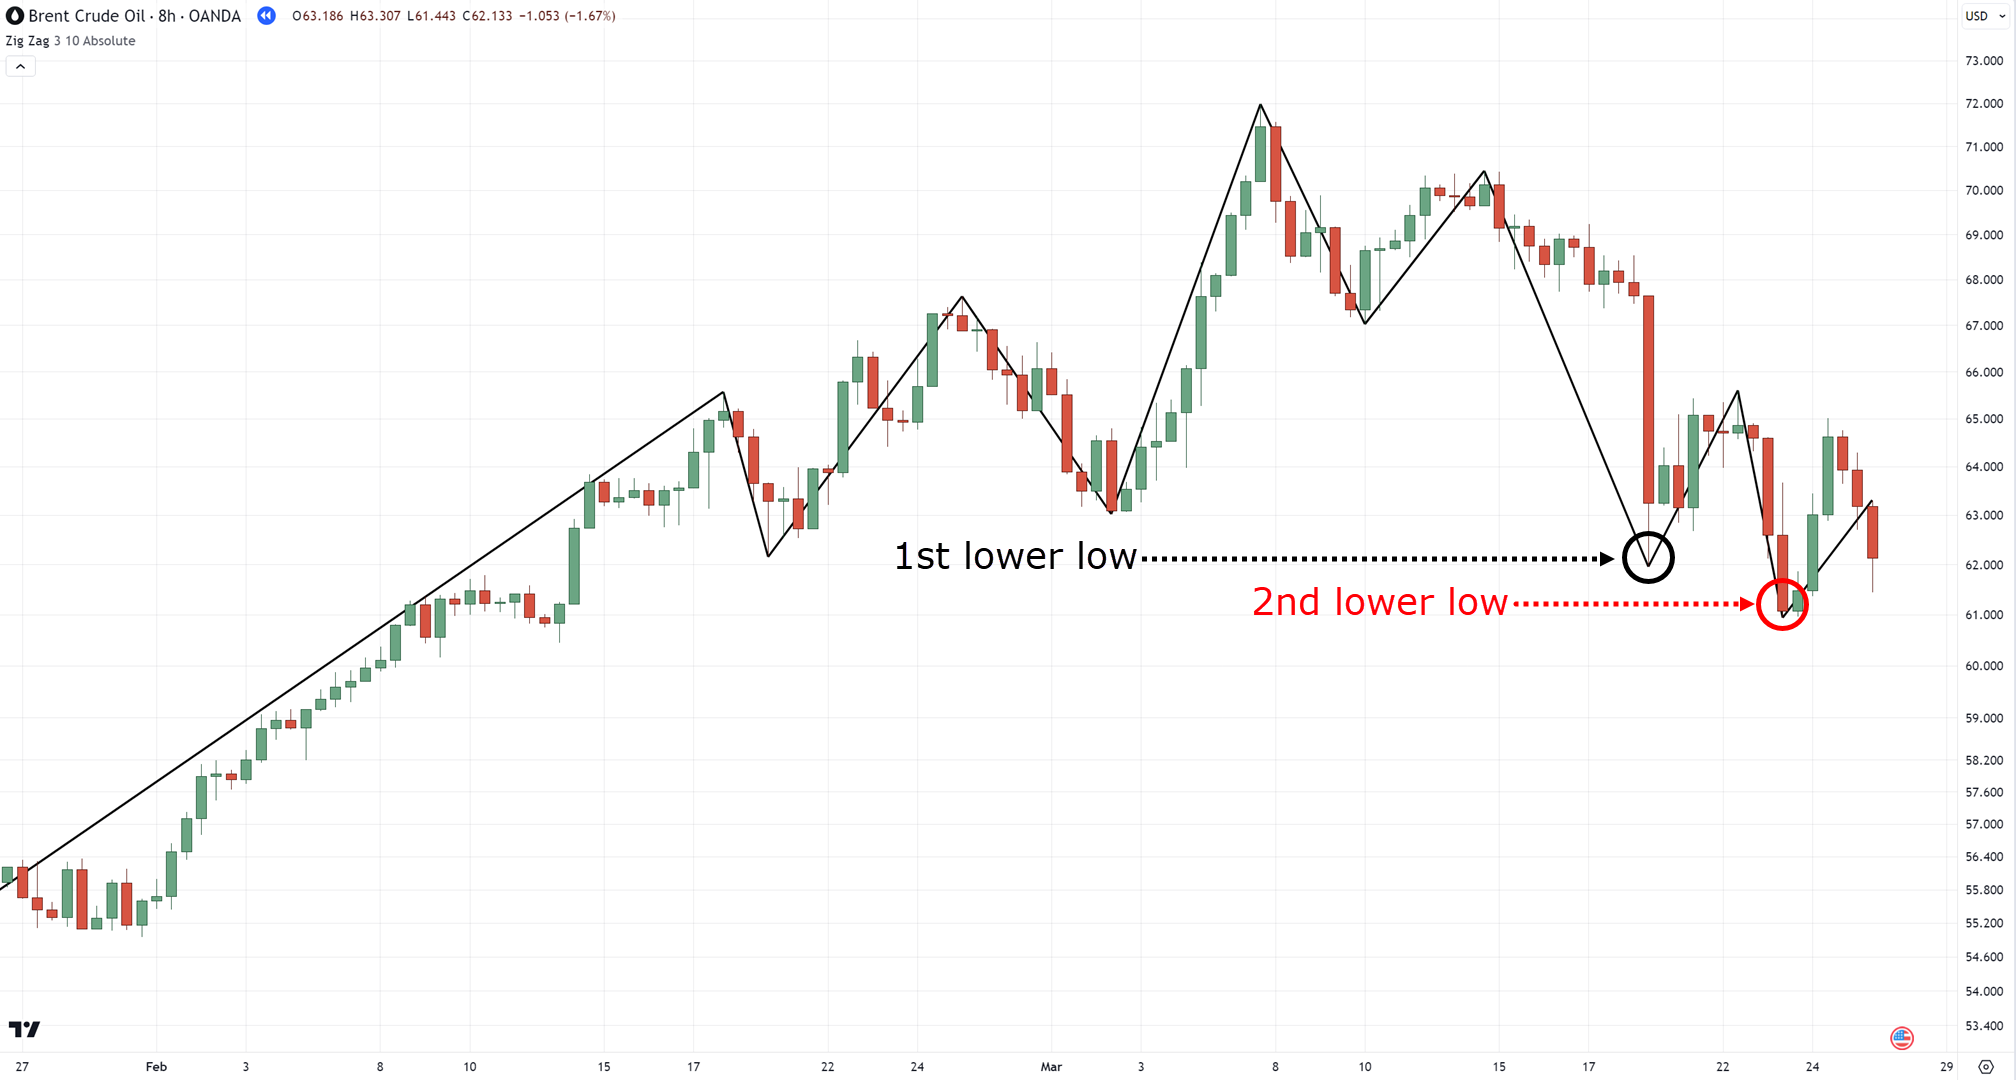
You never have to second-guess yourself again!
It’s all done for you automatically!
Oh, and by the way, this doesn’t count as the 1st lower low:
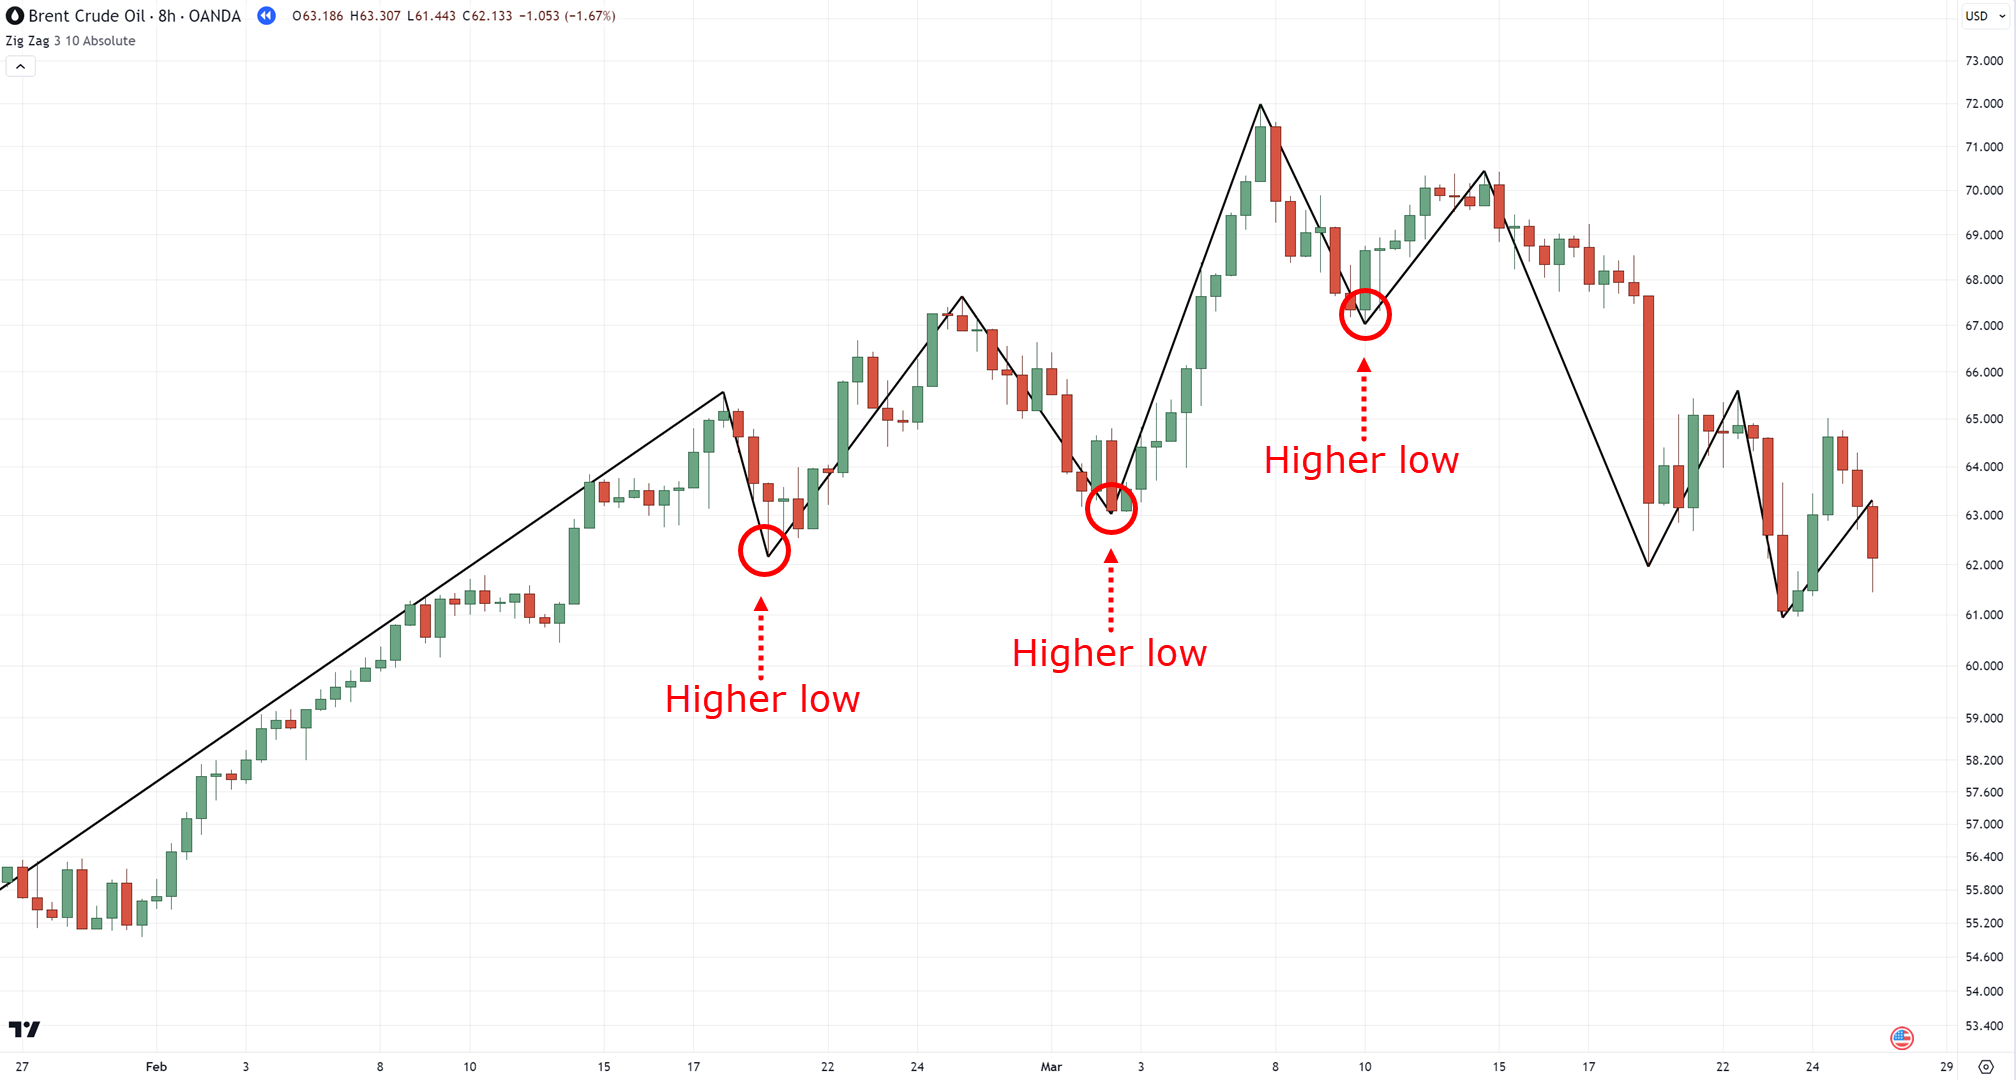
Why?
Because at that time, it was still considered as a higher low!
The only time it would be considered as a lower low is if it has exceeded the “previous low” as seen here:
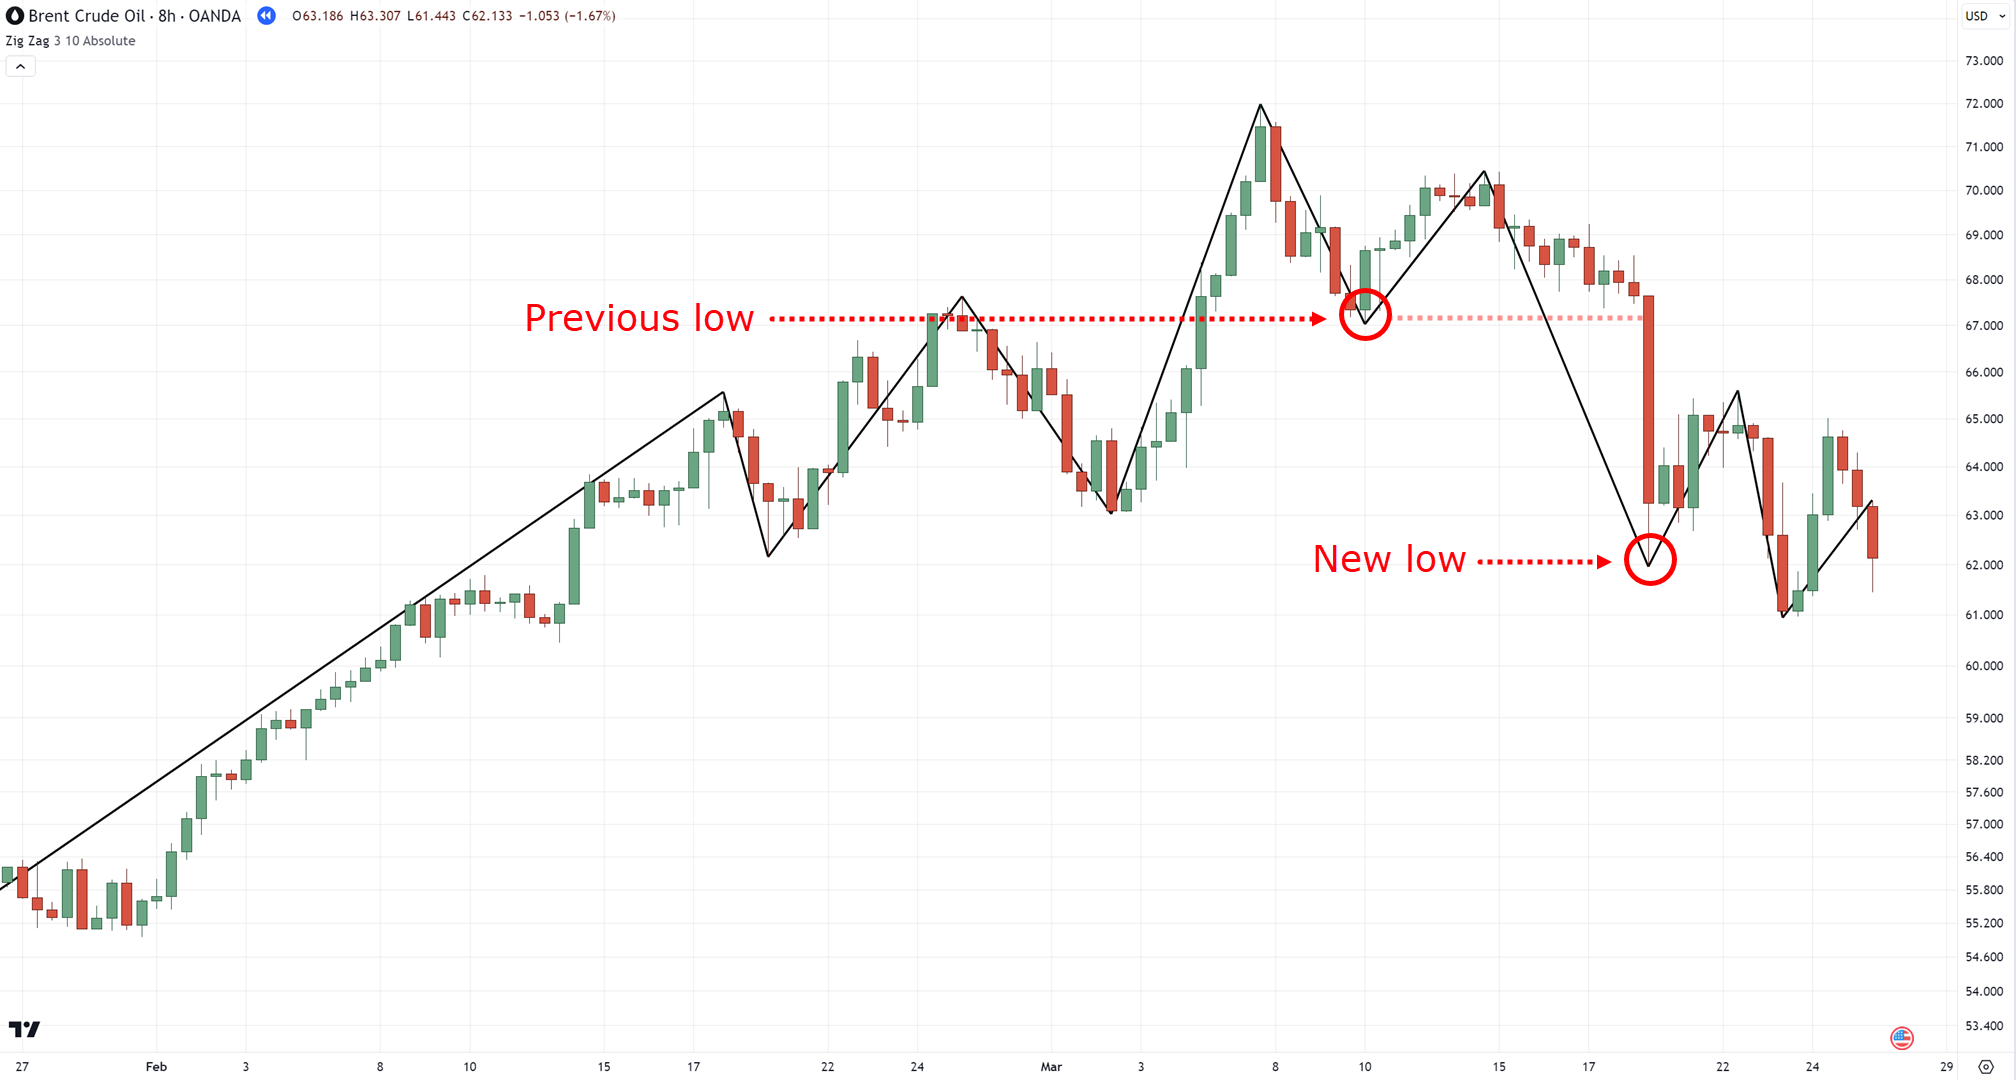
Just in case you’re still having a hard time you can check out this guide here.
So, how do you trade with this trend reversal indicator?
How to trade trend reversals with the zigzag indicator
For this one, it is quite simple.
You only have to wait for the price to close and make a 2nd lower low:
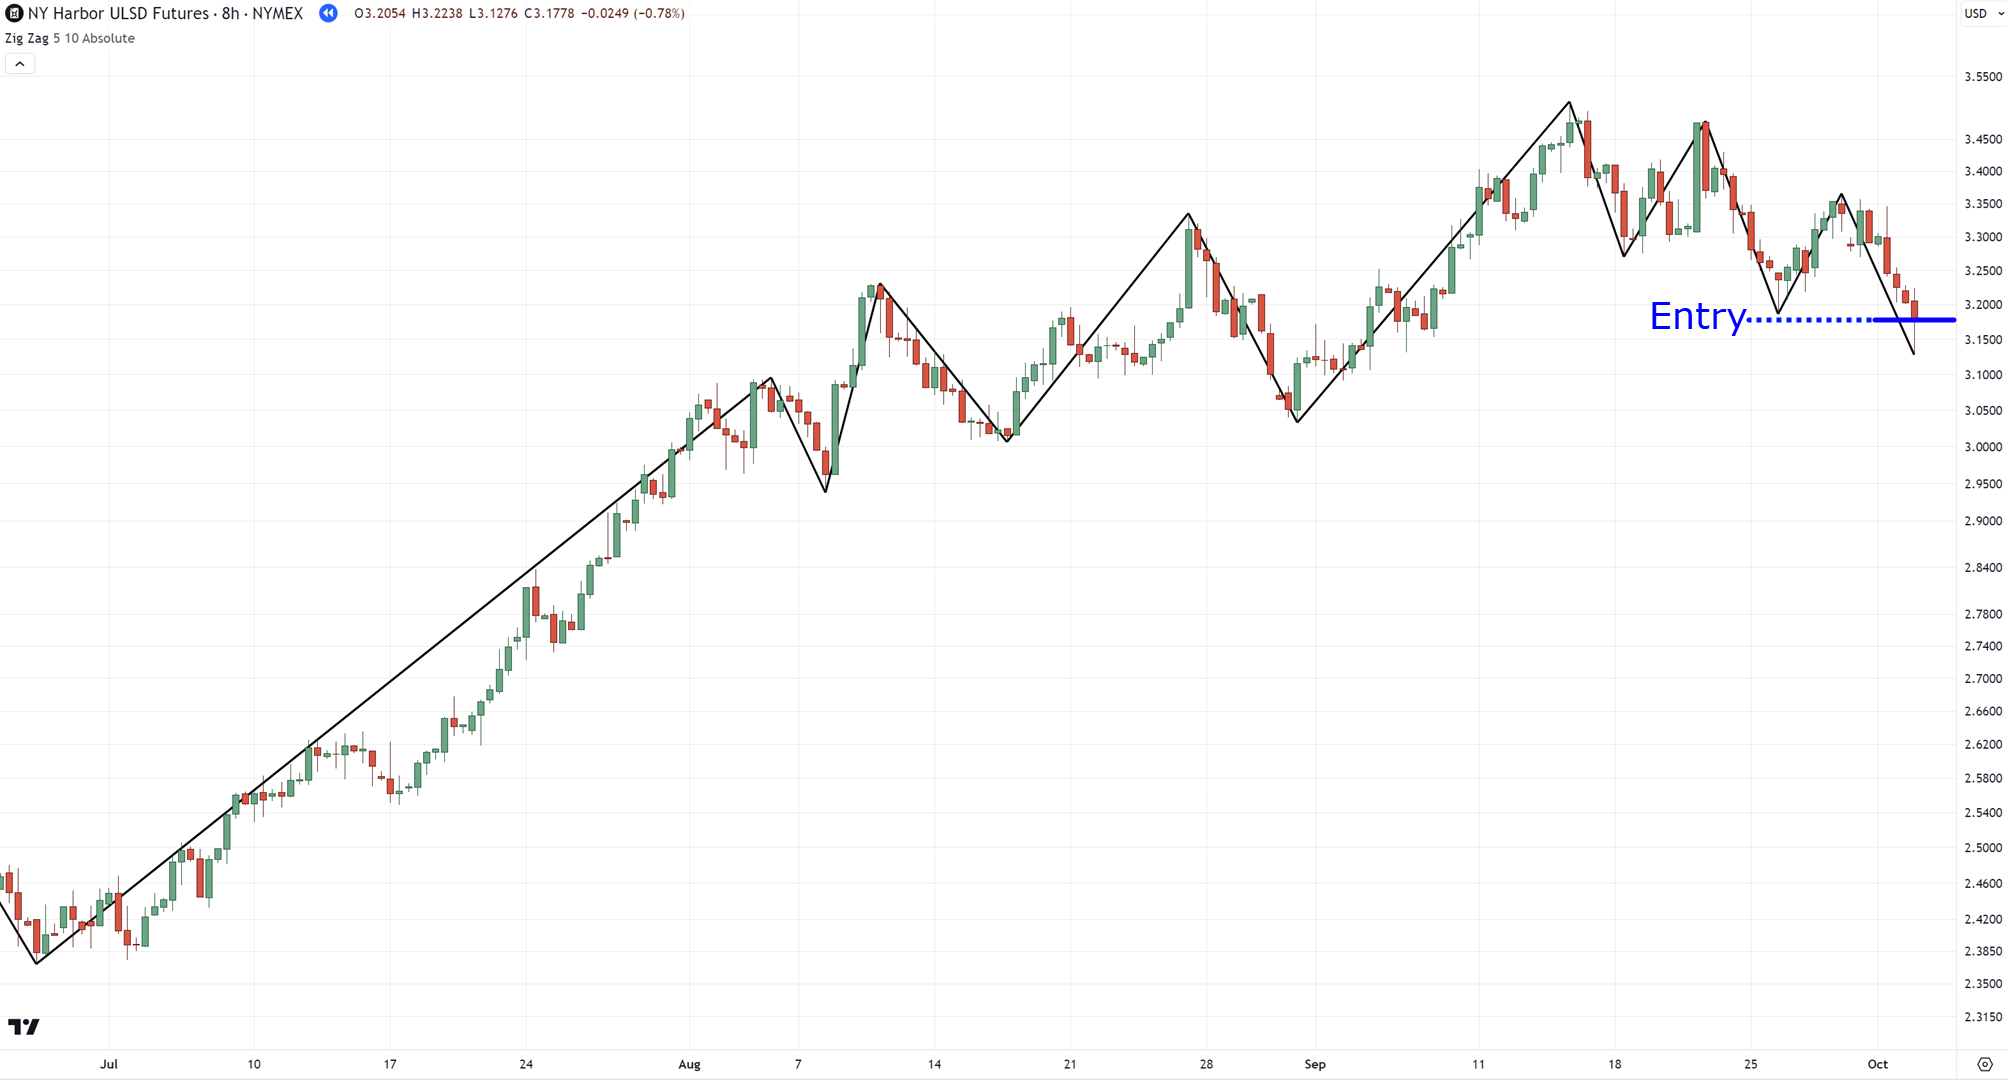
Sure, you can wait for a flag pattern to form just like in the last trend reversal indicator which is great.
However, if the price makes a second lower low, it’s already counted as a valid trend reversal with or without a flag pattern.
Pretty simple, right?
So where do we go from here?
For your loss, what you can do is add one ATR above the highs:
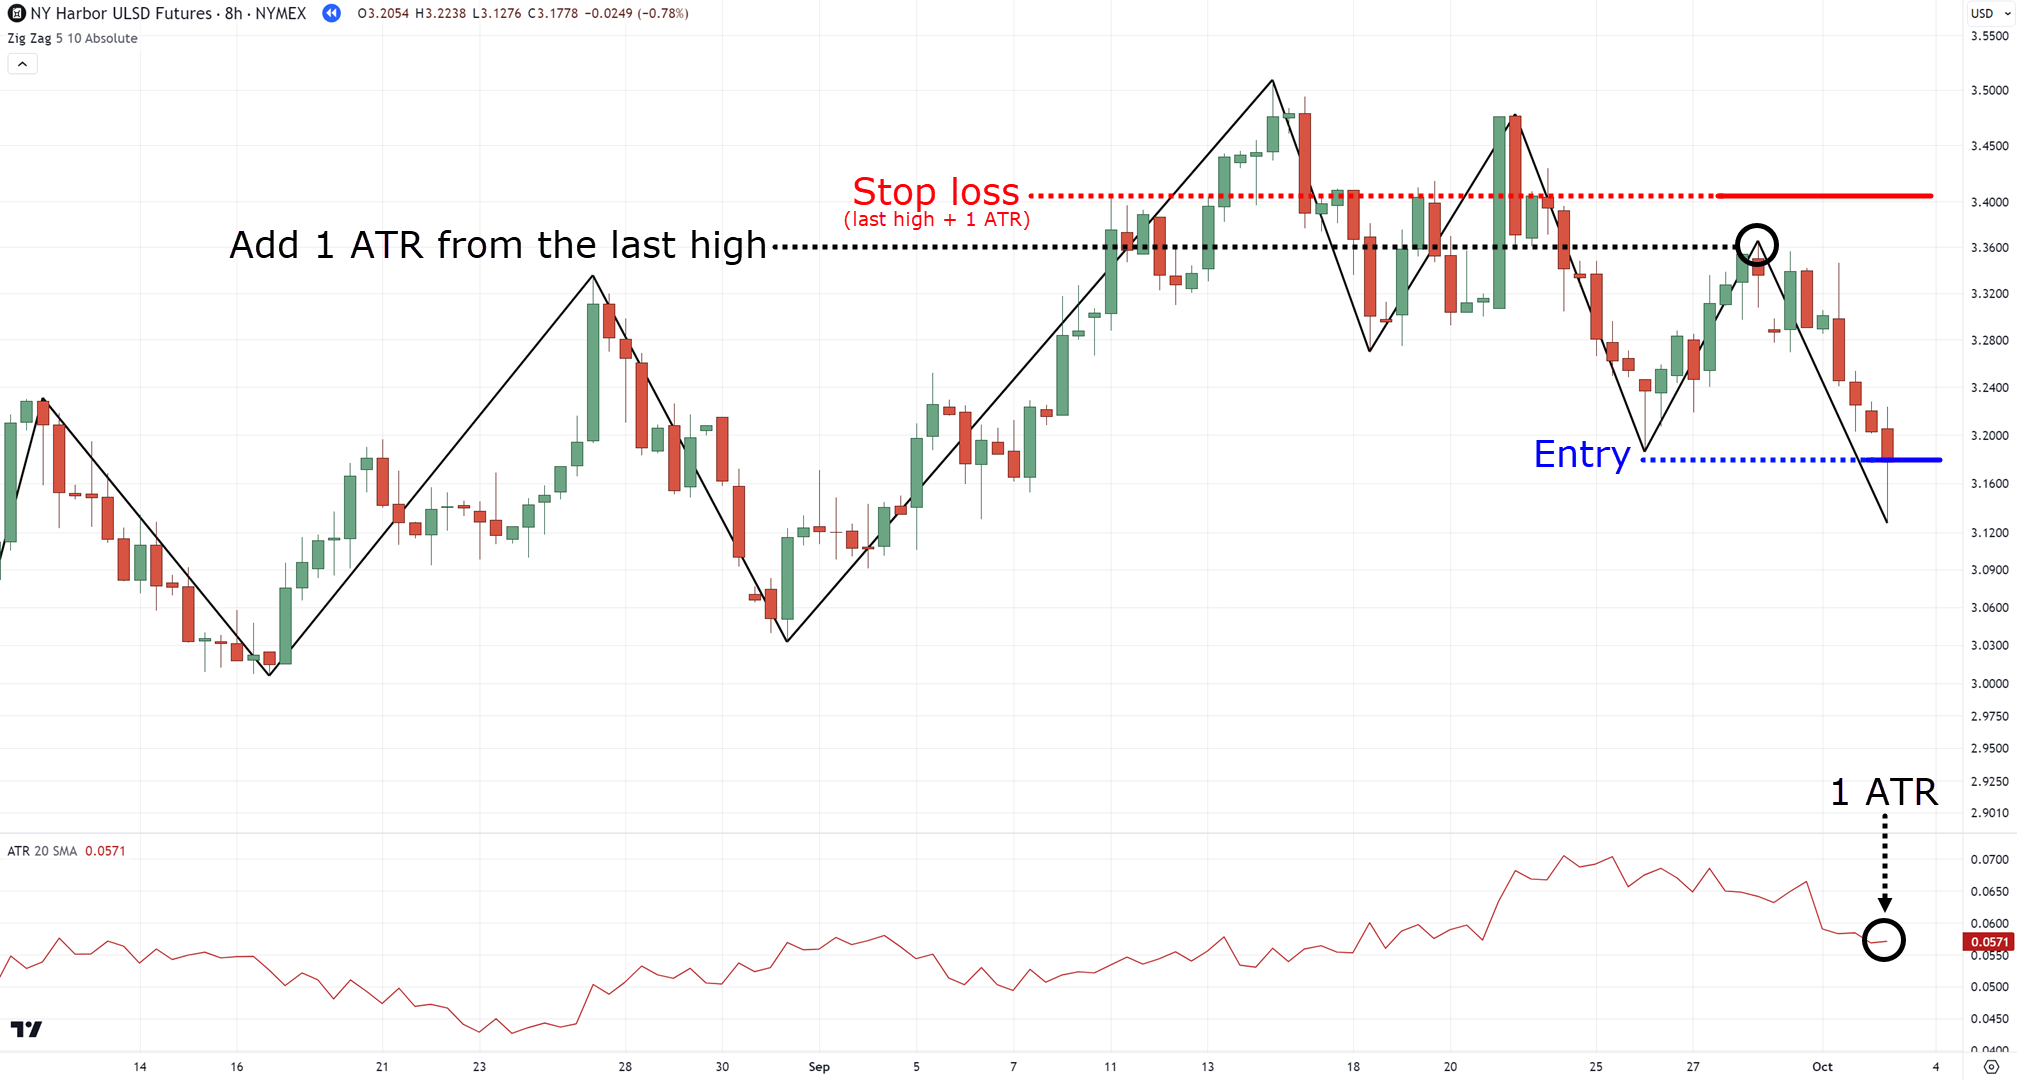
Ask for your take profits, you do have a couple of options!
The first option is to take profit before the nearest area of support:
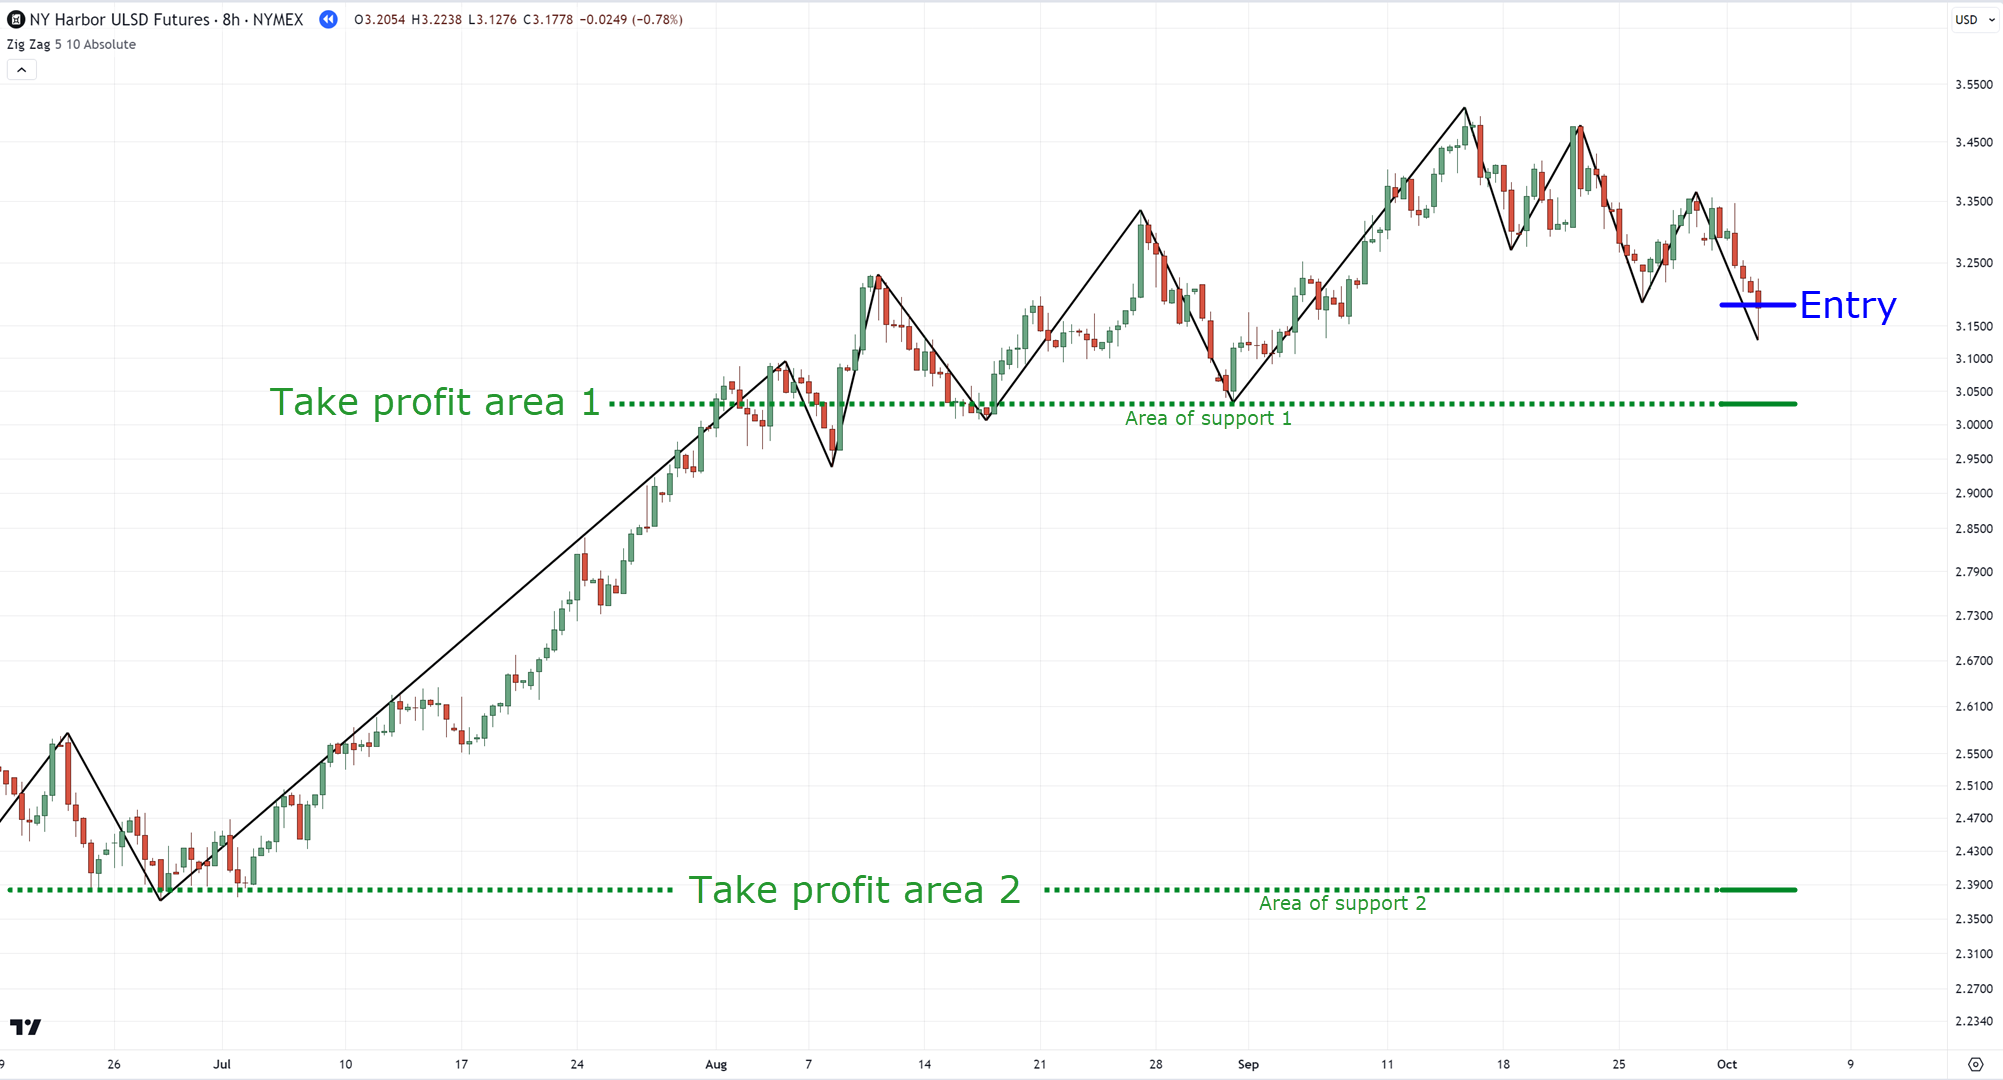
Or wait for a price to make the first higher high:
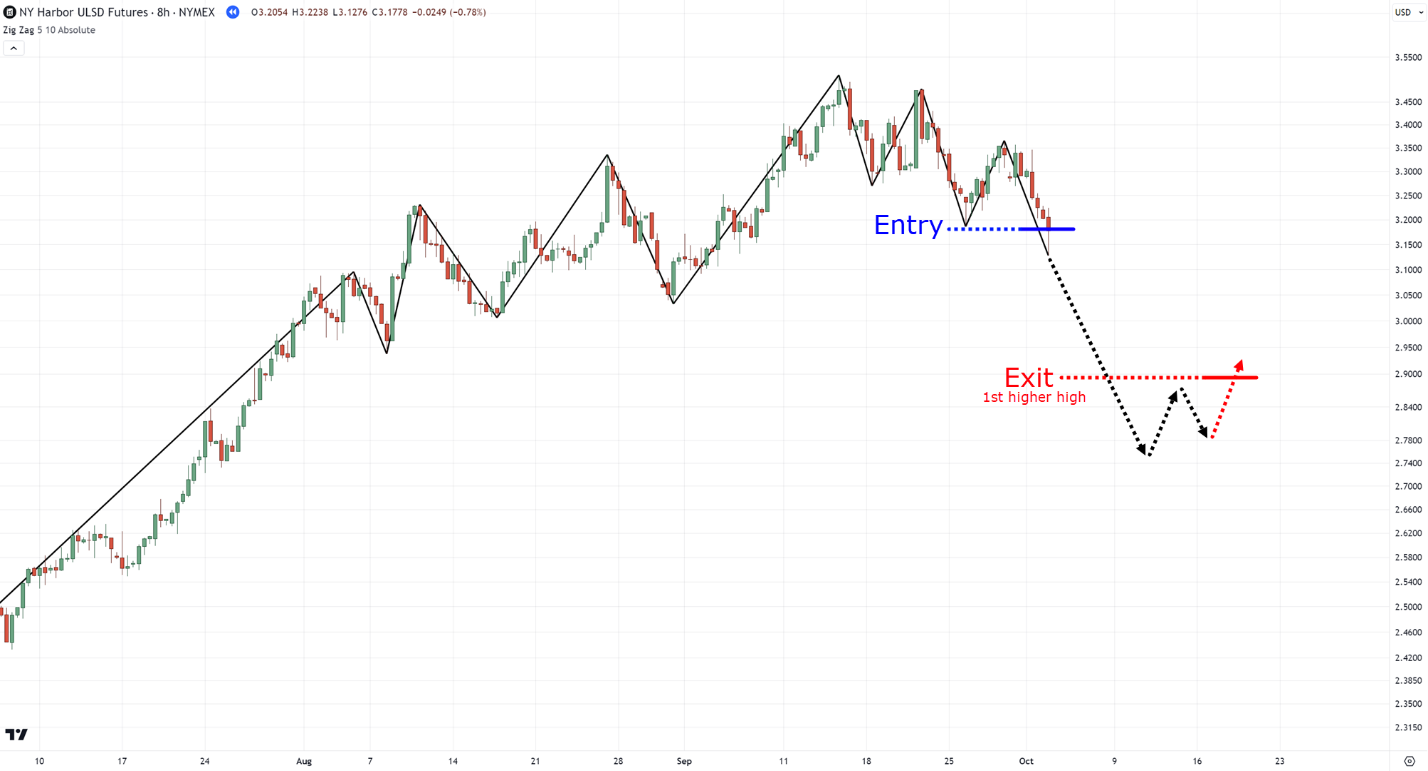
Now, I don’t want to show you the outcome of this trade as I don’t want you to form a bias on which profit method to use.
But either method does have an edge in the markets!
So how about the period?
Which setting to use for the zigzag indicator?
Unfortunately, it is not as simple as it seems.
As the period directly depends on what timeframe and market you are trading at!
Nonetheless, you can use the metrics below as a guideline:
Stocks on D1 = Deviation (%) 8 to 10
Futures on D1 = Deviation (%) 3 to 8
Forex on the D1 = Deviation (%) 1 to 3
If you want to learn more, those values came from this article here.
Sounds good?
And by the way…
If you want to learn more about the average true range, you can also check out this guide here.
Which I suggest you do.
Why?
Because the next trend reversal indicator is similar to the average true range, but with superpowers.
Let me share with you in the next section…
Trend reversal indicator #3: Supertrend indicator
Despite it being a trend indicator…
I would have to, unfortunately, rename this indicator to a Supertrend reversal indicator!
Because that is what we will be using this indicator for today.
This indicator is pretty simple!
Because it’s simply a visualized the ATR on your chart:
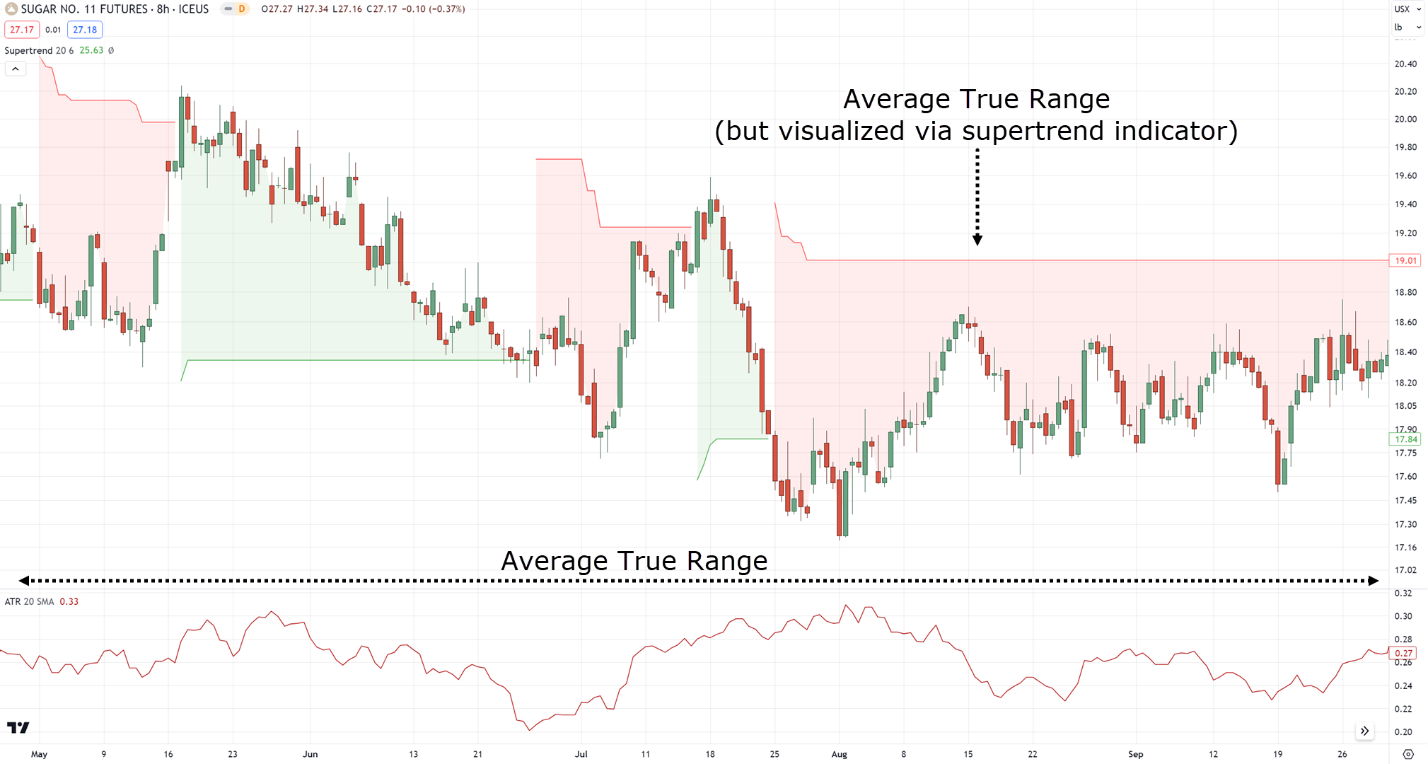
It simply adds a formula in a way that tells you if the trend has exceeded a certain volatility for it to reverse its signal.
If you are getting some hints right now, that’s right.
The moment the trend reversal indicator changes signal…
We are to enter the trade with our initial stop right at the indicator:
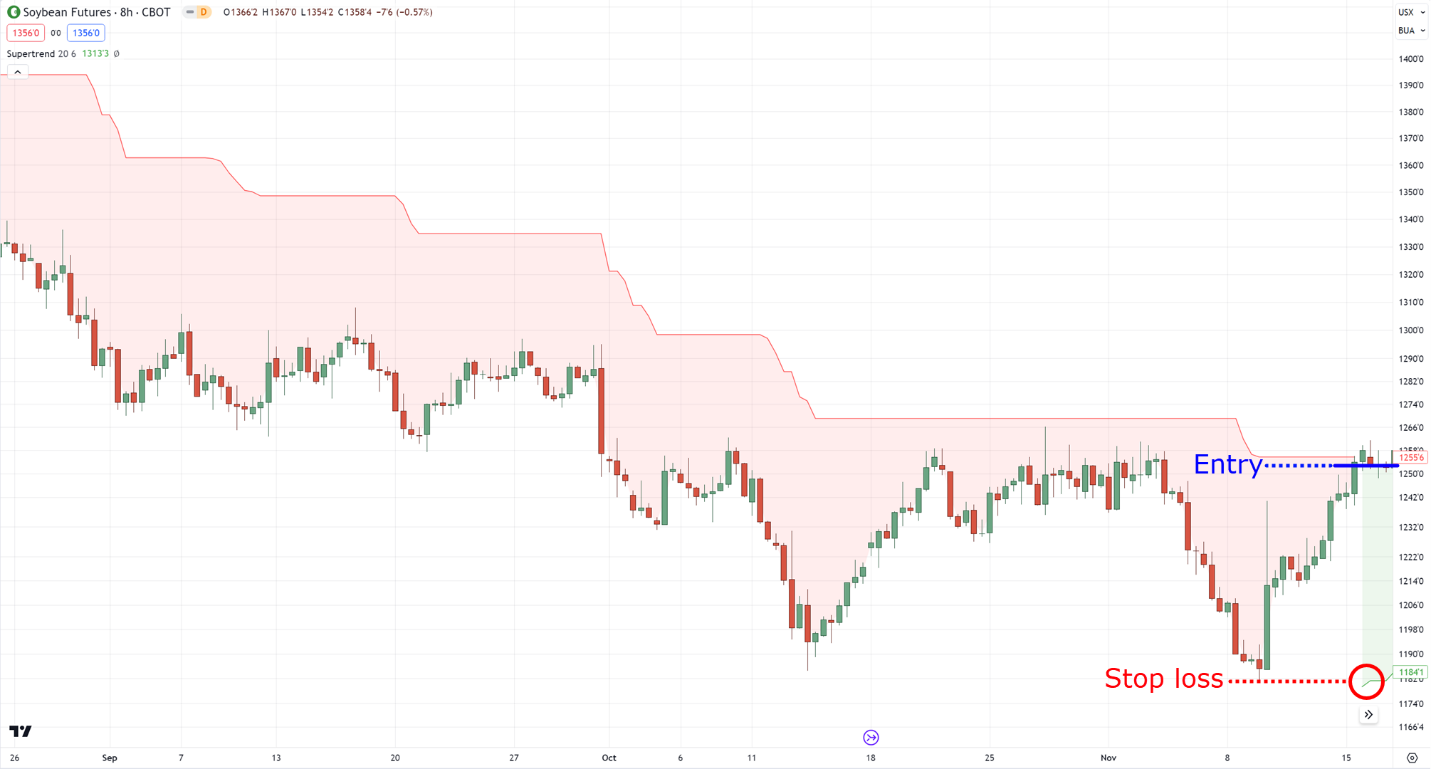
Pretty damn simple!
And take profits?
Simply wait for the indicator to switch signals again!
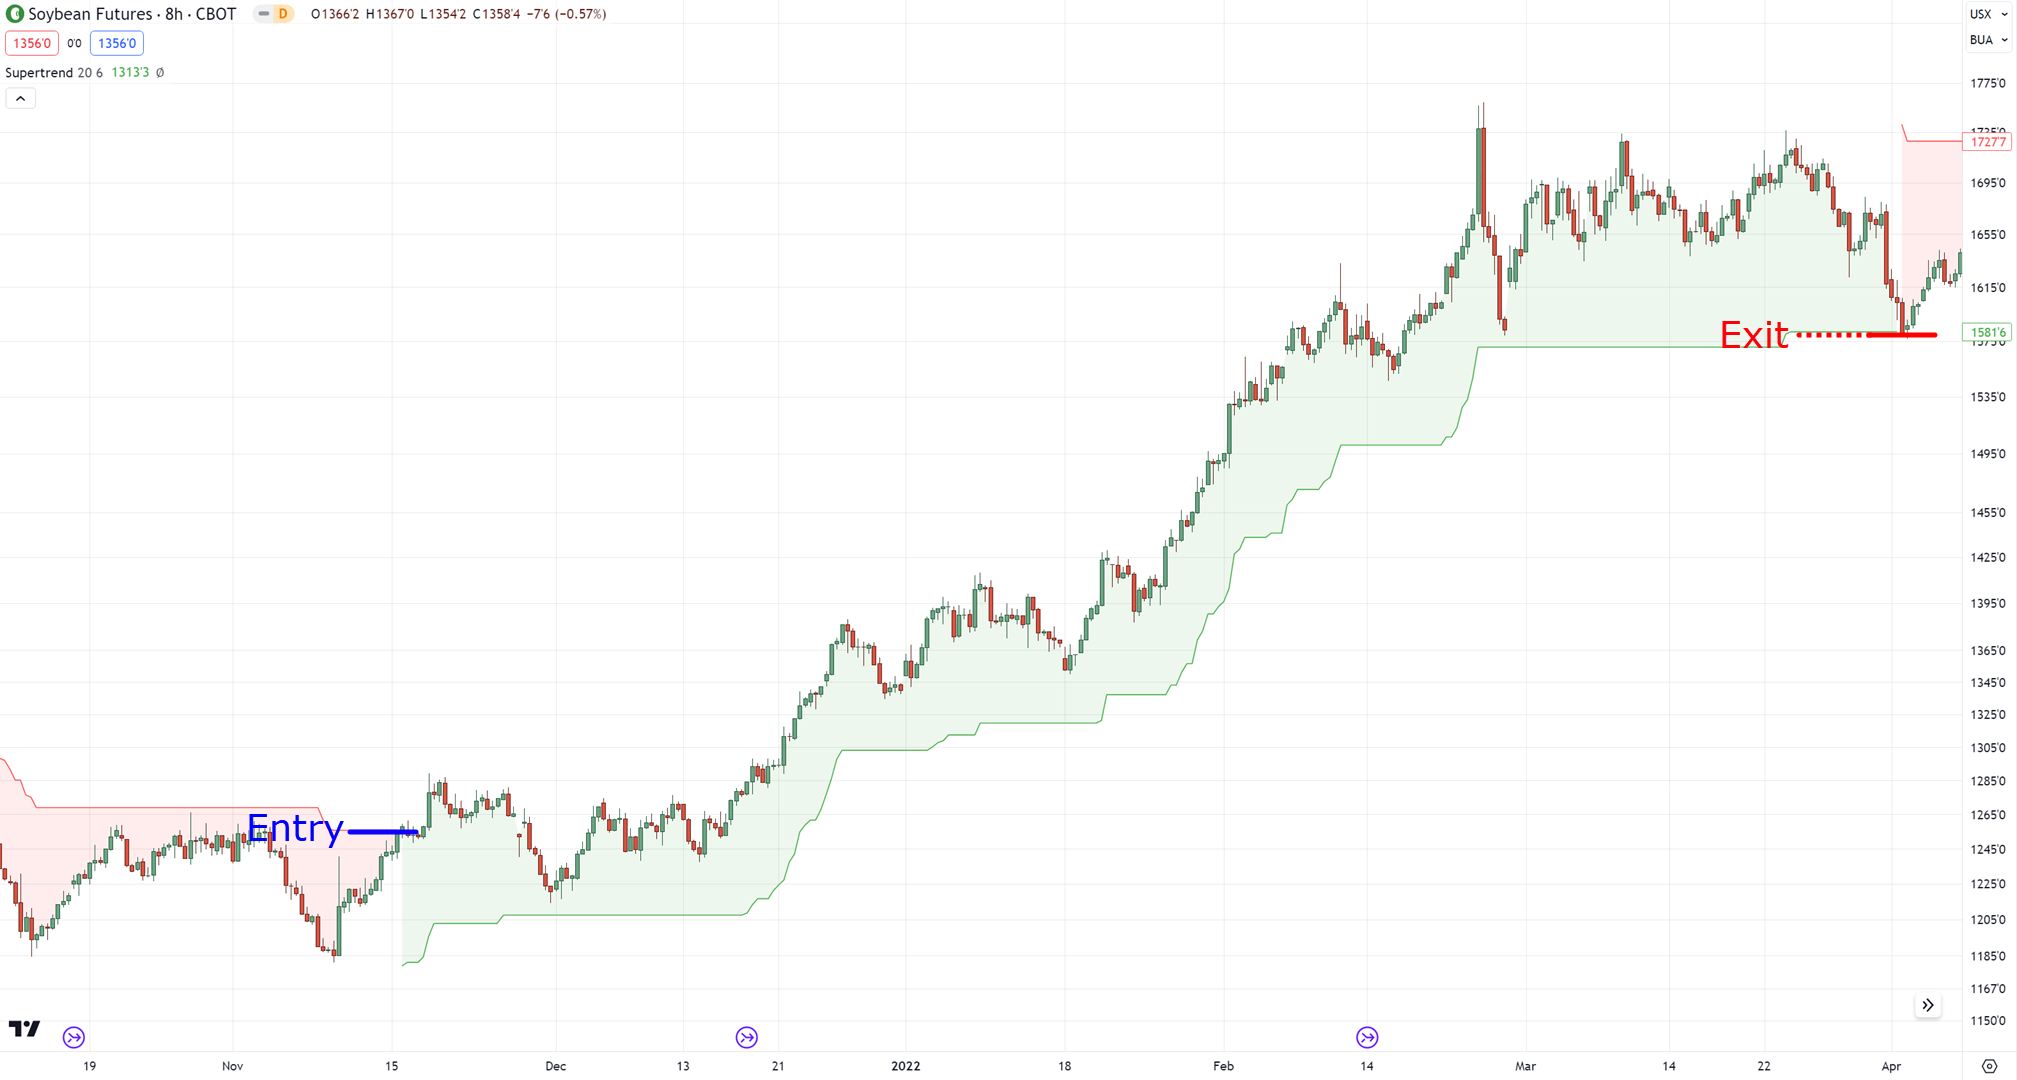
Now, due to the simplicity of this strategy, we are touching the realms of systematic trading.
So, backtesting this is crucial.
Nonetheless, to end this guide I’ll be sharing with you which settings to use for this trend reversal indicator.
Which settings to use for the Supertrend indicator
Similar to what we have discussed in the Donchian Channel…
It all boils down to what kind of trend reversals you are looking for.
If you are looking for trend reversals in a strong trend, then you want to use a multiplier of 2 ATR to 4 ATR.
For medium-term trend reversals, a multiplier of 4 to 6 would be good.
Finally, if you want to capture, long-term trend reversals, then a multiplier of 6 to 8 would be preferred:
Again, it’s not about choosing the best indicator settings out there…
But choose which kind of trend reversals you want to capture and look for an indicator setting that matches that.
Makes sense?
So, there you go!
Three trend reversal indicators that allow you to capture and trade trend reversals!
With that said…
If you want to learn more about the Supertrend indicator, you’d want to check this out.
Nonetheless, let’s have a conclusion on what you’ve learned today…
Conclusion
Now of course…
I’ve only shown you a cherry chart to show you concepts.
However, in the real world of trading, there will be losses.
There will be times of confusion where you are not sure, whether or not to take the trade.
And this is why it is crucial to backtest these concepts before risking your hard-earned money.
Got it?
With that said, here’s what you have learned today…
- A trend reversal is valid when the price closes and makes a 2nd lower low
- What makes a good trend reversal indicator is when it is easy to understand and accessible
- You can use the Donchian Channel to spot and trade trend reversals when it makes a flag pattern around its lower channel and using the upper channel as a trailing stop loss
- The zigzag indicator is a close-to-price-action indicator that automatically spots market structures for trend reversals
- The supertrend indicator is an ATR indicator but visualized on the chart, its simplicity gives you systematic trend reversal setups
Now over to you…
How do you usually trade trend reversals?
Do you use any indicators at all?
If so, which ones do you use to capture trend reversals?
Let me know in the comments below!


