Market Structure
The first part of this formula is what I call Market structure.
The concept is very simple.
What do you do in a given market condition?
If you think about this the market can only be in one of three market conditions either it’s in an uptrend, a downtrend, or range.
Uptrend Market
The market is said to be in an uptrend when you have a series of higher highs and higher lows. This is what I mean:
The market is heading up higher.
Let me ask you…
When you see the market in an uptrend, do you want to be a buyer or a seller?
It’s a logical question.
The answer is you want to be a buyer.
Because when the market is in an uptrend and you’re a buyer.
Your upside potential is a lot higher.
Look at the magnitude of the up move when the market is in an uptrend.
If you look at this:
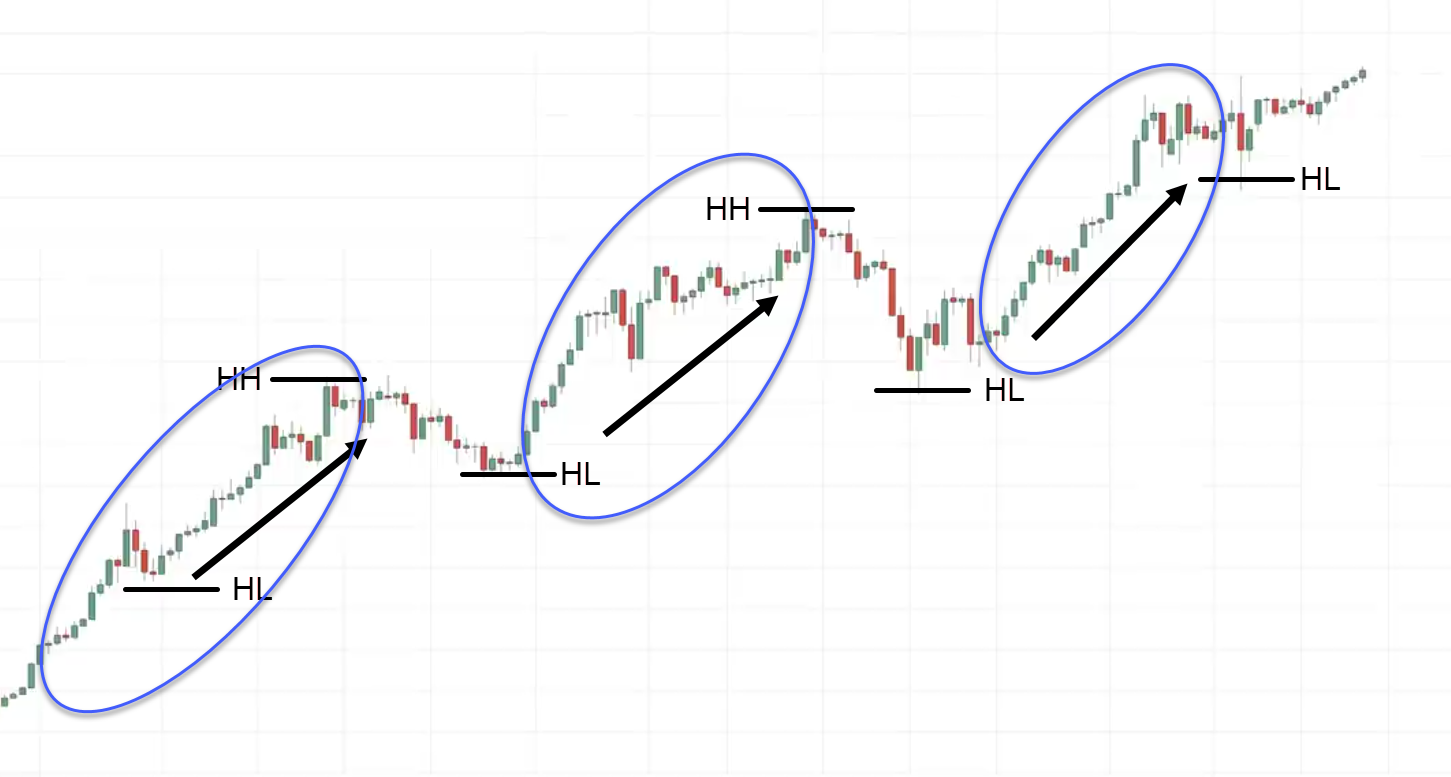
When the market goes up. There is a huge upward movement
You can see the potential that the market would move in your favor when you are a buyer in an uptrend.
If you think about this if you are a seller.
The potential that the market would move in your favor is smaller. Here’s what I mean:
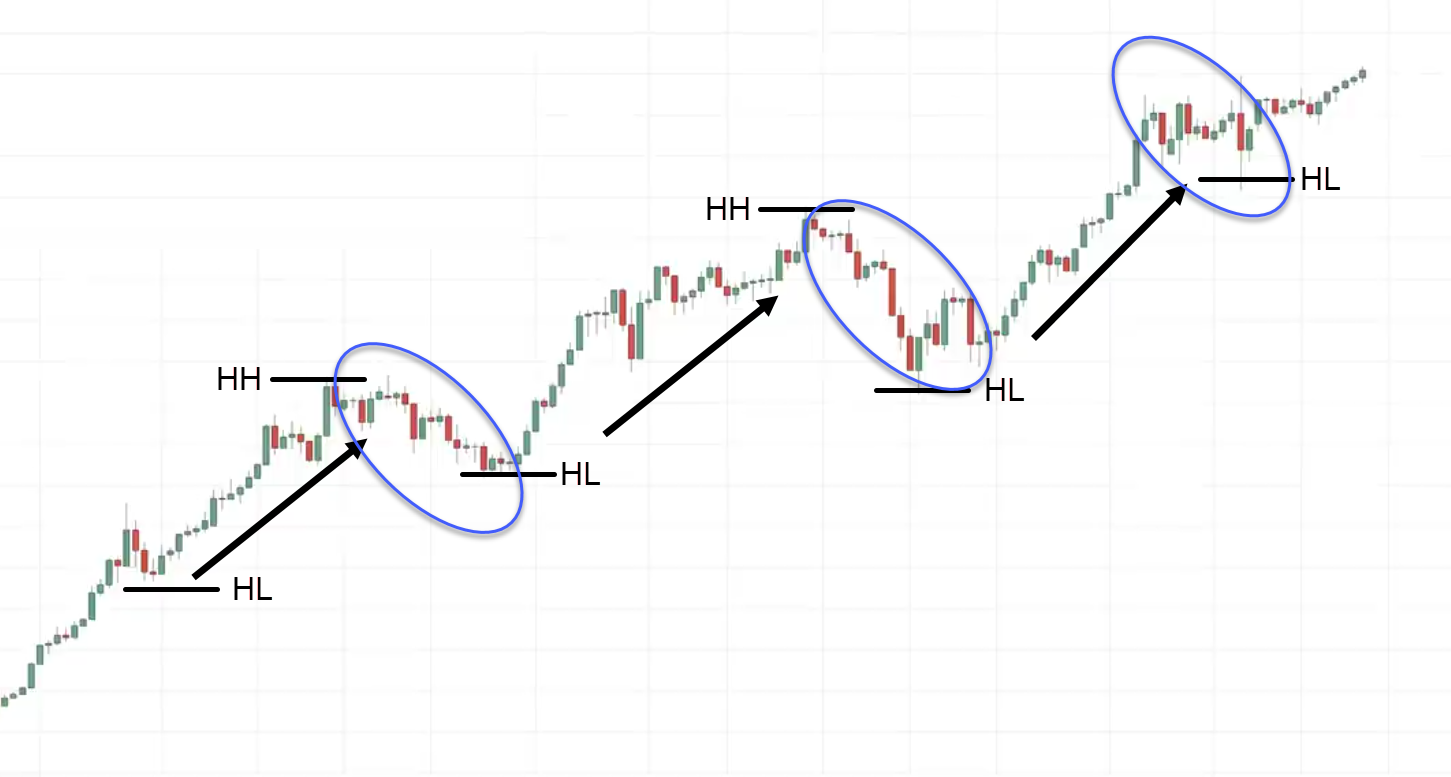
This is why in an uptrend, as much as possible you want to look for buying opportunities.
Downtrend Market
This is just the inverse.
In the downtrend, you’ll notice that the price makes a series of lower highs and lower highs.
Here is an example:
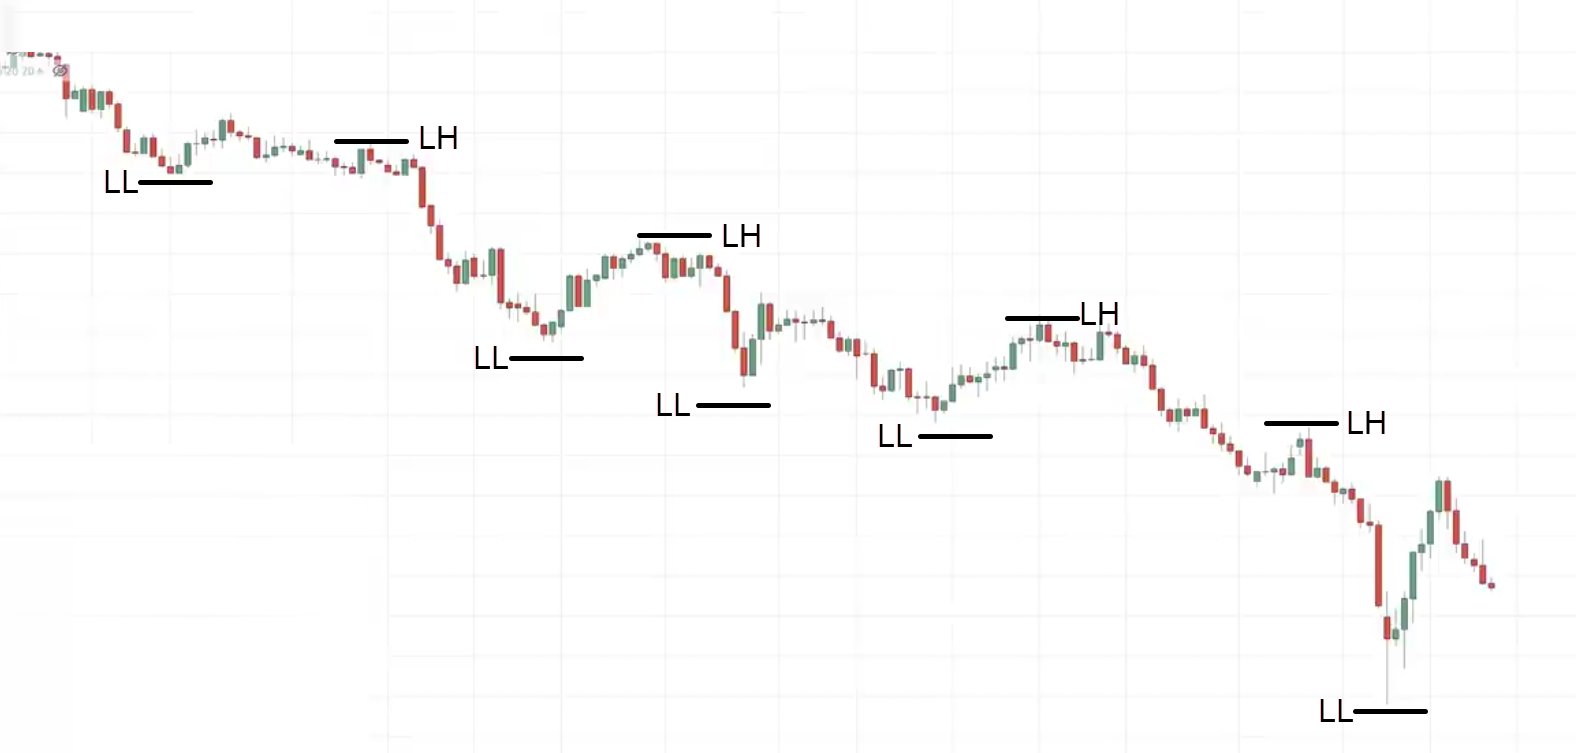
The market is heading down.
One thing about the market is that it doesn’t go down in one straight line.
It makes a pullback and goes down lower.
In a downtrend you want to be a buyer or seller?
You should be a buyer… Just kidding!
You should be a seller.
I look for selling opportunities because again the concept is the same if you are selling in the downtrend look at the profit potential.
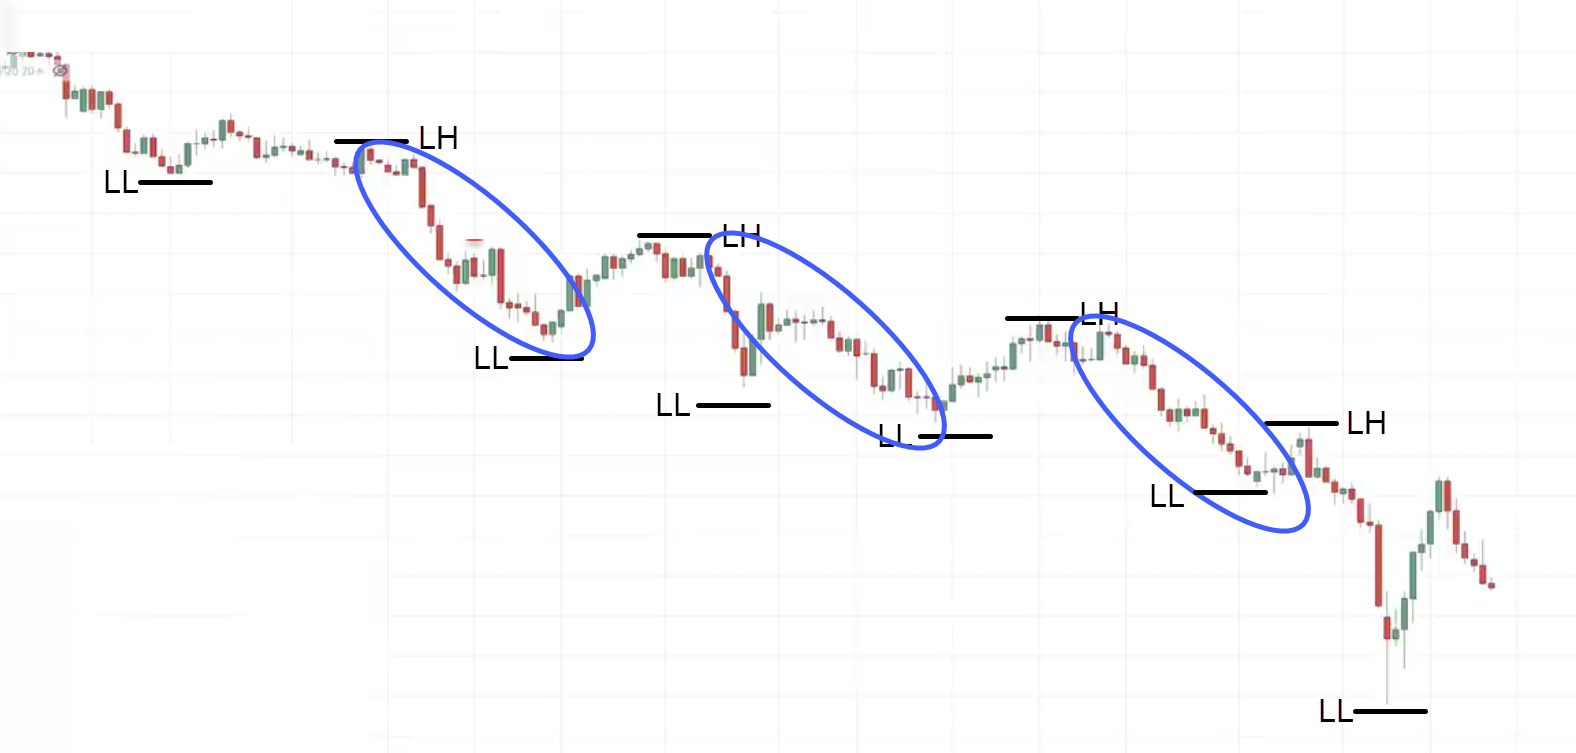
This is the amount of profit potential that you could get towards the downside.
This is the magnitude of the move that you can expect compared to buying in a downtrend.
You look at the profit potential if you’re a buyer in the downtrend:
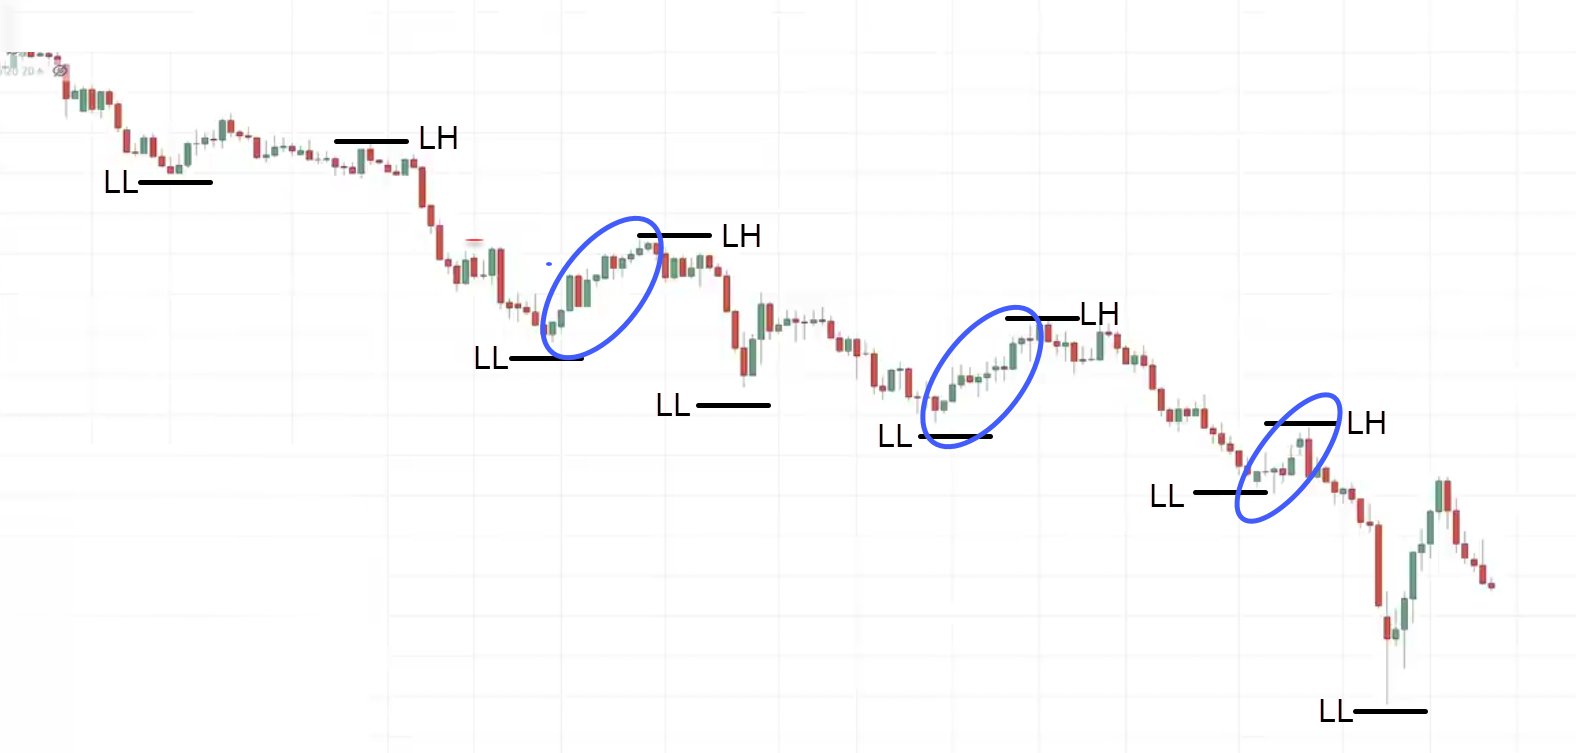
This is the move that you could get.
The move is a lot smaller compared to the downward momentum.
Range Market
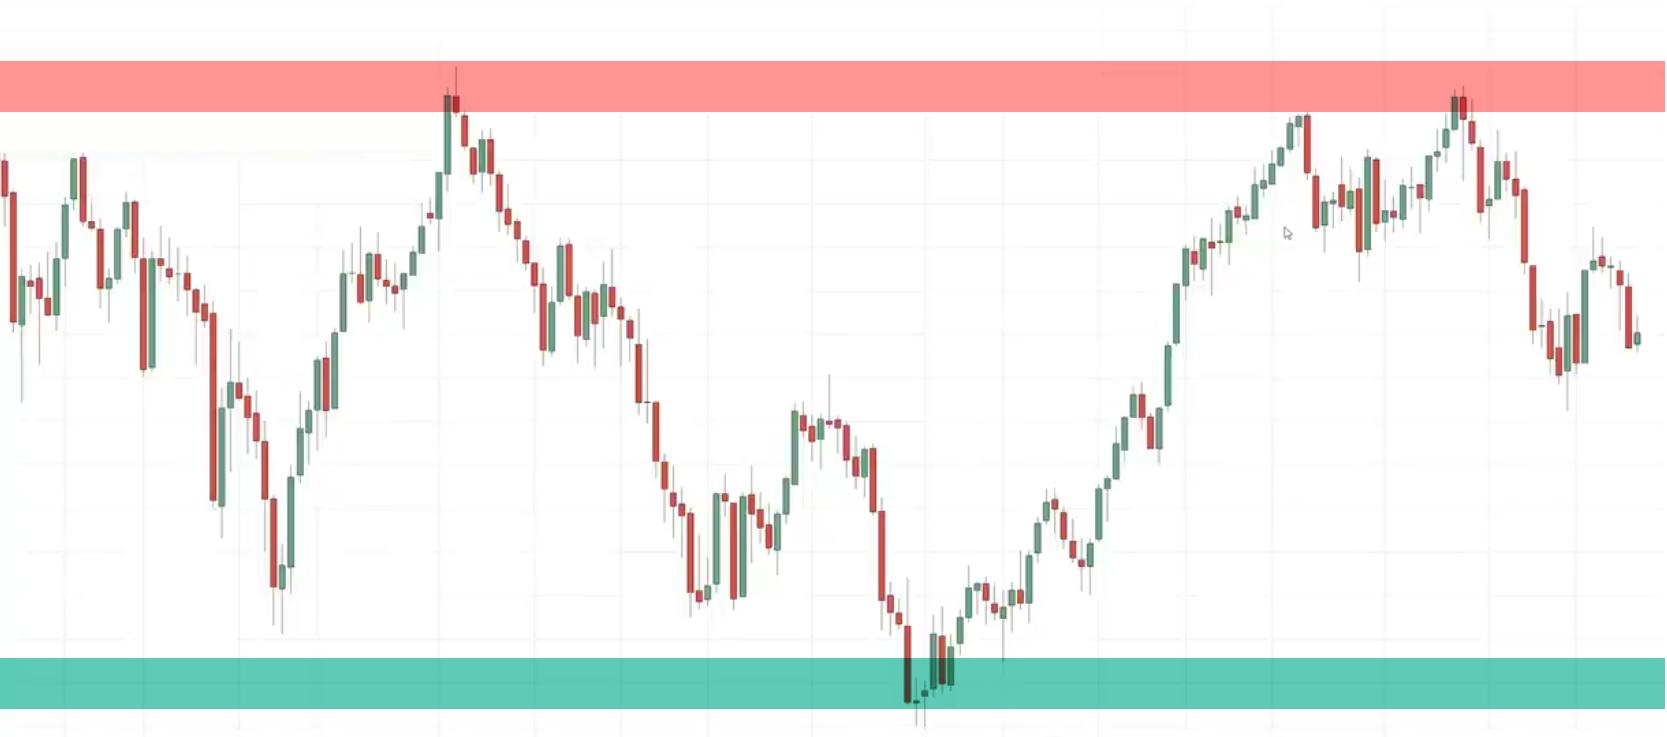
This is when the market is just contained between the highs and lows.
This is what I mean:
Let me tell you a secret…
When the market is in a range, I don’t just randomly buy the lows of support or sell the highs of resistance.
In other words, I don’t simply blindly buy or sell over here:
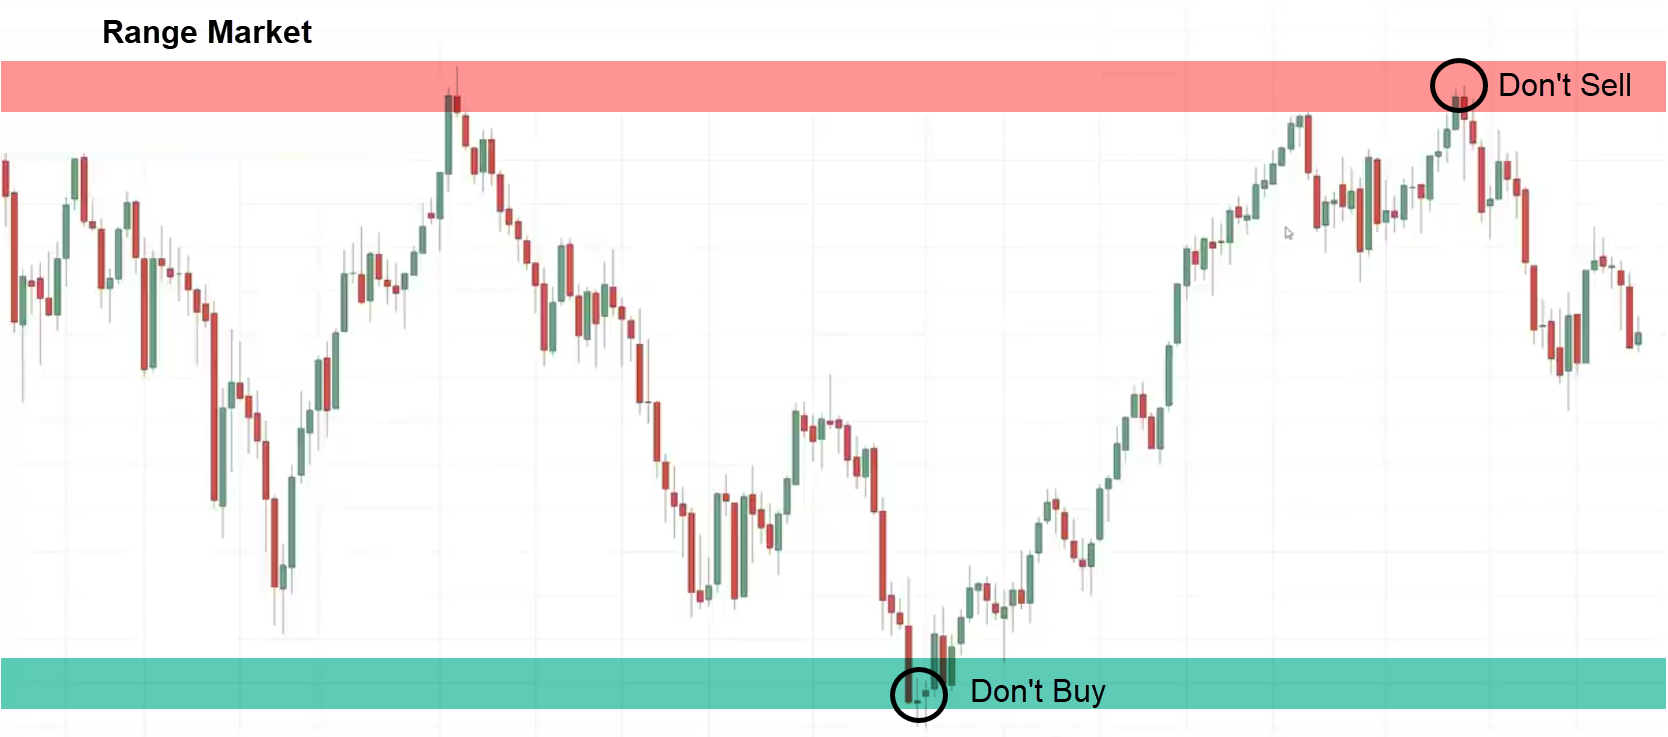
What I do is that…
I still will take a direction when the market is in the range.
Sometimes, I might look to buy at support in the range market and sometimes I would prefer to sell at resistance in a range market.
I’ll explain to you shortly why I have this particular habit and you’ll discover why.
You have to be adaptable and flexible.
The Market structure will give you a framework to know when to buy when to sell and maybe even when to stay out of the markets.
Area of Value
Uptrend
Where on the chart do you buy or sell?
You can use a very powerful technique or concept called support and resistance.
Let me explain…
Support is an area on the chart where buyers could come in and push the price up.
Resistance is an area on the chart where sellers could come in and push the price down.
Here is an example:
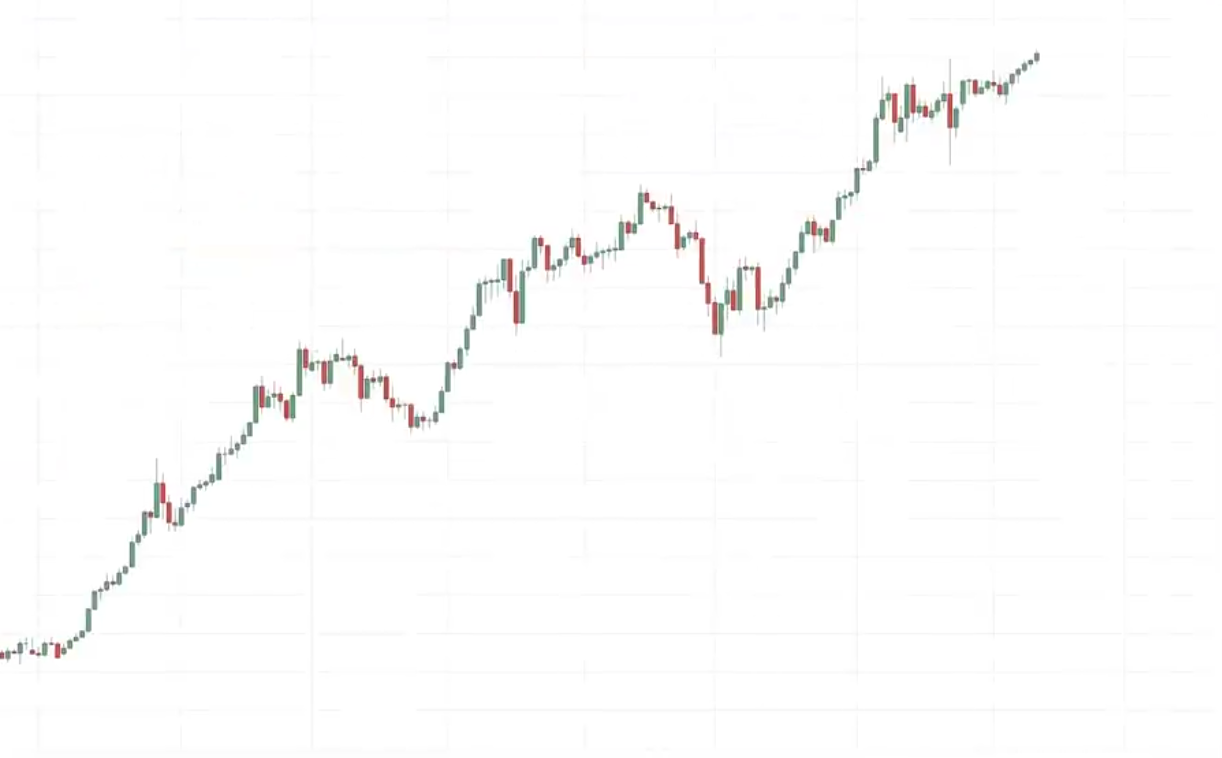
The market is in an uptrend.
Where on this chart should we look for buying opportunities?
Where is support on this chart?
If you look at this here, how would I draw support?
I would look for areas on the chart where the price bounces off higher.
The more significant the level, the more attention I want to pay attention to it. Here’s an example:
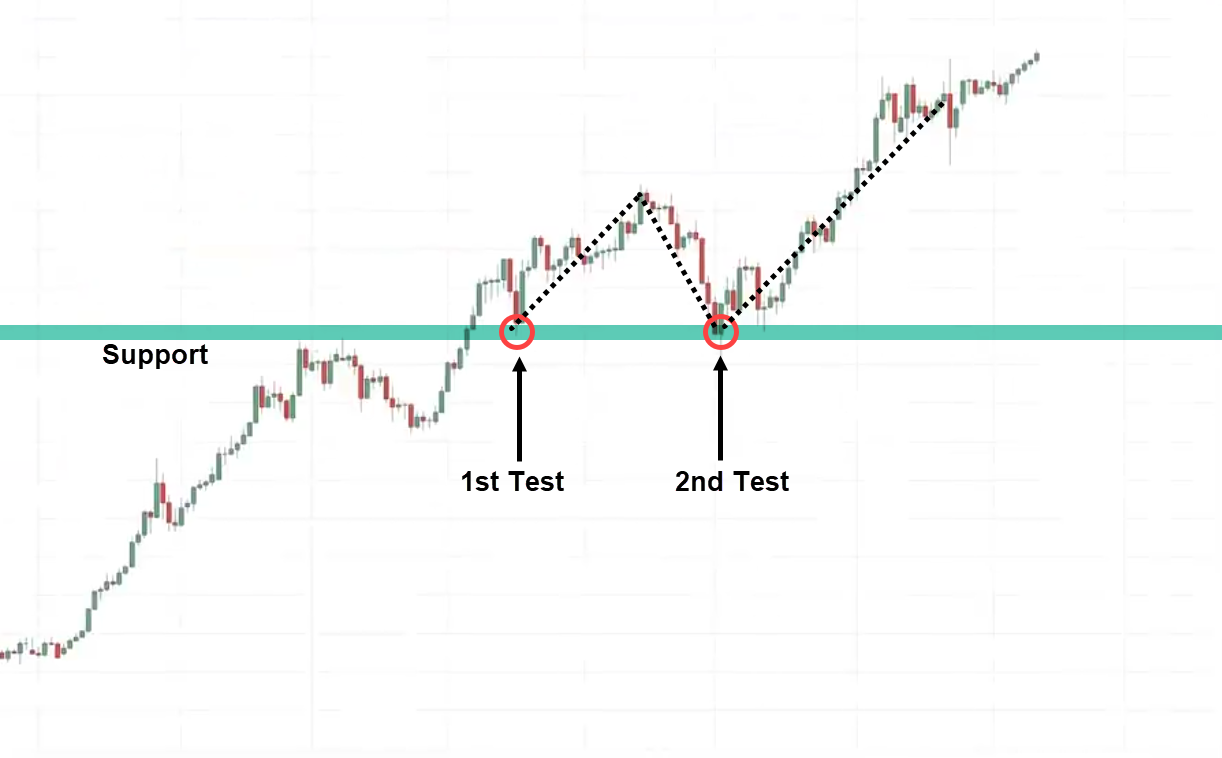
I noticed that the market has bounced off support twice.
This is an area of support that I want to pay attention to.
Moving on…
Notice here how the price bounced off higher from this low to where it is currently.
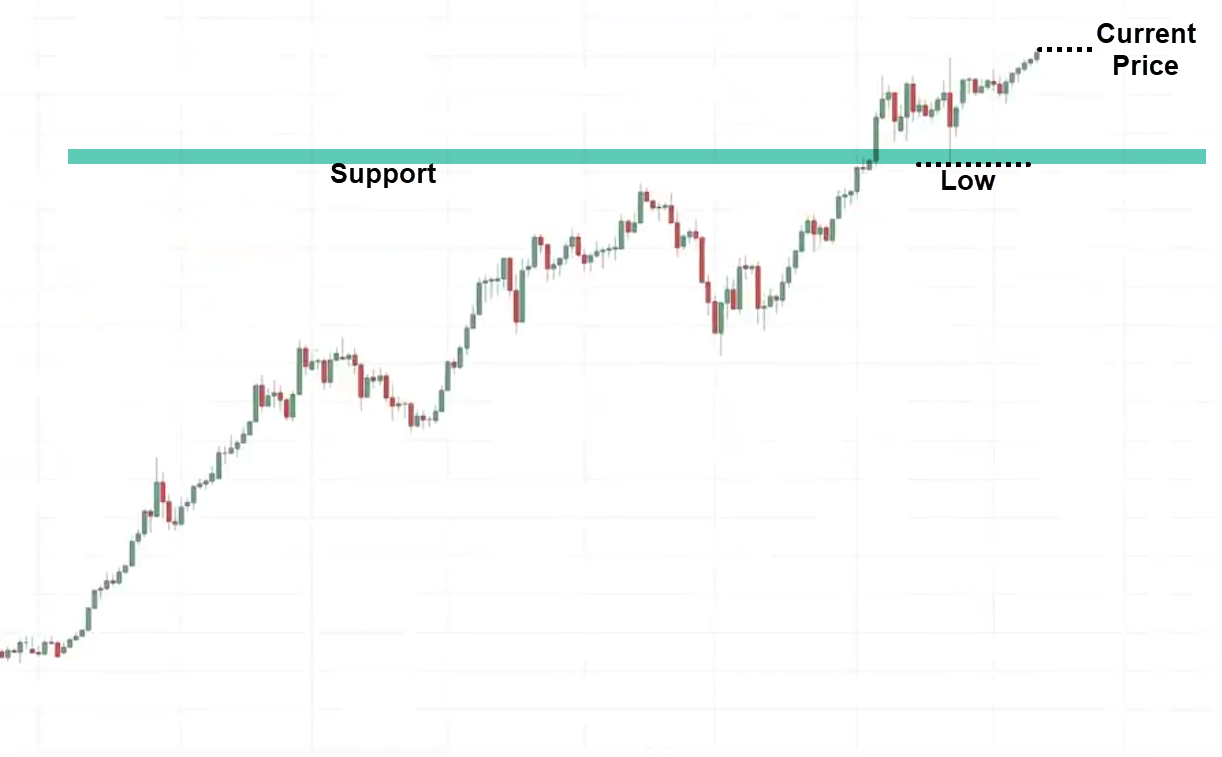
What I will do is draw the area of support.
One thing about drawing support and resistance is that you don’t need too many lines on your chart.
When you draw support and resistance pay attention to the two most recent areas.
The most significant ones.
Downtrend
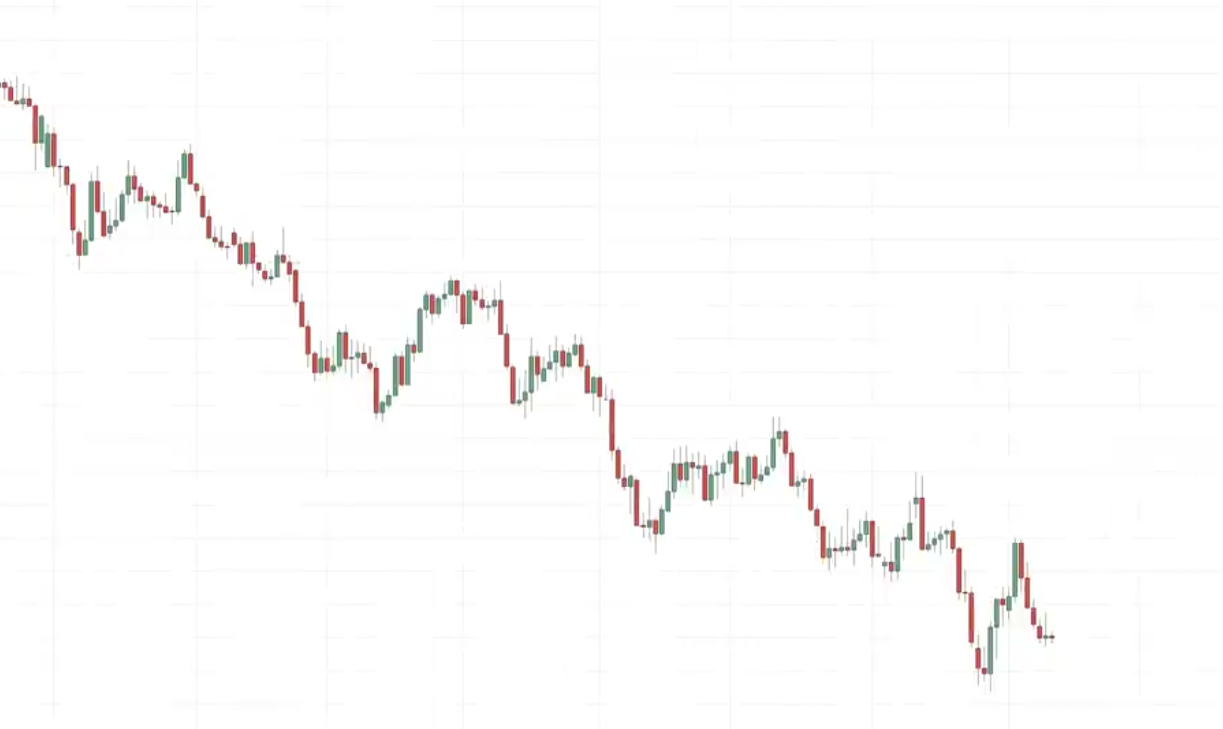
In the downtrend, we want to look for selling opportunities.
Let’s find the two most recent areas on the chart where the price has come lower.
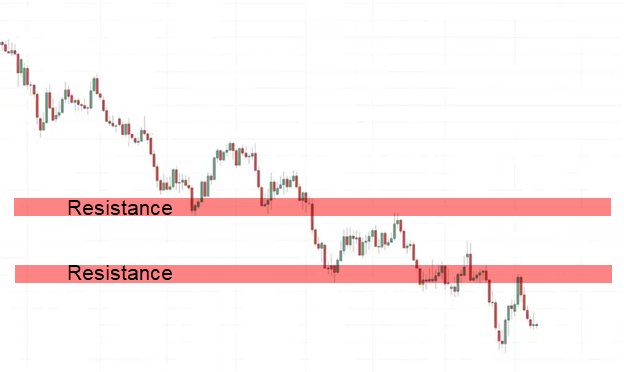
Whenever the price breaks below support it could become resistance.
Let’s say this was the previous area of resistance price breaks out of resistance it could now become support and hit up higher from here:
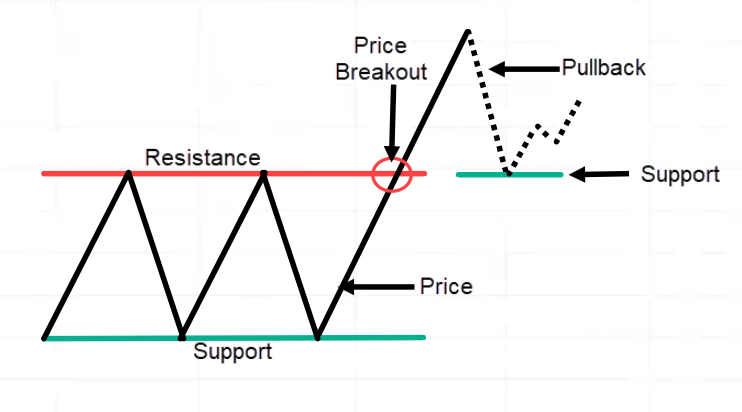
Now you have highlighted the most recent areas, where do you look for selling opportunities?
Entry Trigger
This answers the question.
When exactly do you want to buy or sell?
This is where Candlestick patterns are really useful.
I’ll share with you two popular ones, very useful ones that will help you in your trading.
The hammer and the shooting star pattern.
Hammer
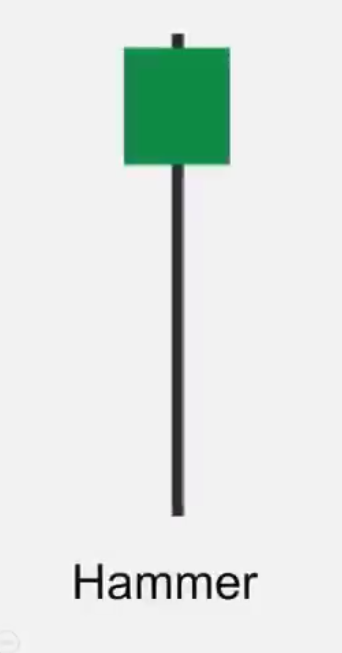
This tells you that in the early part of the day, the buyers were overwhelmed by the sellers, but they found the strength and the courage to push the market in the opposite direction.
When you see a hammer, it doesn’t mean that you blindly hit the buy button.
You also have to look at other factors like the market structure, area of value, etc.
Once you have all those there and you see a hammer that tells you…
“Hey! it’s a time”
You could enter the trade on the next candle open.
Shooting Star
When you see a shooting star pattern. This is like the inverse.
The buyers were in control early part of the day and then the sellers finally said…
“That’s enough”
Then it pushed the price down lower and finally closed near the lows of the day.
These two are very useful entry triggers to help you time your entry to know when exactly to buy or when to sell.
The False Break Setup
This is not a candlestick pattern but it’s a price pattern.
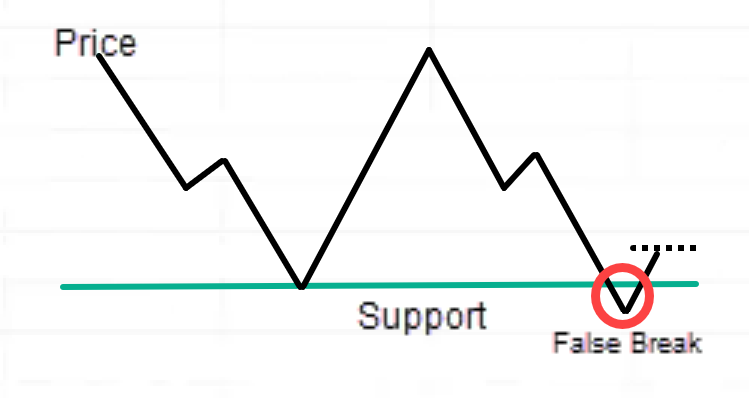
The price comes down to support it bounced up higher they came back down for a second time.
A false break means the price break below support and the next thing the market quickly reverses back above support.
This is what I call a false break.
This is a very useful entry trigger to time your entry to go long.
Exit
When it comes to exit, there are two questions we are trying to answer over here:
Exit where you’re wrong (stop loss)
I have a very simple principle.
Your stop-loss must be at a location where if the price reaches it, it will invalidate your entire trading setup.
Where exactly do you set your stop loss?
I recommend you set it away from an area of value or price structure.
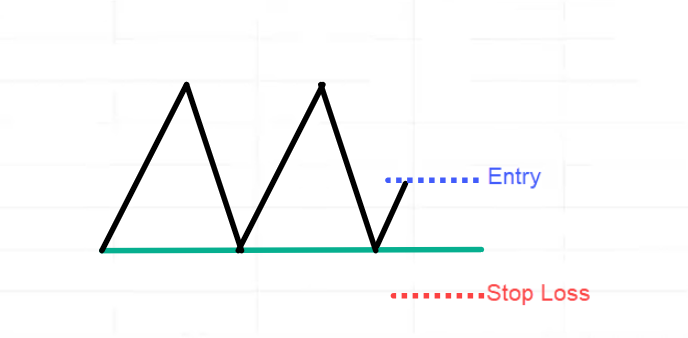
Whenever you set your stop loss you want to set it at a level where the market will invalidate your trading setup.
Exit where you’re right (Target profit)
There are different ways to do it.
You can capture a swing, ride the trend, and more, but for now, we will keep things simple.
Example:
The market is in a range.
The price goes up and down
Let’s say you buy at support. where on this chart do the sellers come in and push the price lower?
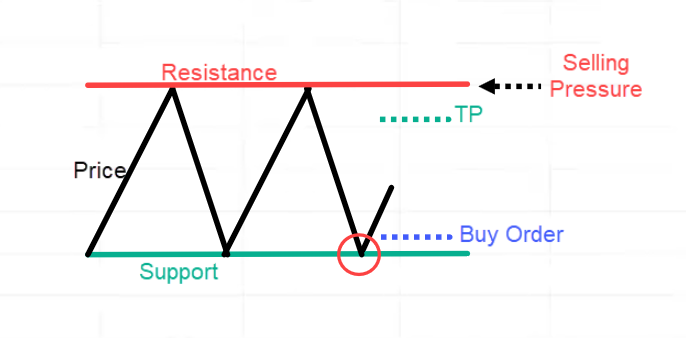
The sellers come in as the area of resistance
It’s a good level to set your take profit level before the area of resistance.
Because if the price goes up coming to the resistance, you take profit great…
What could happen is that the price comes into resistance and then quickly reverses down lower.
If you set your take profit level above the resistance, you’re making the market work hard for you.
Making the market break out of resistance to reach your target and if you were to make the market work hard for you, you would pay the price.
As much as possible the market is the big boy.
Follow the clues that are being left behind by the market don’t try to push your luck but rather respect the market respect the price structure.
If you know that this is an area where sellers might come in then be conservative and set your take profit level, just before that area of resistance.
This will increase your odds of exiting your trade with a profit.
These are two very simple guidelines that you want to take into account when setting your stop loss and target profit.
Now I’ve shared with you the entire formula.
If you realize it’s what I call the “MAEE formula”
Trading Examples
Let’s walk you through a few examples using the MAEE formula that you’ve just learned.
Also, along the way I’ll share with you some advanced price action trading tips to help you better time your entries and exits.
The first part of the MAEE formula,
Market Structure
What is the market structure based on the chart that you are seeing now?
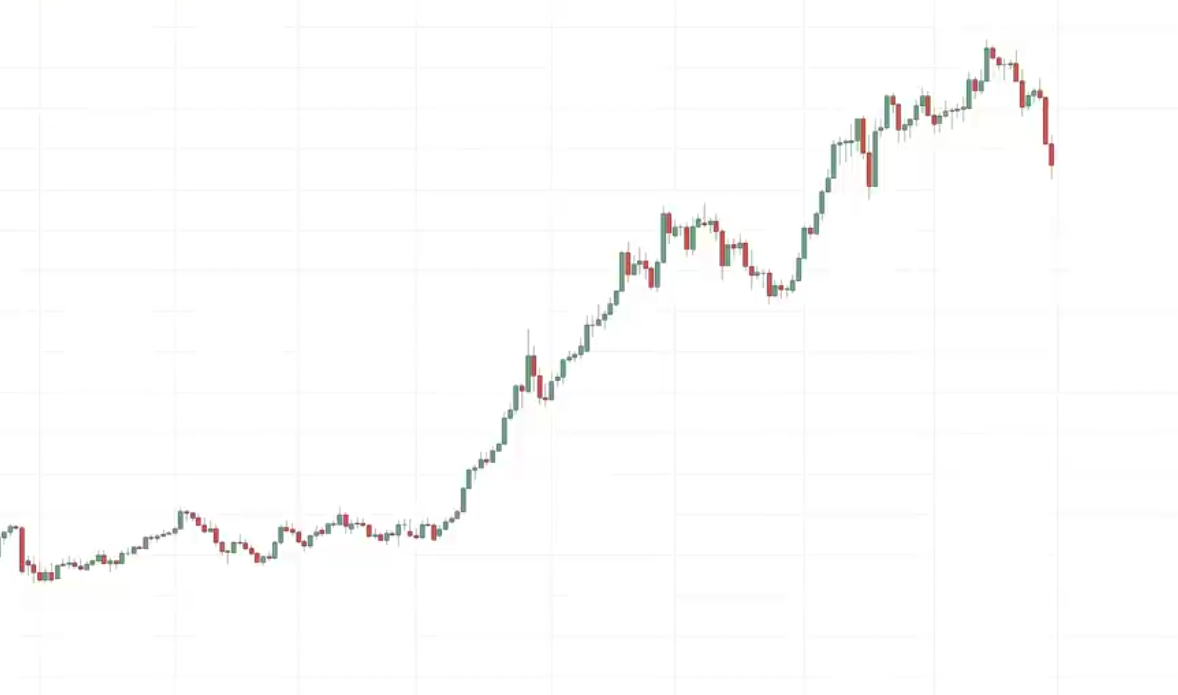
Did I hear uptrend?
Well done.
The first thing we have is the market is in an uptrend.
Area of Value
If the market is in an uptrend we are looking to buy at an area of value and in this case, it would be an area of support.
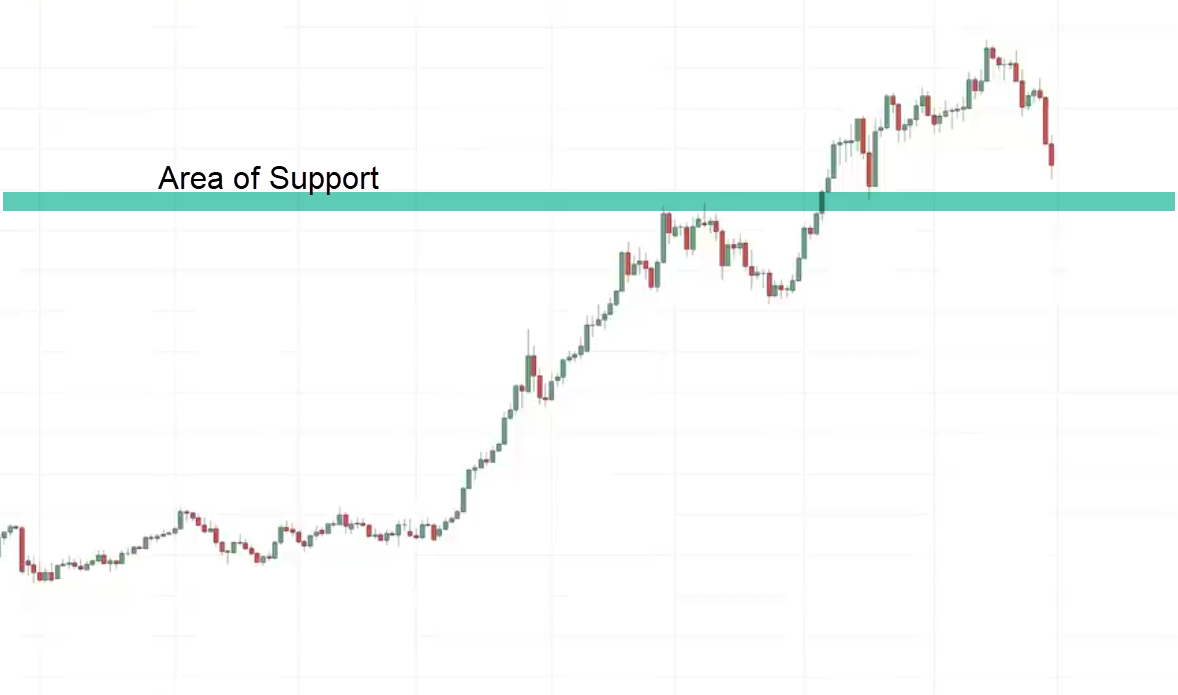
As you can see over here the price came into support and then over here and had a nice-looking reversal candlestick pattern:
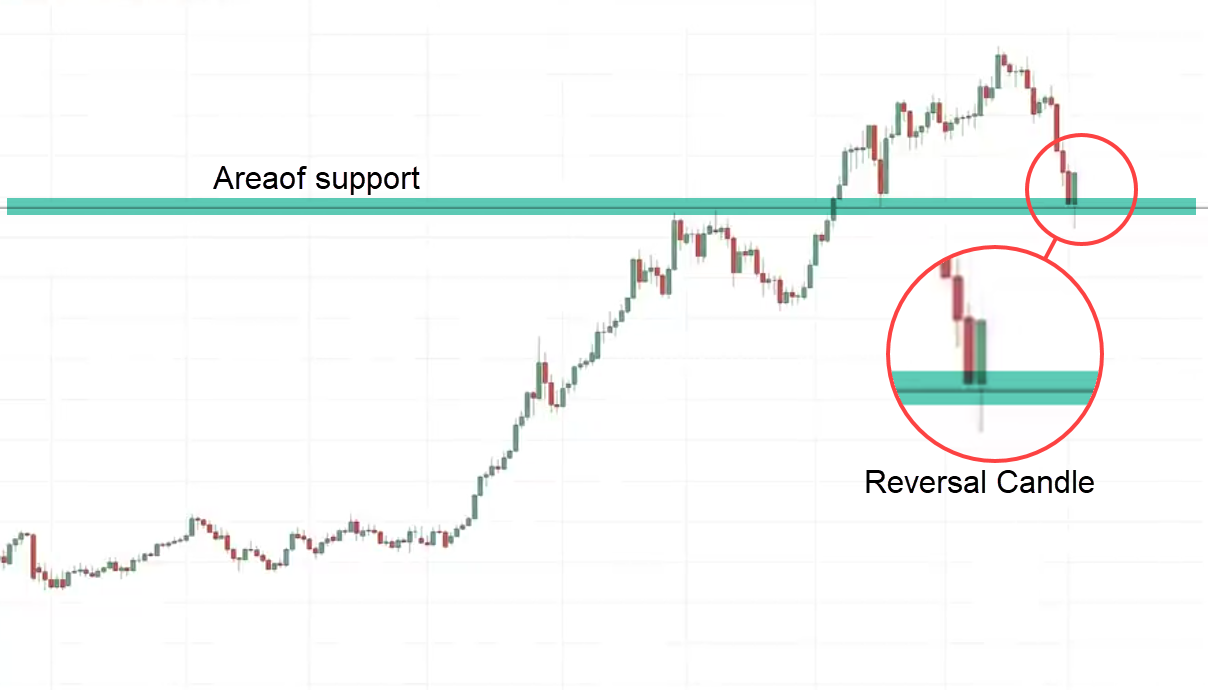
I won’t call this a hammer I think it’s more of a false break.
Earlier you learned that one of the entry triggers is a false break where the price takes out the lows and quickly reverses above support.
This is a classic example of a false break.
In this case, you can enter on the next candle open and set your stop loss a distance below the low.
For the stop loss, I use the ATR.
ATR stands for average true range and it measures the historical volatility of the currency pair.
Entry
What about entry?
You can look to enter on the next candle open.
Let’s see what happens the next day.
The market opens pretty where it closed over here:
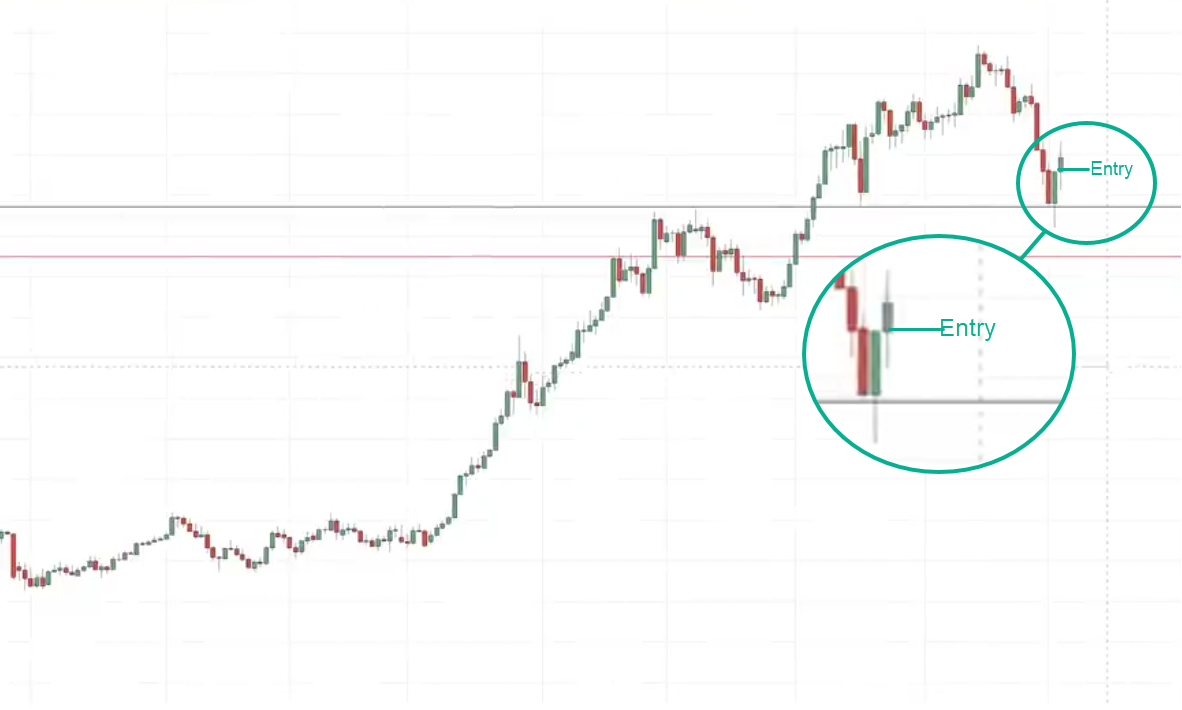
This is your entry price.
Exits
Ideally, we want to exit our trade before these highs before selling pressure comes in and pushes the price down.
What we can do is we can set our target profit somewhere about here:
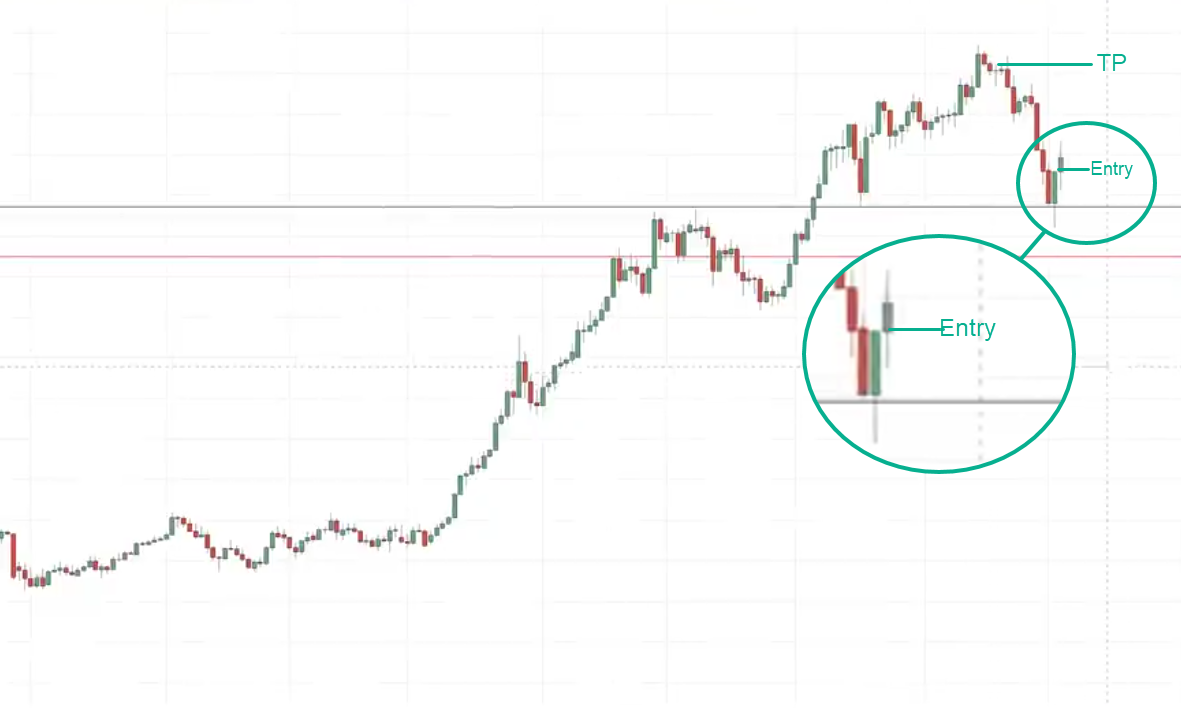
I don’t set it at the extreme highs because it may not get to the extreme price.
Let’s see what happens next…
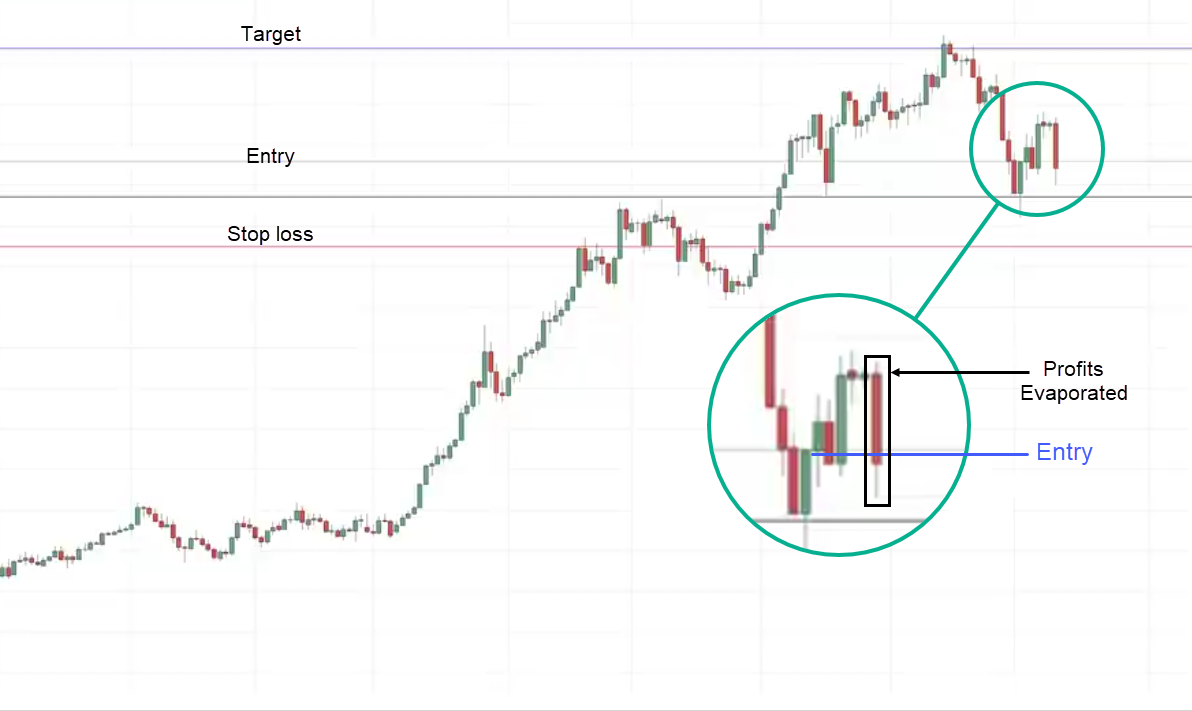
The market gets filled and gets us into the trade and then it moves up against us.
At this point, you will notice that your open profits have evaporated and now probably sitting in red.
Many traders will be tempted to just take the loss and move on and prevent further damage.
But think about this you’ve set your entry, stop loss, and target.
They are all planned ahead of time.
Your stop loss is at a logical level.
This is where you’re giving your trade enough breathing room to breathe because the price could retest support and then go up higher.
You don’t want to have a stop loss being too tight because you could get stopped out prematurely.
Let the trade do its thing.
Your stop loss is already pre-planned ahead of time.
Follow the plan and let the market do what it needs to do.
Let’s see what happens…
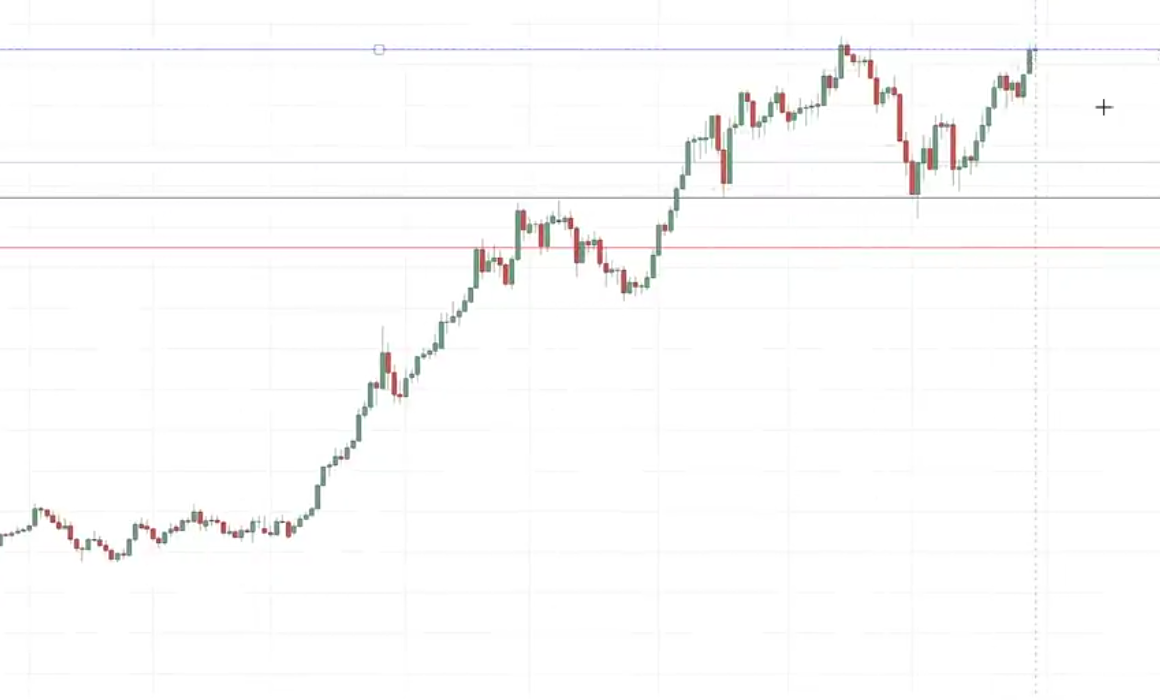
In this case or you can see shortly afterward you would have exited this trade for a profit.
That’s pretty much how the MAEE formula works.

