Do you ever have that feeling where you can see the direction of price movement on a chart but aren’t sure when to enter?
Perhaps you’ve seen a trade move exactly as predicted, but your timing left you on the sidelines?
Identifying key reversal areas and triggers can be a challenge, right?
Well, there’s no need to worry any longer.
I’ve got something to help you pinpoint your entries and make trades with confidence…
The Tweezer Bottom Pattern!
Here’s what you will learn in this article:
- A breakdown of the Tweezer Bottom Pattern, revealing how it represents a shift in momentum.
- Profitable strategies for trading the Tweezer Bottom pattern in an already trending market.
- Techniques for capturing substantial profits using the Tweezer Bottom trend reversal strategy.
- What to do when your trade doesn’t go as planned.
- Common mistakes to avoid when trading the pattern, enhancing your success rate.
Sound good?
Great! Then let’s get started!
What is the Tweezer Bottom pattern?
The tweezer bottom pattern is a candlestick pattern that every trader should have in their toolbox.
It consists of two candlesticks with equal lows, one appearing immediately after the other.
The easiest way to visualize the Tweezer Bottom is by thinking of it as a shift in momentum.
Let’s take a look at what I mean by this.
Short-term shift in momentum
It all boils down to the Tweezer Bottom pattern representing a significant short-term change in momentum.
Let’s walk through an example of this momentum shift…
Shift In Momentum Example #1:
Price makes a strong move down in a downtrend, forming a candle with a noticeable wick below.
This candlestick might be considered a hammer, showing clear rejection at this level.
Here’s another example…
Shift In Momentum Example #2:
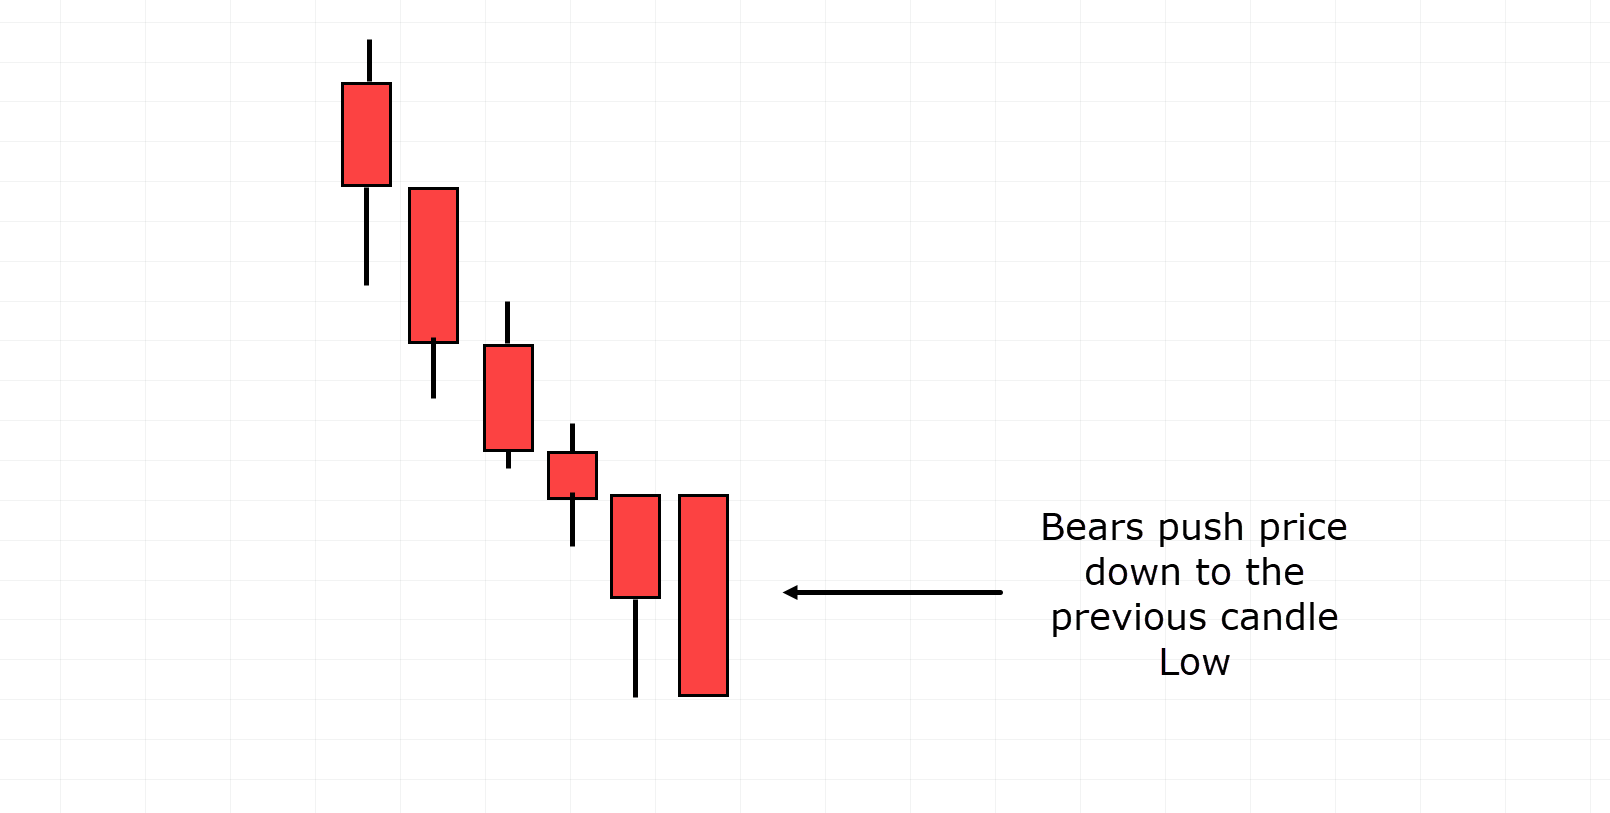
During the next candle, bears attempt to move the price below the wick of the previous rejection candle.
However, in its attempt to move below the wick, buyers step in and drive the price back up.
This forms the tweezer bottom candlestick pattern, indicating that bears failed to push market prices lower on both occasions.
Let’s look at another…
Shift In Momentum Example #3:
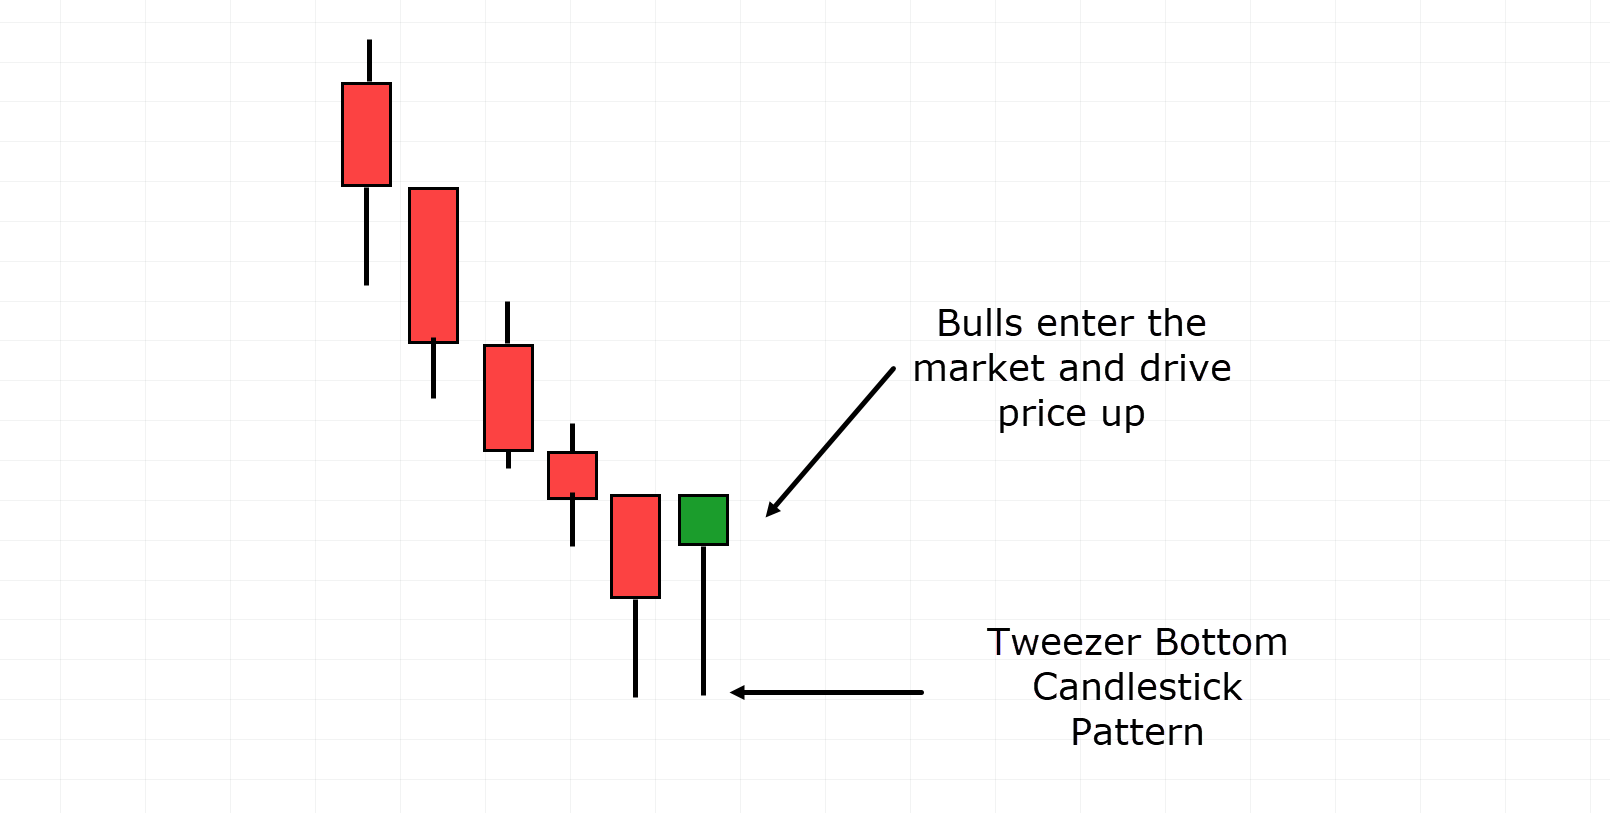
In this case, the bears have been unsuccessful in maintaining the bearish momentum.
Whether this is just a brief pause in the overall downtrend or not, one thing is evident—there has been a momentum shift in each case.
Don’t forget that the Tweezer Bottom Pattern can come in all shapes and sizes, this is just one example of many, as illustrated in the variations diagram!
Nevertheless, momentum shifts provide valuable insight into potential market reversals.
Tweezer Bottom Variations
It’s crucial to understand that these candles can come in various shapes and sizes; what matters more is that the two lows of the candlesticks are the same, or at least very close!
Let’s look at some examples to illustrate my point…
Tweezer Bottom Variations:
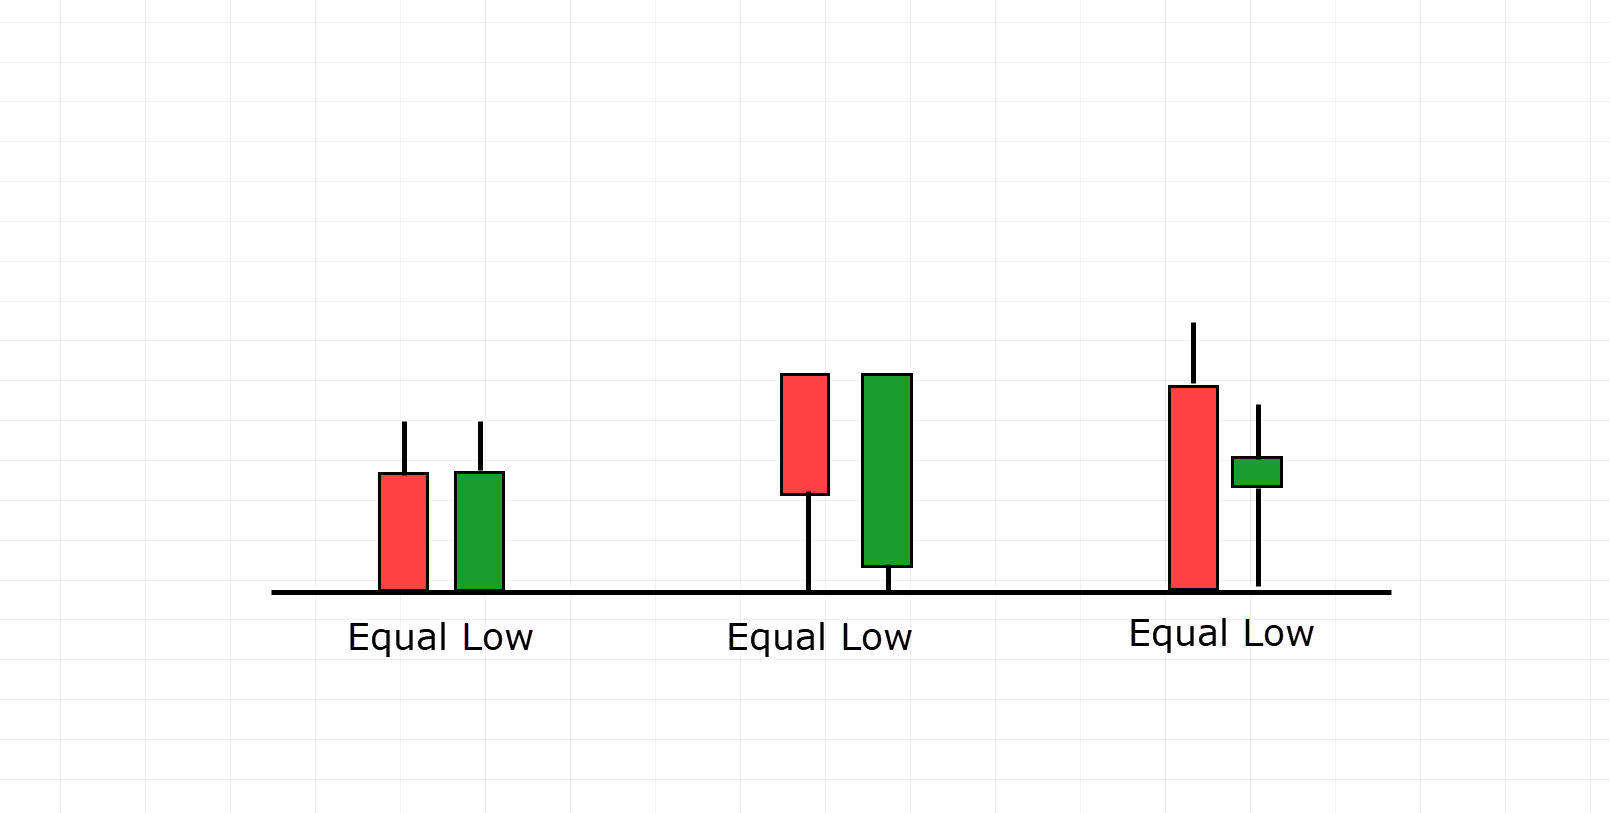
Notice how these examples vary in shape and size, yet the lows of the candles are nearly identical.
These examples perfectly illustrate what I’m looking for when identifying the Tweezer Bottom Candlestick Pattern.
As a trader, I don’t want you to become excessively fixated on whether the lows are precisely the same in the tweezer bottom. Instead, focus on the fact that they have very similar lows.
With that point clear, let’s delve into why this pattern is a valuable tool.
How the Tweezer Bottom is Low TF Support
Let me ask you another question:
What do you think the Tweezer Bottom is actually representing?
Well, in its simplest form, the Tweezer Bottom signifies a lower timeframe support level.
Let’s illustrate this on the charts.
Take a look at this Daily AUD/NZD chart…
AUD/NZD Daily Chart Tweezer Bottom:
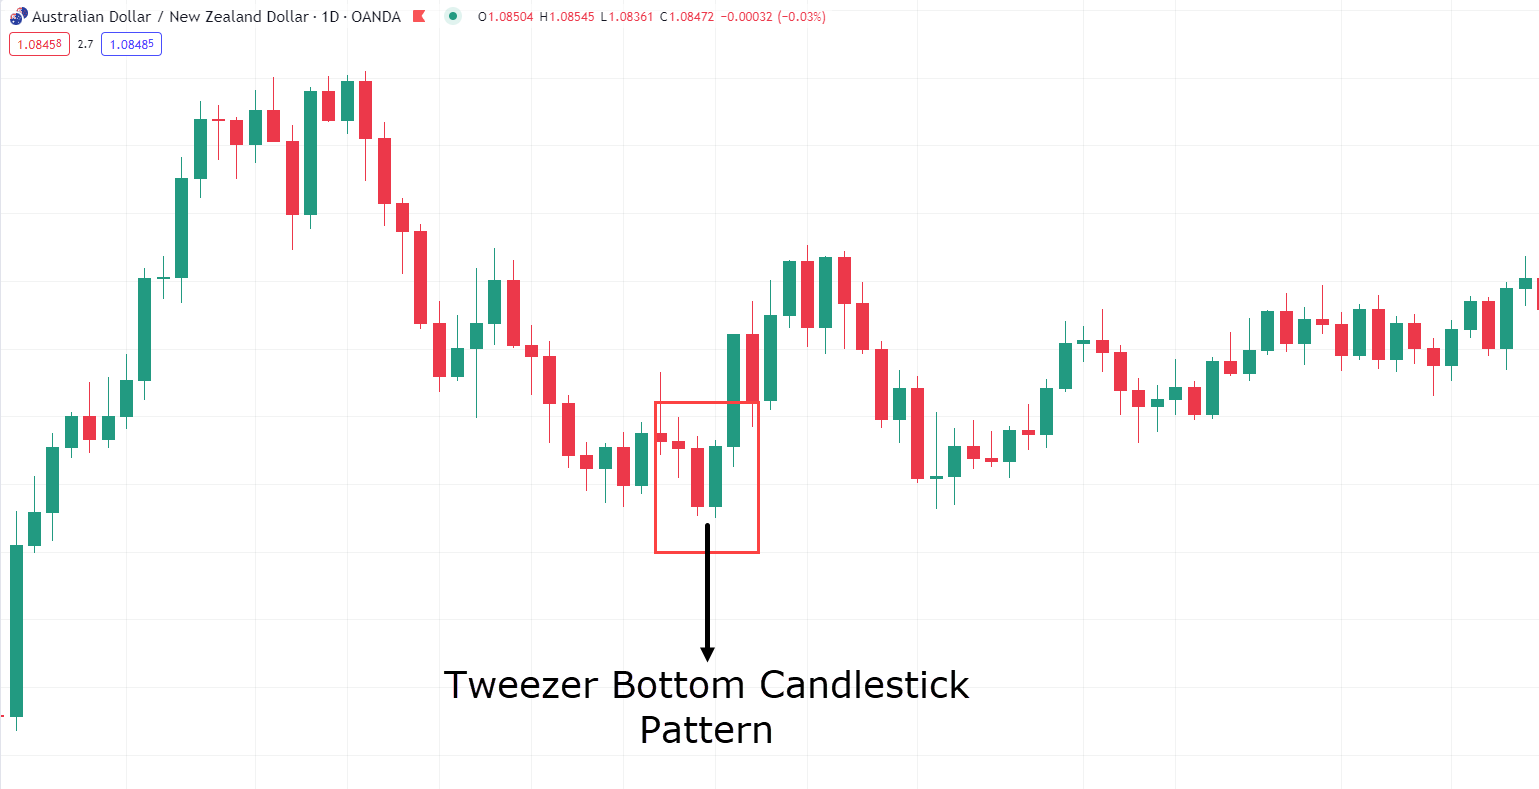
Clearly, a Tweezer Bottom Candlestick Pattern has formed on the chart.
Now, zoom in for a closer look…
AUD/NZD 1-Hour Timeframe Chart Support Level:
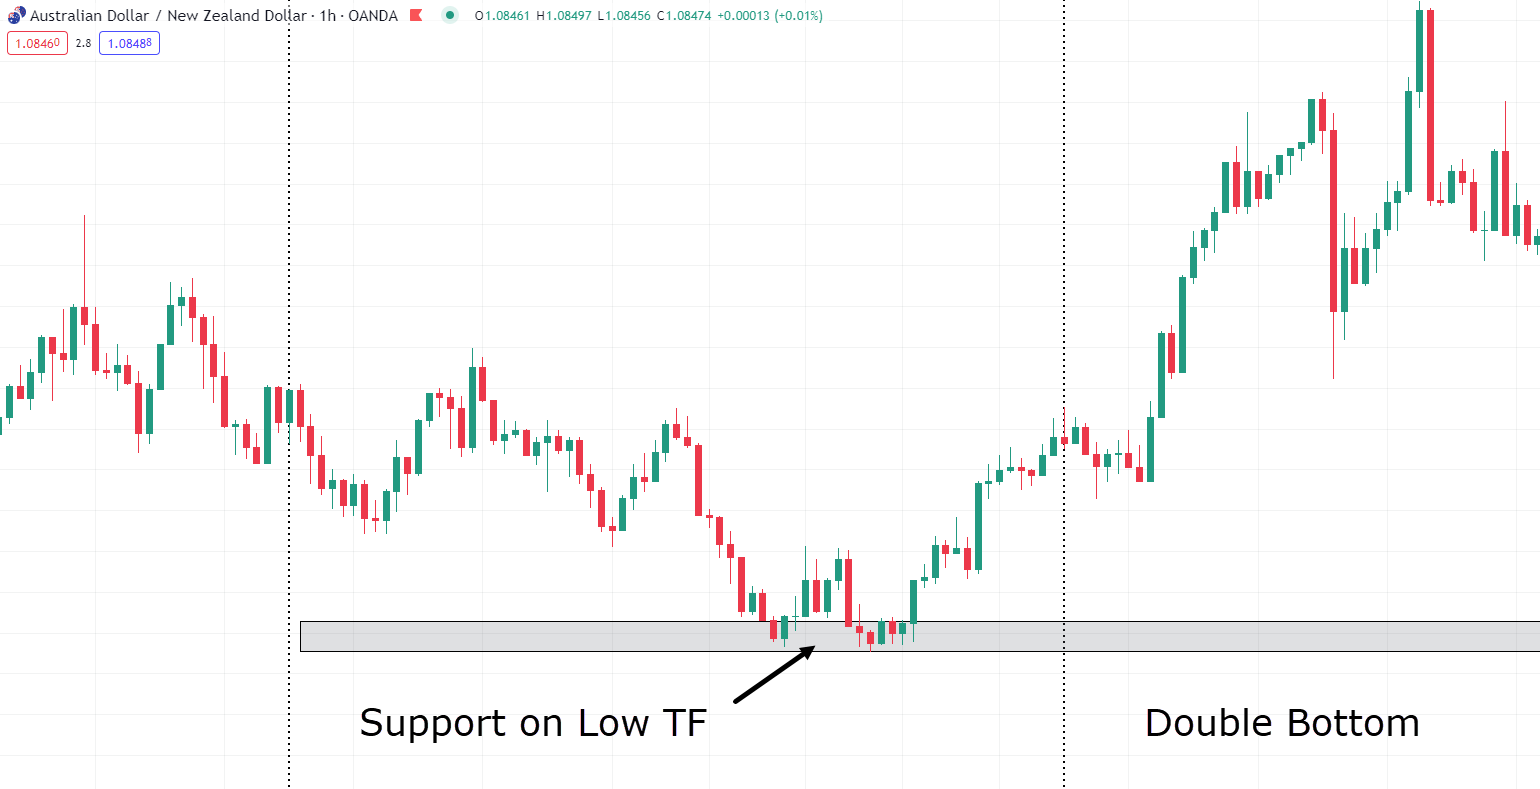
On the 1-hour timeframe chart, you can observe the formation of a support level. This candlestick arrangement resembles a double bottom.
Describing the Tweezer Bottom Candlestick pattern as a shift in momentum is fitting.
The Tweezer Bottom often pinpoints the final point at which a support level was established on a lower timeframe when the price bounces.
If momentum continues, there’s a real chance of catching the bottom of a trend!
I will dive deeper into the details of this later in the article.
Frequency
A notable advantage of the Tweezer Bottom is its regular occurrence compared to other candlestick pattern formations.
As you descend into lower timeframes, you’ll see it appear even more frequently.
However, it’s crucial to keep in mind that I place a higher value on signals from higher timeframes than those from lower timeframes.
Candle Strengths
Finally, the momentum behind the second candle can frequently provide additional support for your trade setup.
For example, if the price falls and forms two doji-like candles that are indeed tweezer bottoms, the strength here could simply indicate a brief pause before continuing downward.
However, if the price falls to a zone, forms a hammer, and then forms a bullish engulfing candle as the follow-through, the chances of the bulls winning the battle for momentum increase dramatically!
Tweezer Bottom Pullback Strategy
So, how do I work out what I’m looking at?
Well, there are two major approaches I like to take when analyzing Tweezer Bottoms.
Firstly, I examine the Tweezer Bottom in a pullback scenario.
This involves looking for the tweezer bottom pattern in an uptrend when there are brief pullbacks in price.
These are excellent trading opportunities as they allow you to trade with the trend while providing extra confirmation that the price is ready to continue in the trend direction, having established support on the lower timeframe.
The second way I trade the Tweezer Bottom is as a reversal pattern for a larger overall trend.
Although this approach tends to be on higher timeframes, identifying these areas on lower timeframes can be an extremely profitable exercise in capturing the shift in momentum for a longer timeframe.
Now, let’s explore the pullback scenarios first!…
AUD/JPY 1 Hour Timeframe Chart Example #1:
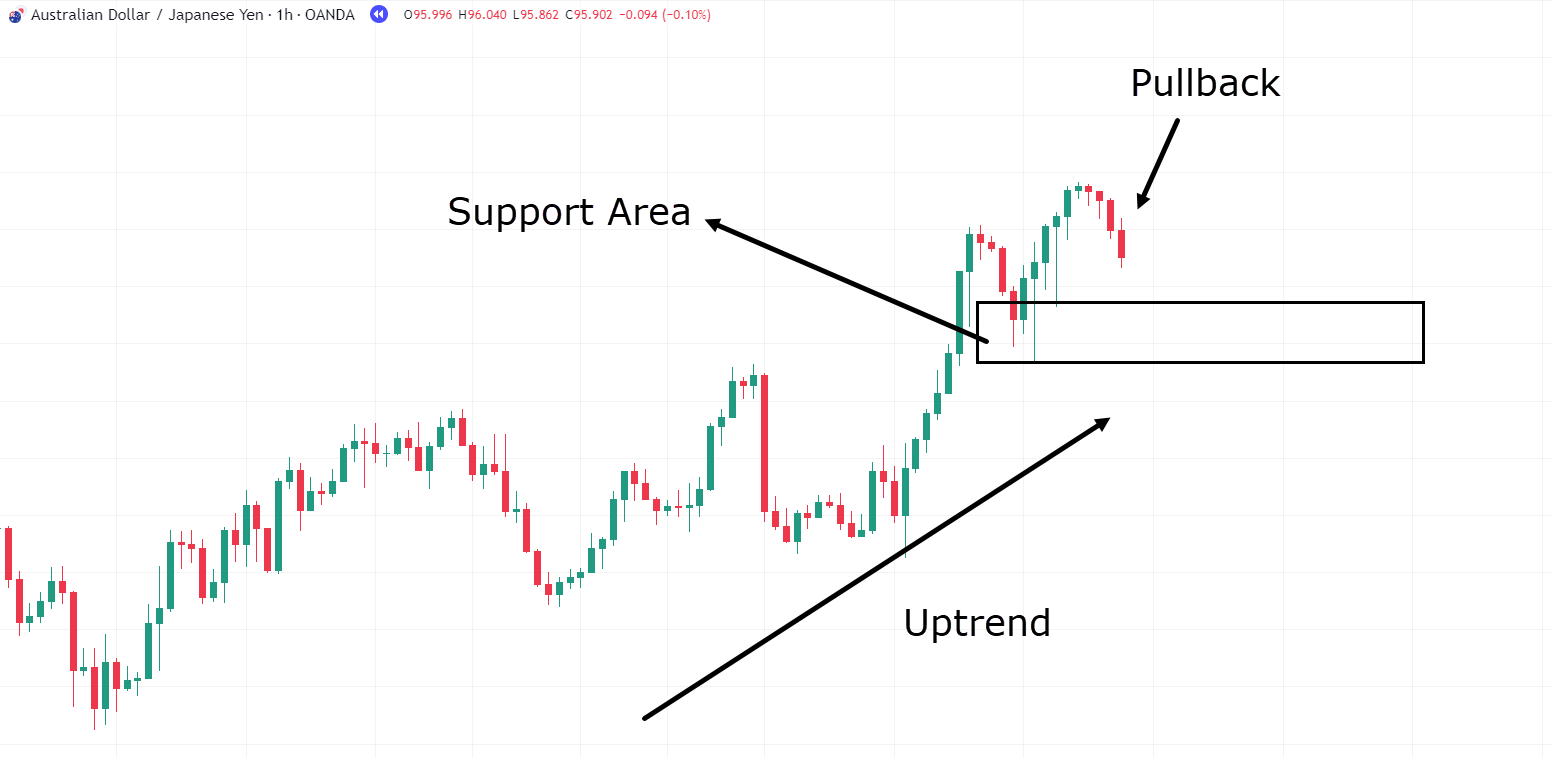
Here, you can observe a typical uptrend on the 1-hour timeframe for the forex pair AUD/JPY.
In an uptrend, it’s common for the market to move in a wave-like pattern as the price gradually climbs higher.
As you can see, the price has formed a local support area, where the price then bounced and moved to form a higher high.
The pullback into the support zone provides an excellent opportunity to buy at a better price than just buying at the new highs.
Let’s wait for a Tweezer Bottom pattern to form and see what happens…
AUD/JPY 1 Hour Timeframe Chart Tweezer Bottom:
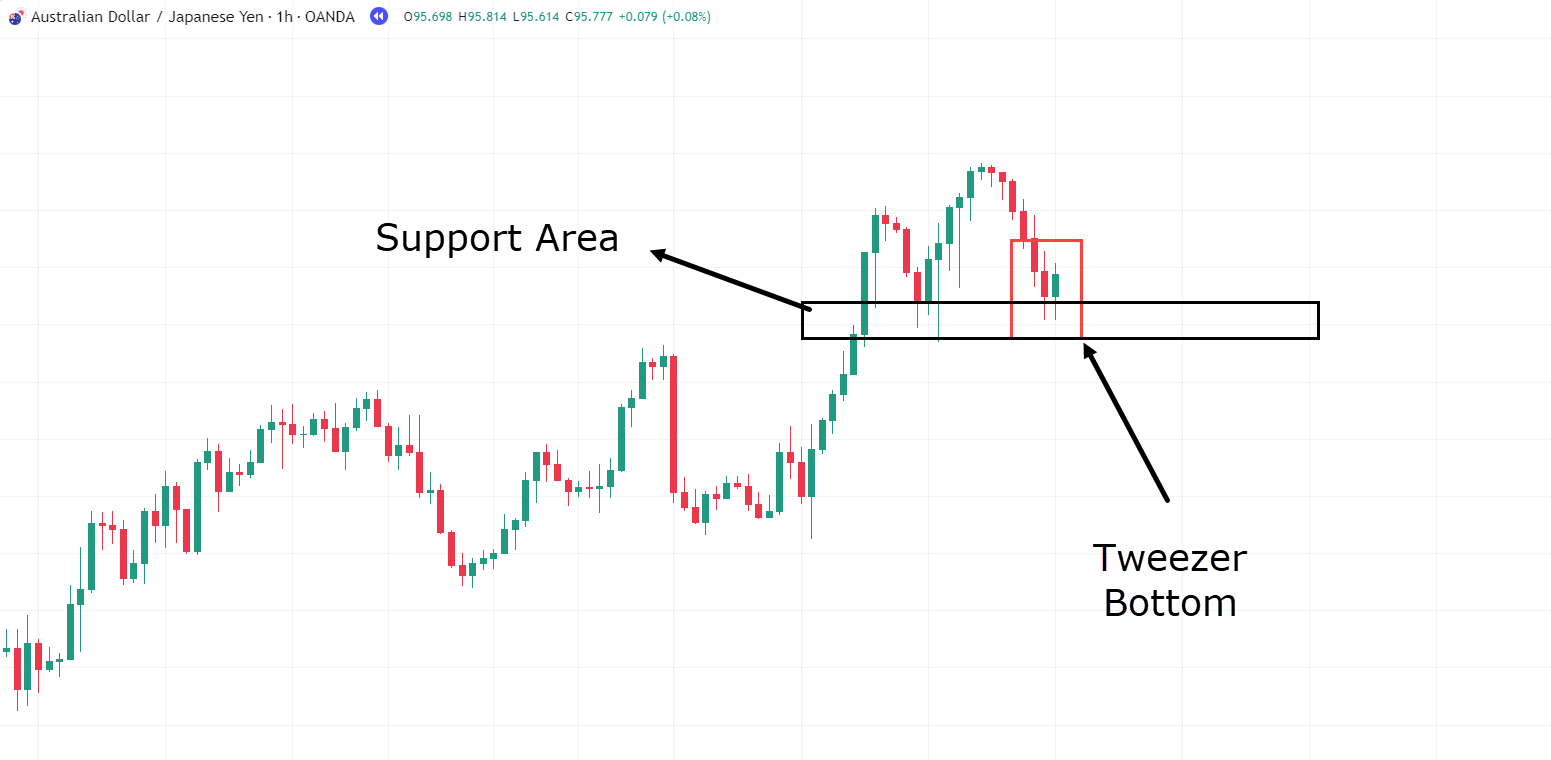
As depicted in the chart, the Tweezer Bottom has formed at the local support area.
This formation could indicate that the price isn’t willing to go any lower, and the bulls have come in to confirm this area as support.
Now, let’s take a long trade from this area and see what happens…
AUD/JPY 1 Hour Timeframe Chart Take Profit:
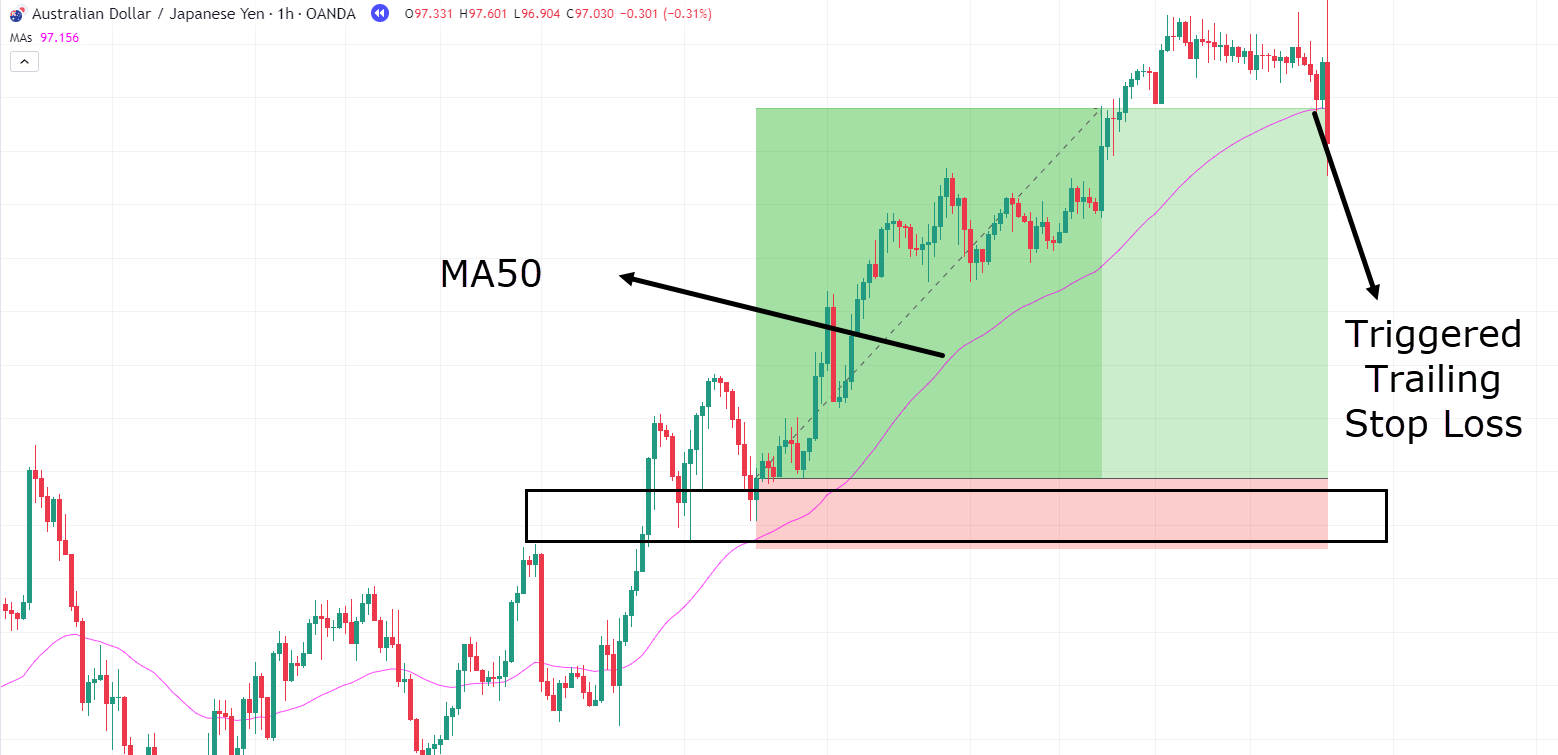
As illustrated, the price gradually made its way up, forming higher highs and higher lows from the Tweezer Bottom.
Now, for these pullback trades, I like to use a moving average as a trailing stop loss to take my profits.
As price normally acts above the MA50 during a trend, it makes sense to take profit as price begins to breach the moving average…
Using this technique, you would have captured a whopping 5RR trade by simply exiting as price began to breach the moving average!
I invite you to test out different moving averages on different timeframes to see what works best for your trading strategy…
This example just demonstrates how the Tweezer Bottom pattern can be successful in pinpointing the point at which the price is ready to continue in the direction of the overall trend.
Now, let’s explore another example to reinforce this point further!…
CAD/JPY 1 Hour Timeframe Chart Example #2:
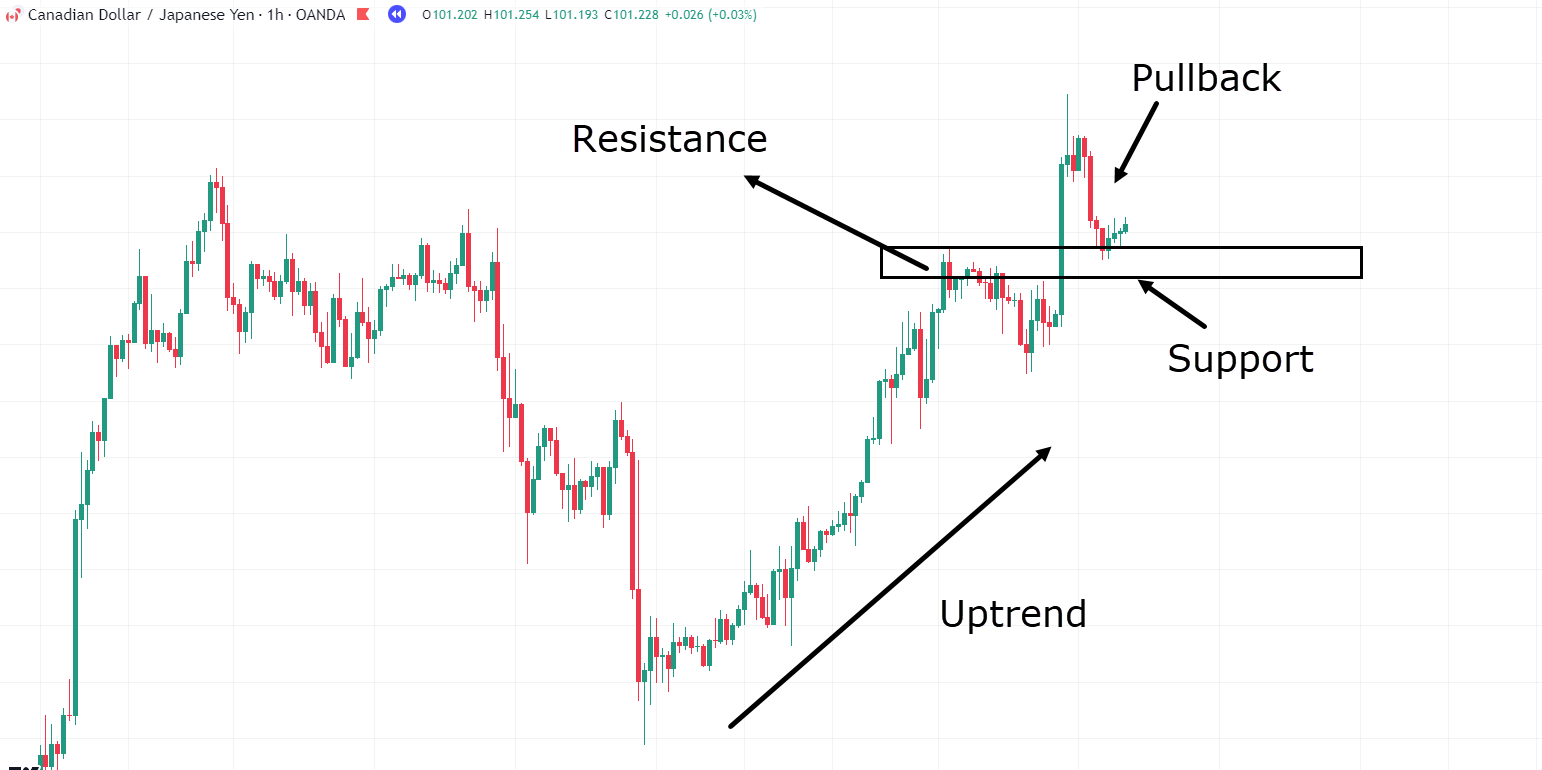
Here, you can observe another uptrend, this time on the CAD/JPY pair.
In this scenario, price has formed a break and retest of structure…
…and with this brief pullback, the price is presenting us with a buying opportunity, as local resistance has now become support.
Let’s zoom in and wait to see if any pattern forms that allows you to take a trade…
CAD/JPY 1 Hour Timeframe Entry:
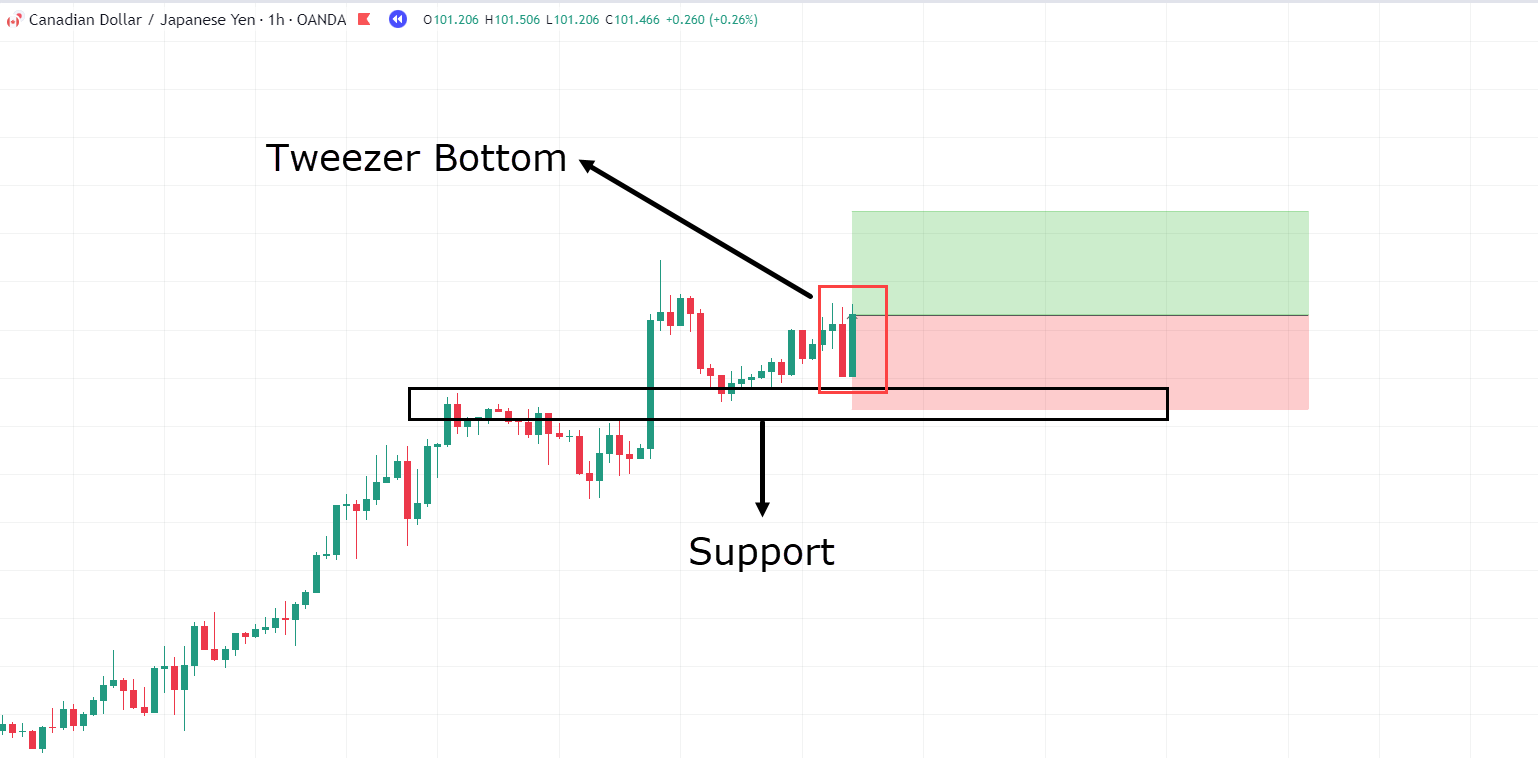
Notice how the Tweezer Bottom pattern can come in all different shapes and sizes?
In this case, instead of two small hammer-like candles as seen in the previous example, there is a fairly strong bearish candle followed by a bullish engulfing candle that swallows the entire bear candle.
Here you have two bullish candlestick patterns in one, the Bullish Engulfing pattern and the Tweezer Bottom pattern!
Now, let’s see how it played out!…
CAD/JPY 1 Hour Timeframe Chart Example Take Profit:
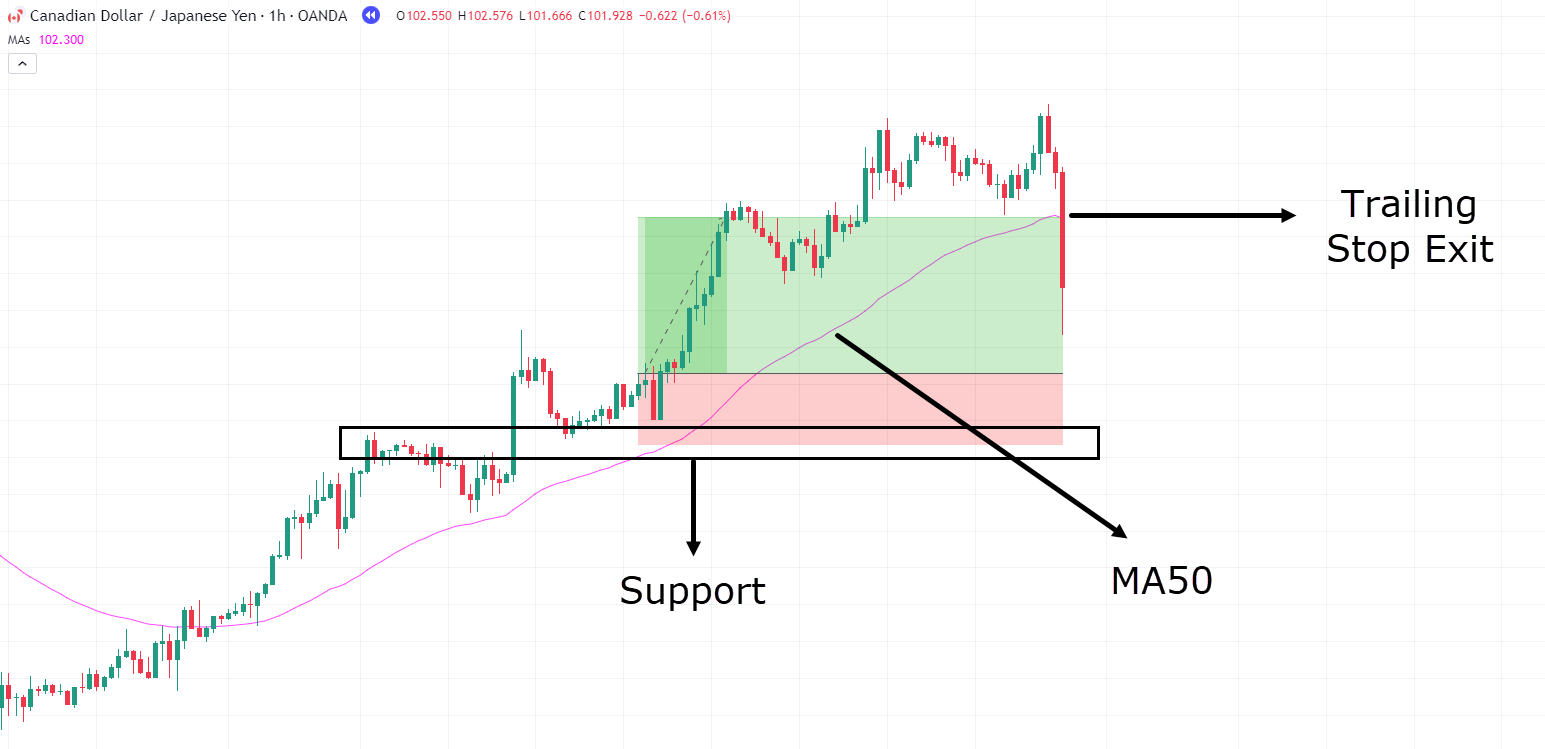
As illustrated, the price shot up from the support level and the Tweezer Bottom and created new highs.
Just like in the previous example, the MA50 was used as a trailing stop loss – stopping you out of the trade at approximately 2RR.
So, with a better idea of how to trade these patterns in an uptrend, what about picking reversals at the bottom of downtrends?
Now, you might be wondering how different they can be if the pattern is the same…
And the honest answer is… very different!
The reversal Tweezer pattern involves more risk, but it also allows the trader to capture potentially large profits.
If done properly, you can identify the reversal points of a downtrend that could mark the start of a new uptrend.
Don’t believe me?
Let’s take a look at an example…
Tweezer Bottom Reversal Pattern Strategy
GBP/USD 4-Hour Chart Support Level:
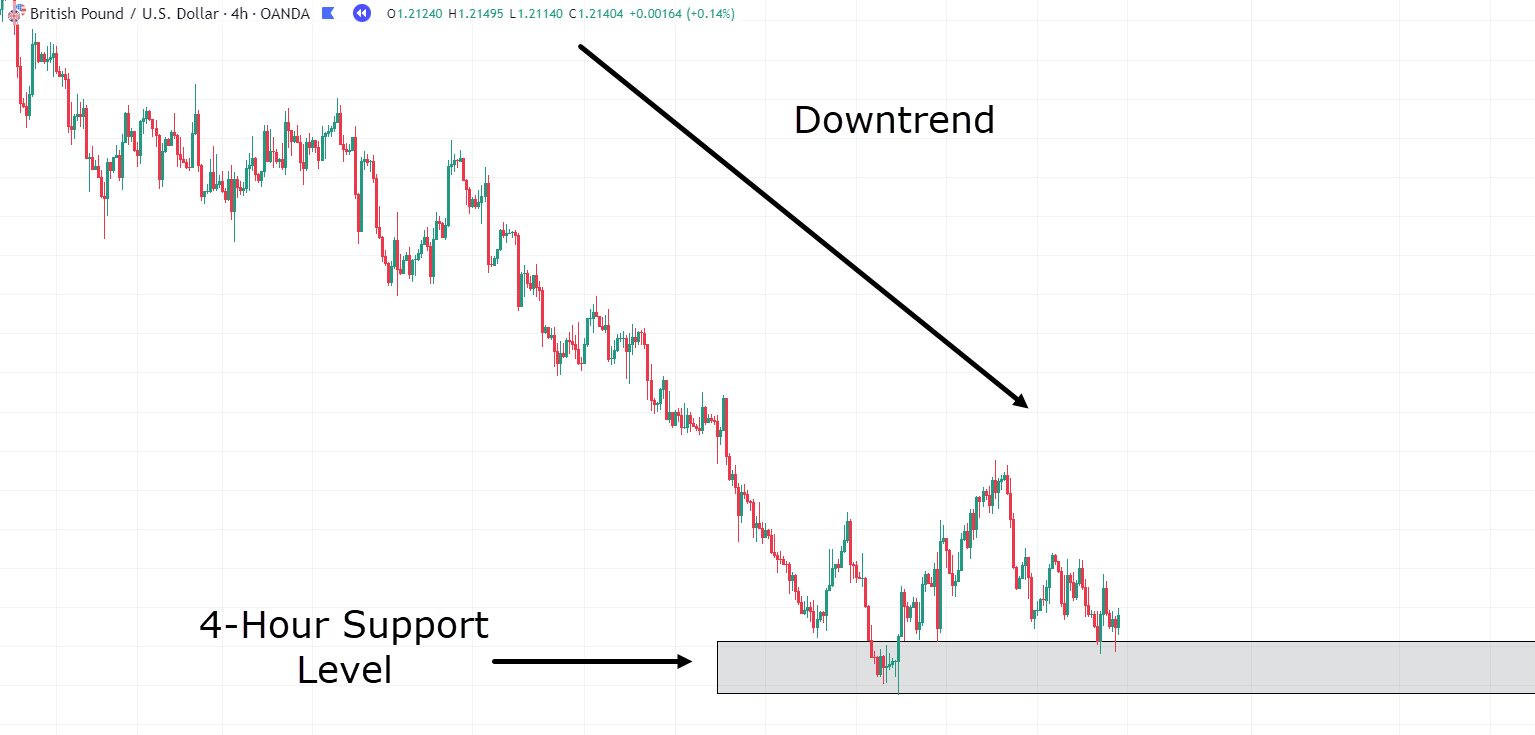
Here is the 4-hour chart of GBP/USD, clearly depicting a downtrend.
However, something curious is happening in the latest price action…
Notice how the price has briefly halted its strong downward momentum and started to form what appears to be a support?
This 4-hour support level has experienced a few bounces.
Let’s zoom in and take a closer look at what price is doing on the 1-hour timeframe!…
GBP/USD 1-Hour Chart Tweezer Bottom:
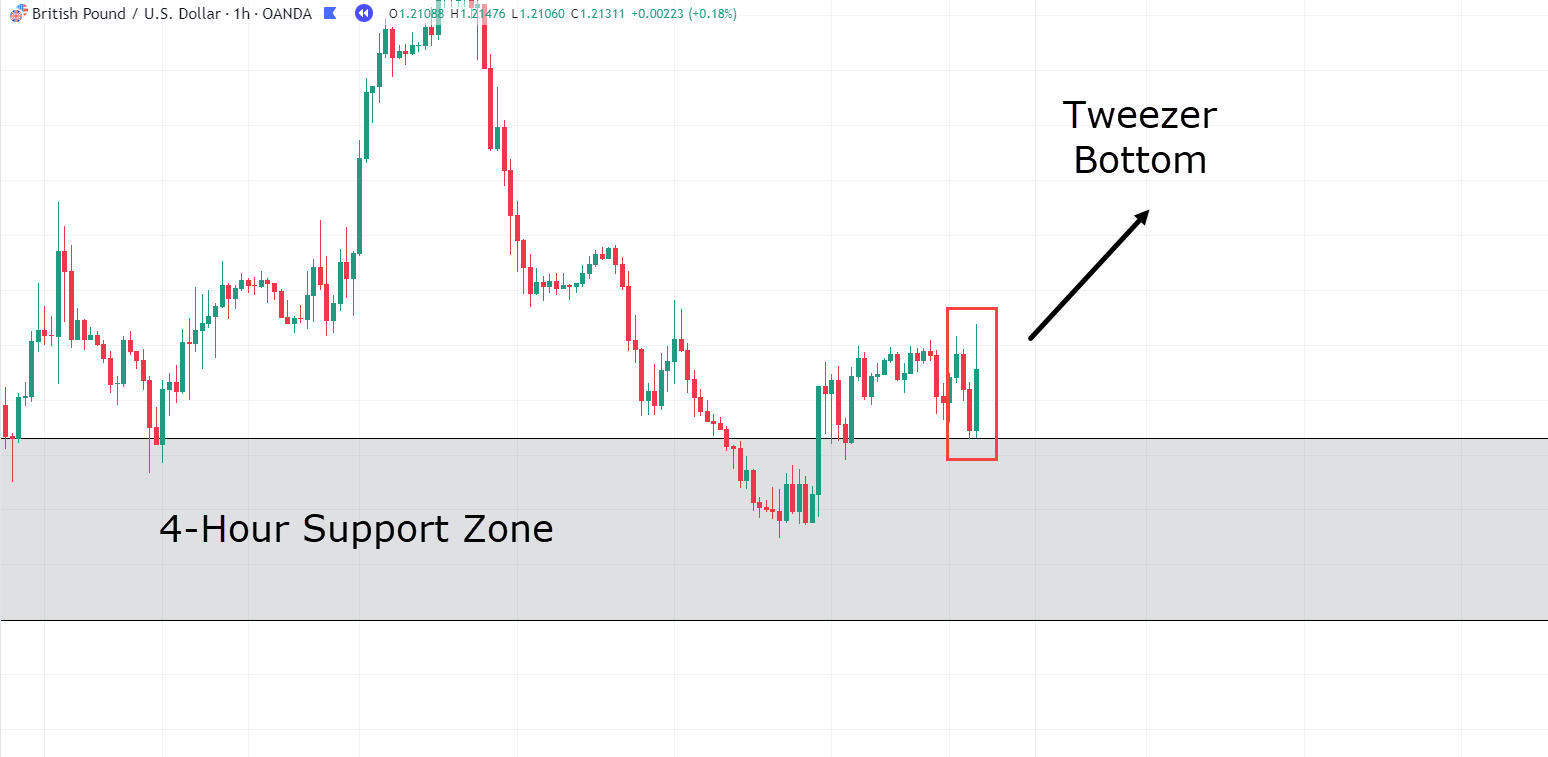
As you can see, the price continues to hold over this 4-hour level.
On this lower timeframe, I like to look for Tweezer Bottoms that show a significant sign of strength from the bulls.
In this scenario, you have the 4-hour support level still holding for a few weeks.
But what is more interesting is the fact that a Tweezer Bottom Pattern has occurred on the 1-hour timeframe.
The second candle of the Tweezer Bottom engulfs the previous bear candle, providing you, as the trader, with insight that the price may have finally found some bullish momentum!
Let’s take the trade!…
GBP/USD 1-Hour Chart Tweezer Bottom Entry:
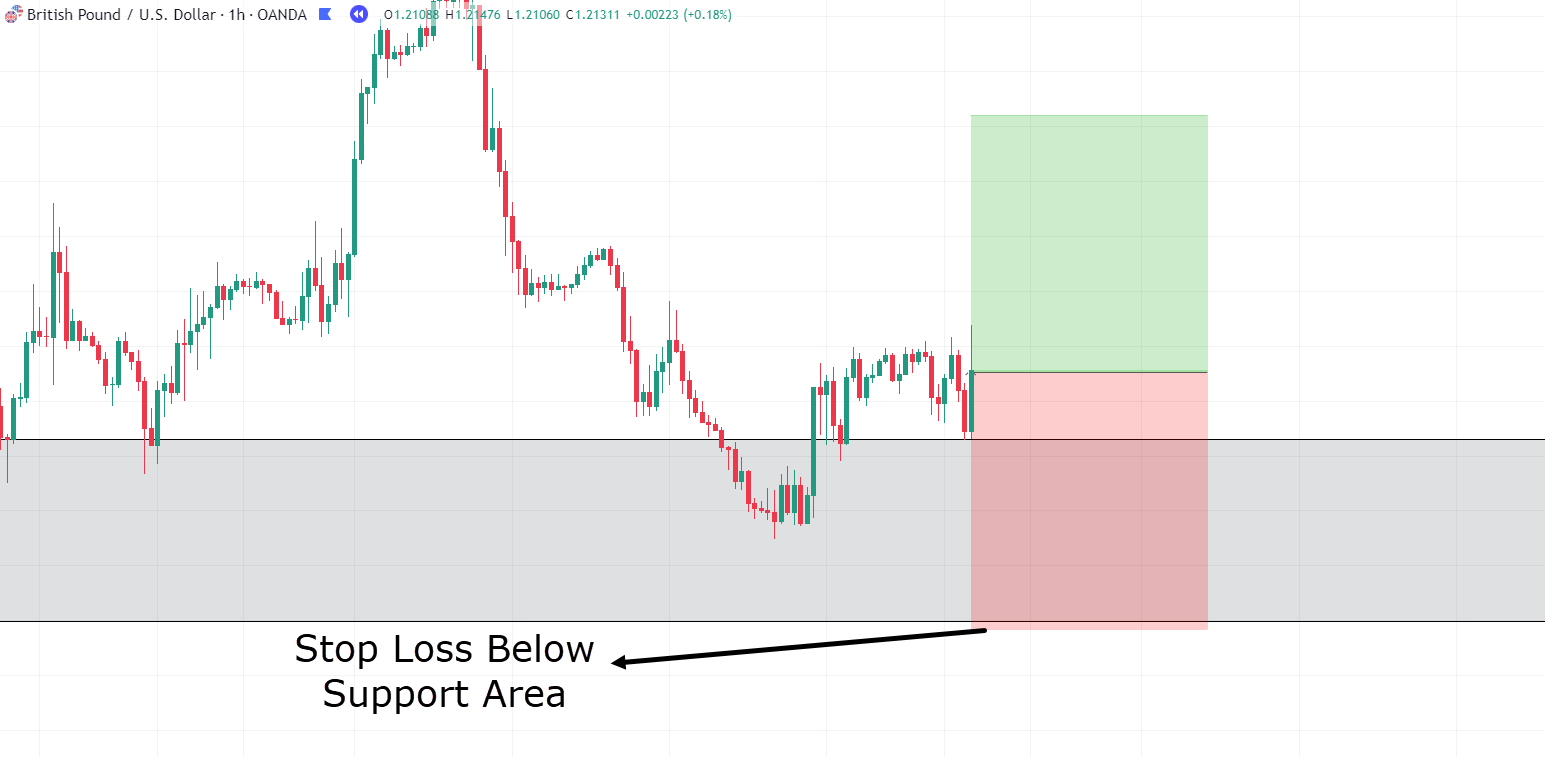
For this example, I have chosen to put my stop loss just below the 4-hour support level, allowing the trade some room to breathe.
I like to stay on the side of caution, especially when trying to pick trend reversals, as the major strength behind this trade is the 4-hour zone due to its presence on the higher timeframe.
If you wanted to take on more risk, you could place the stop loss below the Tweezer Bottom or somewhere nearby that makes sense to you!
Taking profits with the Reversal Pattern becomes slightly less straightforward because, after a considerable downtrend, price is rarely acting above the moving averages.
This leads to you having to choose some different exit strategies.
It could be things like a higher timeframe moving average being breached, a crossover between multiple moving averages, taking profits at previous resistances, or a Fibonacci extension.
For this example, I used the Fibonacci tool to find Fibonacci extensions on the 1hr timeframe for my take profits at multiple points along the way…
GBP/USD 4-Hour Chart Tweezer Bottom Result:
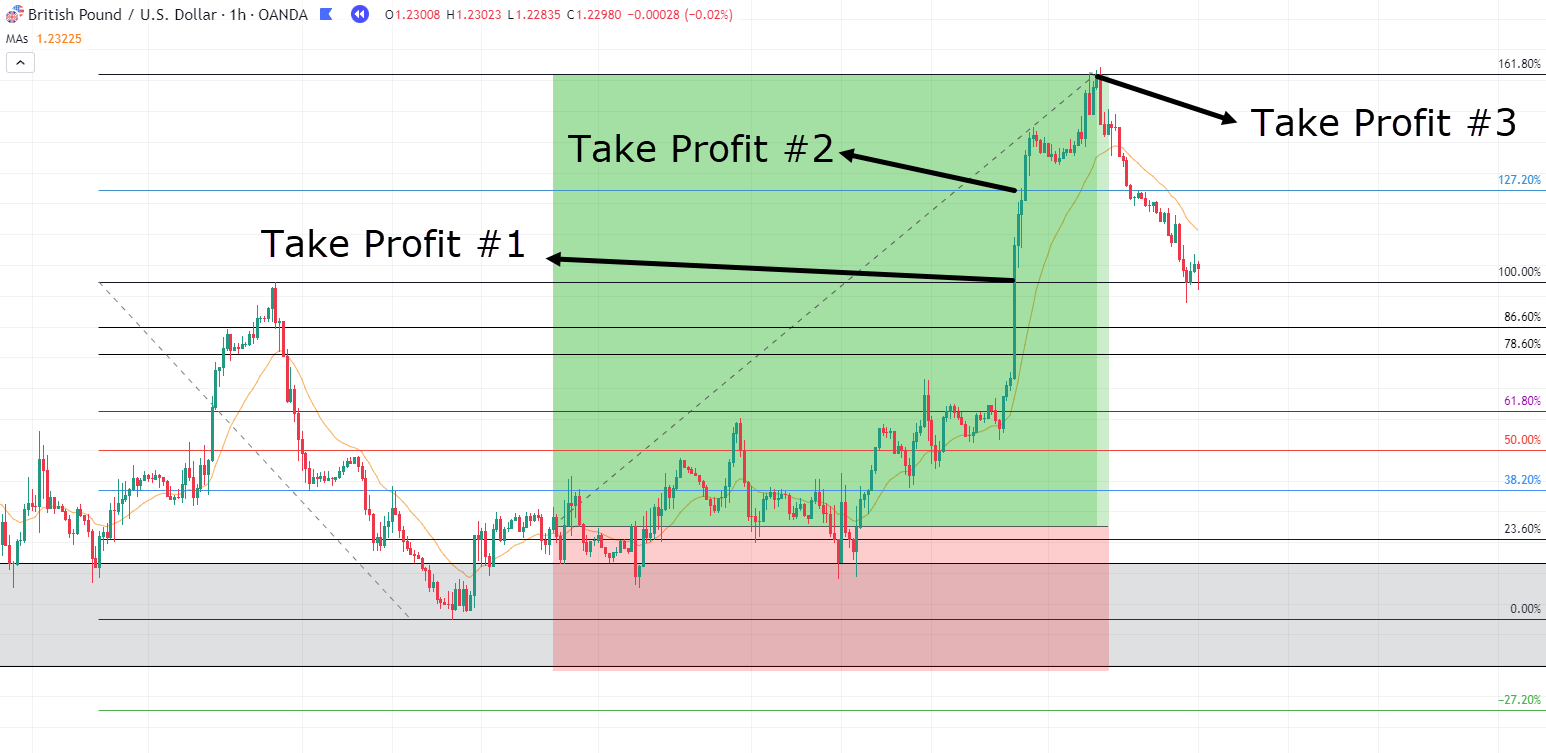
As you can see, the price eventually shifted upward and began to form a new uptrend.
Alright, to maintain realistic expectations, let’s walk through one more example!…
AUD/CAD 1-Hour Timeframe:
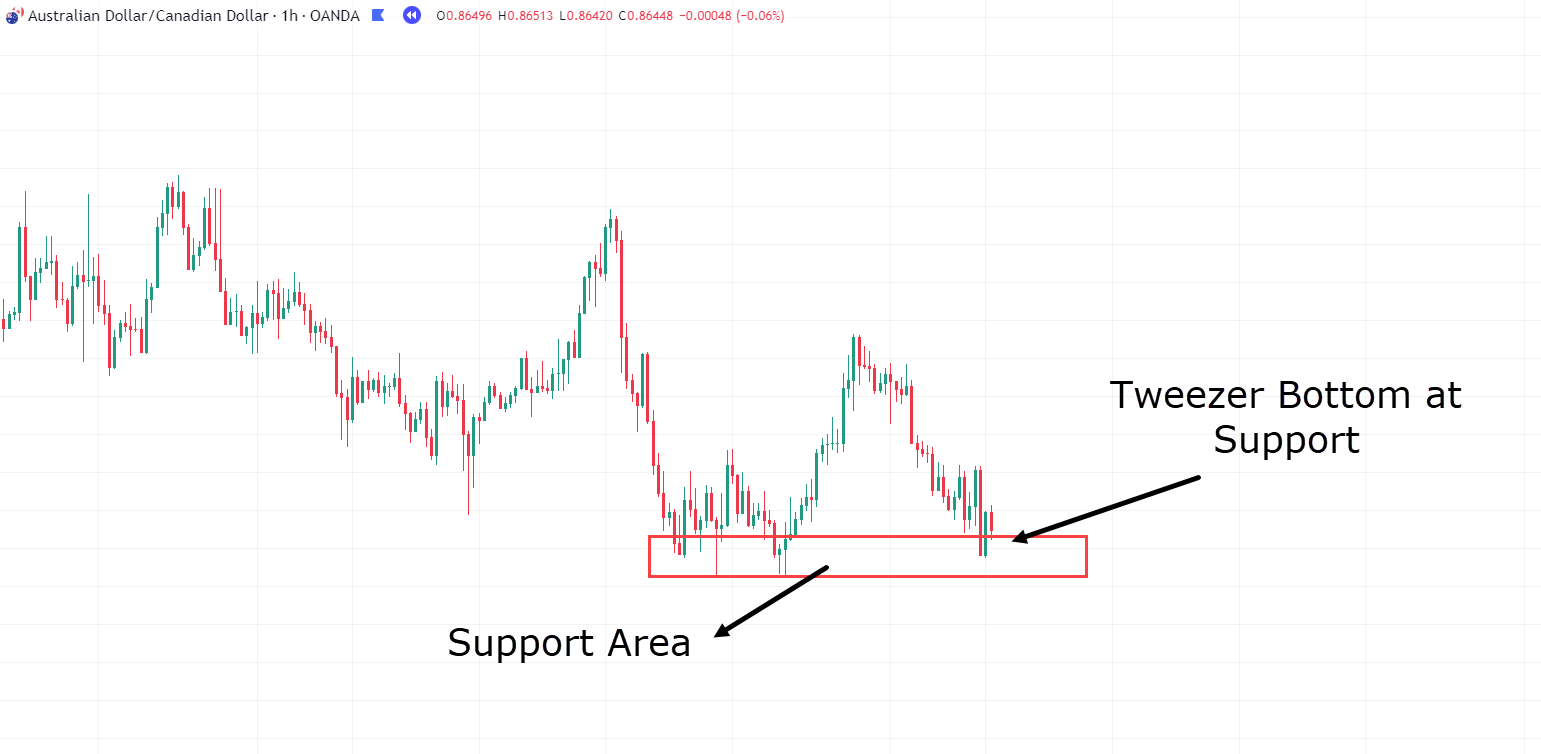
In this example, a clear support level has formed.
The most recent price action presents a reasonable trading opportunity, with the Tweezer Bottom pattern forming at support.
Let’s enter this trade…
AUD/CAD 1-Hour Timeframe Entry:
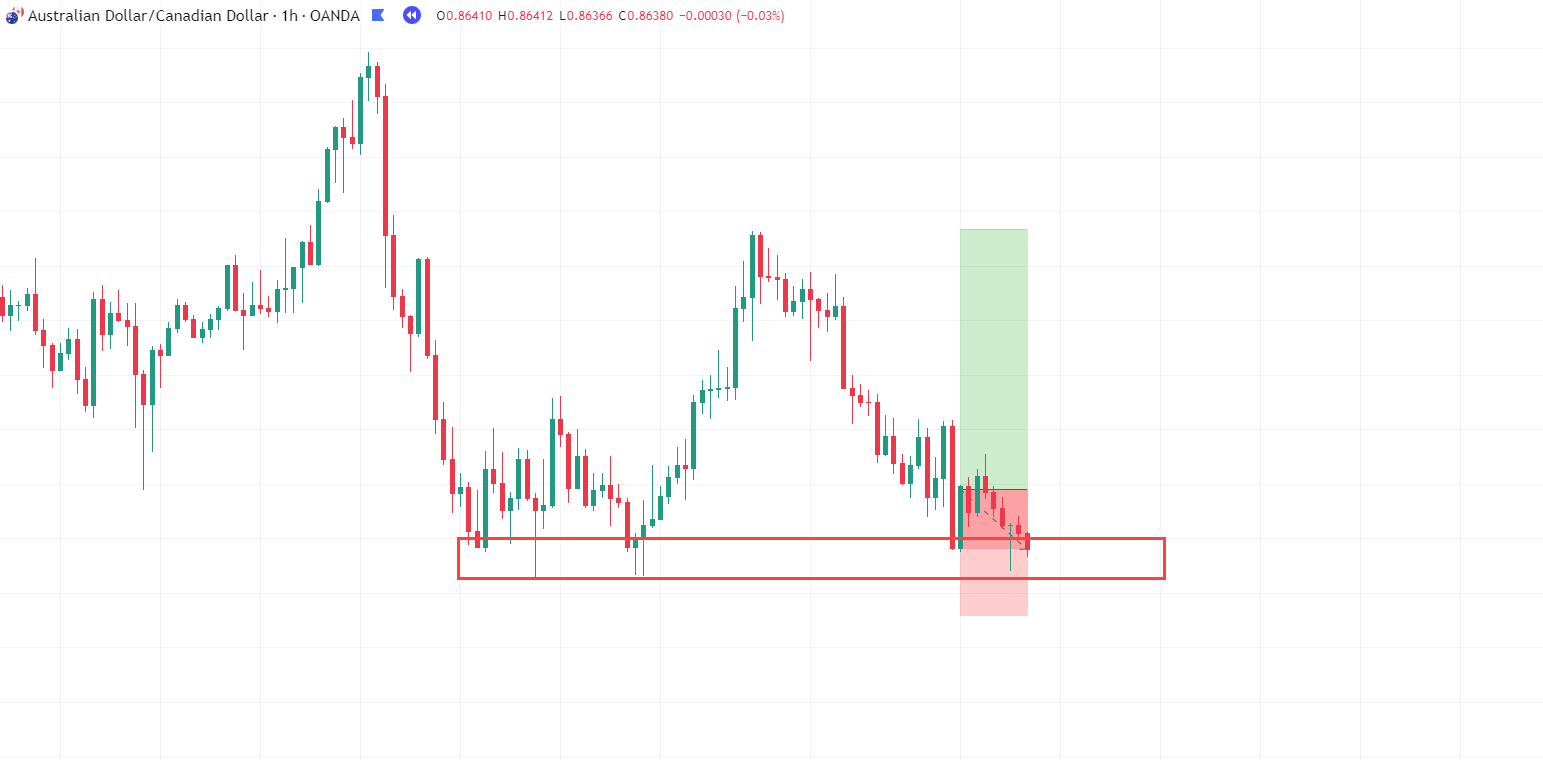
Oh no!
After the trade was entered, the price actually continued to drop!
There are a few options. Price isn’t acting the way you necessarily expected it to, but it also hasn’t closed below the support level.
This might warrant you exiting the trade early and looking for some more confirmation.
However, for the sake of this example, let’s say you stayed in the trade…
AUD/CAD 1-Hour Timeframe Stop Loss:
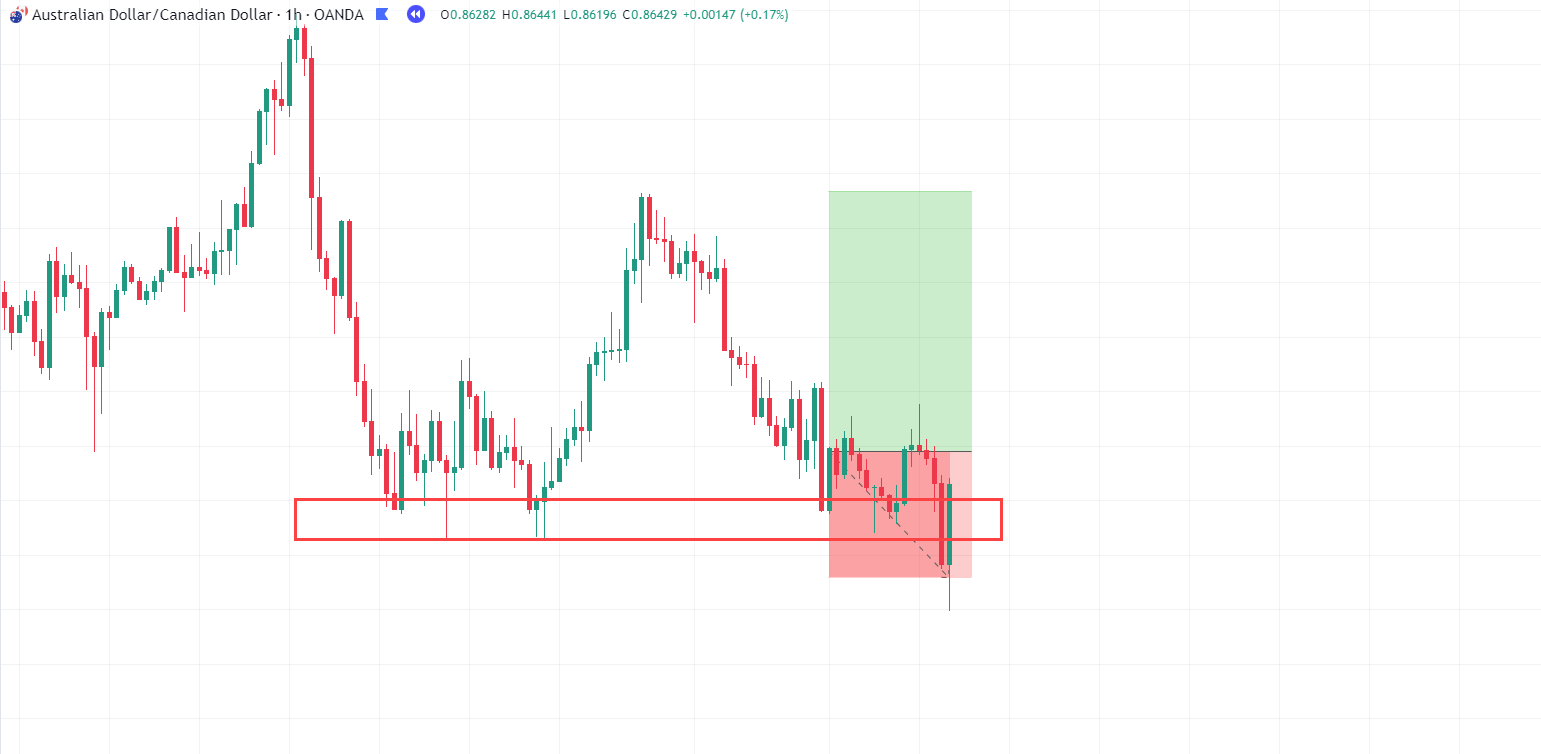
Uh oh, our gut feeling was right!
So, unfortunately, this trade didn’t work out.
But guess what?
That is okay!
…because not every trade is going to work perfectly.
The important thing here is gaining experience so you know when the trade isn’t working the way you feel it should.
As stated in the example, when the price continued lower after the entry on the Tweezer Bottom Pattern, you were presented with the opportunity to either stick with the trade or close the trade early and wait for some more confirmation.
Over time, you will better hone your skills to get the intuition to understand the secrets the market is trying to tell you. If a trade is not acting the way you expect it to, close the trade and wait for price action that makes more sense, or move to a completely different trading setup.
The market will always be there, so be patient and protect your capital!
Now that you know how to successfully trade the Tweezer Bottom Pattern, let’s look at some mistakes to avoid when trading it…
Mistakes to avoid when trading Tweezer Bottom
Don’t Use the Tweezer Bottom Pattern in Isolation
The Tweezer Bottom pattern signals a potential shift in momentum, but it’s not a standalone solution.
Enhance your success by combining the pattern with other indicators like moving averages and support/resistance levels.
When used in conjunction, it becomes a powerful tool in your trading arsenal.
Don’t rush into trades!
Patience is key when trading the Tweezer Bottom Pattern.
Waiting for additional confirmation, such as bullish engulfing patterns or reclaims of local support, increases confidence in the trade outcome.
Extra confirmation, especially when supported by buying momentum, strengthens the indication that prices will continue to rise.
So be patient and wait for a robust setup.
Exit When the Trade Isn’t Going as Planned
It’s important to recognize that the Tweezer Bottom isn’t a one-size-fits-all solution.
In the example provided, the momentum shift from bear to bull failed, and the bulls couldn’t sustain momentum in the candle following the Tweezer Bottom.
Accept that not every trade will go as expected.
If the trade isn’t unfolding as planned, consider exiting to protect your capital. Remember, certainty in trading outcomes is never 100 percent.
Conclusion
In conclusion, the Tweezer Bottom pattern emerges as a powerful tool for traders, precisely identifying moments of momentum shift from bears to bulls.
Whether applied in trending markets or to pinpoint reversals, mastering this pattern is key to trading success.
Throughout this article, you’ve acquired the knowledge to not only trade the Tweezer Bottom effectively but also to steer clear of common pitfalls.
You also saw how to adapt the pattern to diverse market conditions and gained insights into waiting patiently for optimal trade setups.
So, to summarize:
- The Tweezer Bottom vividly illustrates the transition from bearish to bullish momentum.
- How to trade the Tweezer Bottom in an already trending market.
- Knowing what signs to look for when anticipating a shift from downtrends to uptrends.
- Learning the importance of patience in trade execution and knowing when the price isn’t behaving as expected.
- Acknowledging and steering clear of the common mistakes traders often make when working with the Tweezer Bottom pattern.
With this newfound knowledge, you now possess an additional tool in your trading arsenal.
I encourage you to incorporate the Tweezer Bottom into your strategy, considering all aspects discussed here, to enhance your success rate.
So, what are your thoughts on the Tweezer Bottom Pattern?
Have you begun to grasp how it signifies a shift from bear to bull?
Have you used other candlestick patterns, like the Tweezer Top Pattern? (Maybe Link to the Tweezer Top Pattern Article)
Feel free to share your insights in the comments below!


