Do you ever recognize an uptrend but hesitate to enter a long trade?
Maybe you’re worried the price has already moved too far from the best entry point?
Or perhaps you already know how to spot regular bullish divergence and are looking for a way to find possible trend continuations…
Well, I’ve got exciting news for you!
Hidden Bullish Divergence is exactly what you need!
In this article, you’ll:
- Uncover the differences between hidden and regular divergence and understand how hidden divergence serves as a powerful tool for continuing a trend.
- Explore how hidden divergence can help you capture the remaining momentum of a trend.
- Learn simple yet effective techniques to spot hidden bullish divergence, enabling you to make better trading decisions with confidence.
- Gain practical insights by looking at real-life trading scenarios, showing you how to try out hidden bullish divergence strategies successfully from start to finish.
- Understand the limitations of hidden divergence and discover valuable tips and tricks to overcome challenges, ultimately increasing your success rate.
Ready to dive in?
Let’s start your journey to unlock the potential of Hidden Bullish Divergence!
What is Hidden Bullish Divergence?
Hidden Bullish Divergence gets its name because it’s more challenging to spot and less common among traders…
But that doesn’t mean it should be ignored!
When used correctly, Hidden Bullish Divergence provides traders with an incredible edge in the market.
To understand Hidden Bullish Divergence, it’s important to explain normal divergence first.
Bullish divergence happens when the price makes a lower low, but an indicator such as RSI, Stochastics, or MACD makes a higher low.
Now, traders interpret this as a sign that, although the price is making a lower low, the momentum behind it has started to turn bullish, and the move to the lower low is weaker than the previous one…
Bullish divergence is excellent for considering a reversal of the trend.
But, how does hidden bullish divergence occur?
Well, it happens when the price forms a higher low, and the indicator forms a lower low…
…which can be a powerful tool when the price is already trending upward!
Hidden Bullish divergence successfully represents the point in the market when momentum in an uptrend has been oversold and is ready to continue higher, with the overall trend acting as the driving force behind the buy signal.
So what else makes it different from other patterns?
What Hidden Divergence Tells Us: Continuation vs. Reversal
The primary function of Hidden Divergence is to help traders identify entry points in an already established trend.
But unlike regular divergence, which often signals a potential reversal, Hidden Divergence is a continuation setup…
It means that in Hidden Divergence trades, the goal is to capture price movements that align with the prevailing trend, allowing traders to capitalize on the momentum already in play.
Trading with the Trend!
As the saying goes, “The trend is your friend,” which also holds true when exploring the hidden divergence setup!
Aligning your trades with the existing trend enables you to ride the wave of momentum.
This method works especially well when you are looking for entry points that are strongly supported by a well-established trend…
So by trading with the trend, you position yourself favorably – right from the start!
Indicator selection
The MACD, Stochastic RSI, Stochastics, and Regular RSI are some of the most important indicators that can be used to find hidden bullish divergence.
Even though there are other indicators that can be used for divergence analysis, these are the main ones that will be shown in the examples.
What does Hidden Bullish Divergence Look Like?
Well, now that you understand the concept of hidden bullish divergence, let’s delve into the specifics of what you should be looking for as a trader to identify this pattern.
When there is regular bullish divergence, the price makes a lower low and the oscillator or indicator makes a higher low…
On the other hand, hidden bullish divergence presents a variation.
In this case, the price establishes a higher low, but the indicator forms a lower low instead.
Let’s visualize this with a diagram…
As can be seen, the price makes a series of lower lows at first, but eventually, it makes a higher low.
…and at the same time, the indicator records a lower low.
This scenario signifies a hidden bullish divergence!
Let’s explore another example to solidify the concept…
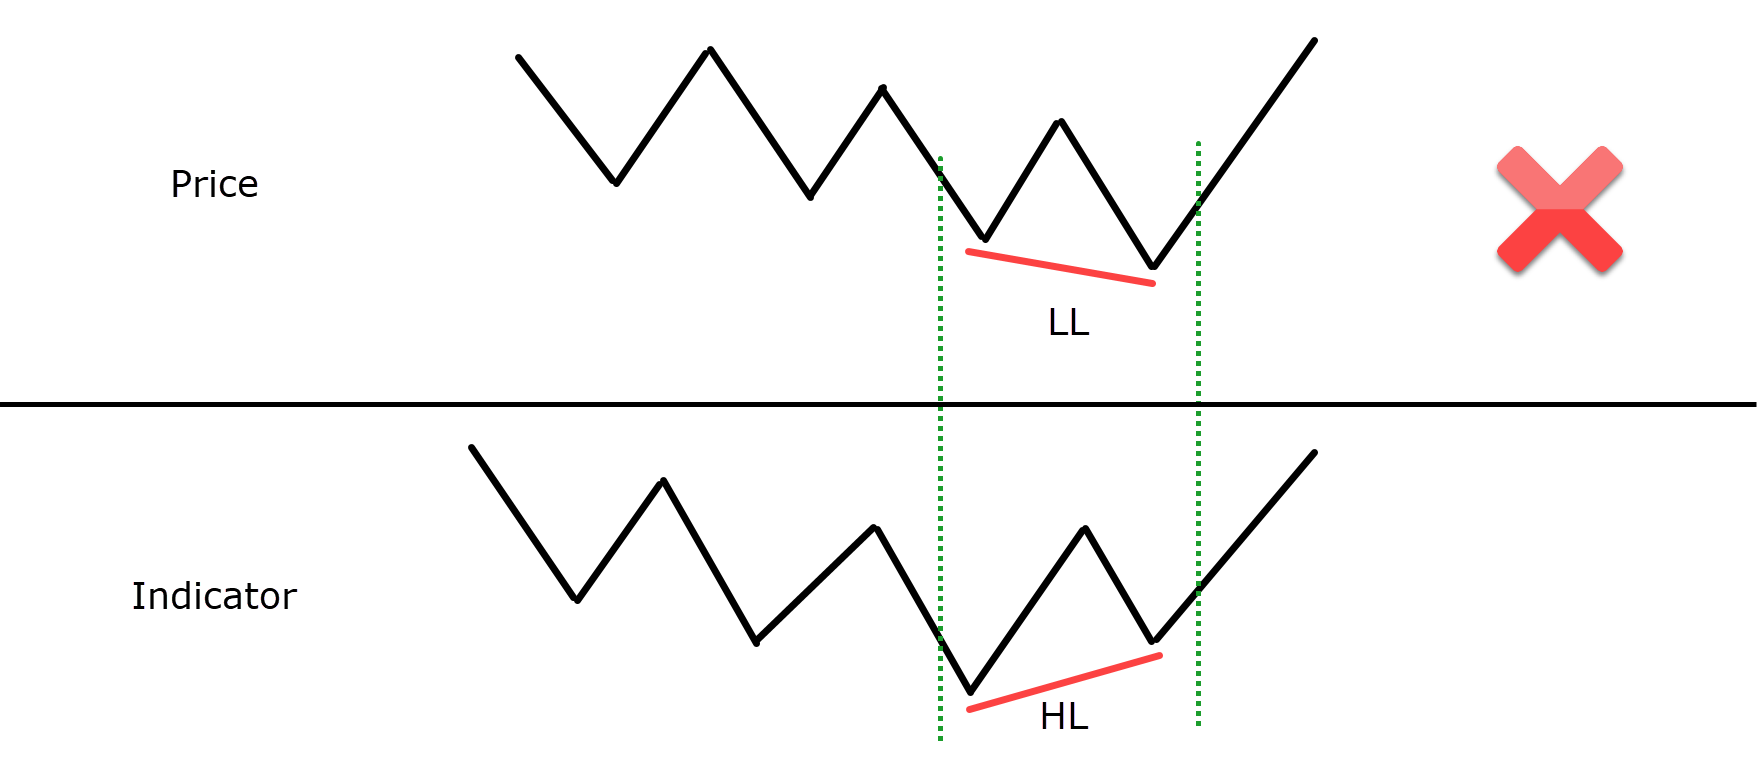
OK, so, what’s wrong with this example?
That’s correct!
It’s not actually a hidden bullish divergence…
…in fact, it’s a regular bullish divergence!
Of course, this is not what you want when looking for the setup for trend continuation that hidden bullish divergence shows!
Now that you have the concept down, let’s look at some examples on real charts to see what you’ll be looking for when making trades…
How to trade hidden bullish divergence
Let’s explore some real-life trading scenarios in which you could apply the Hidden Bullish Divergence strategy…
GBP/USD 4-Hour Timeframe Chart:
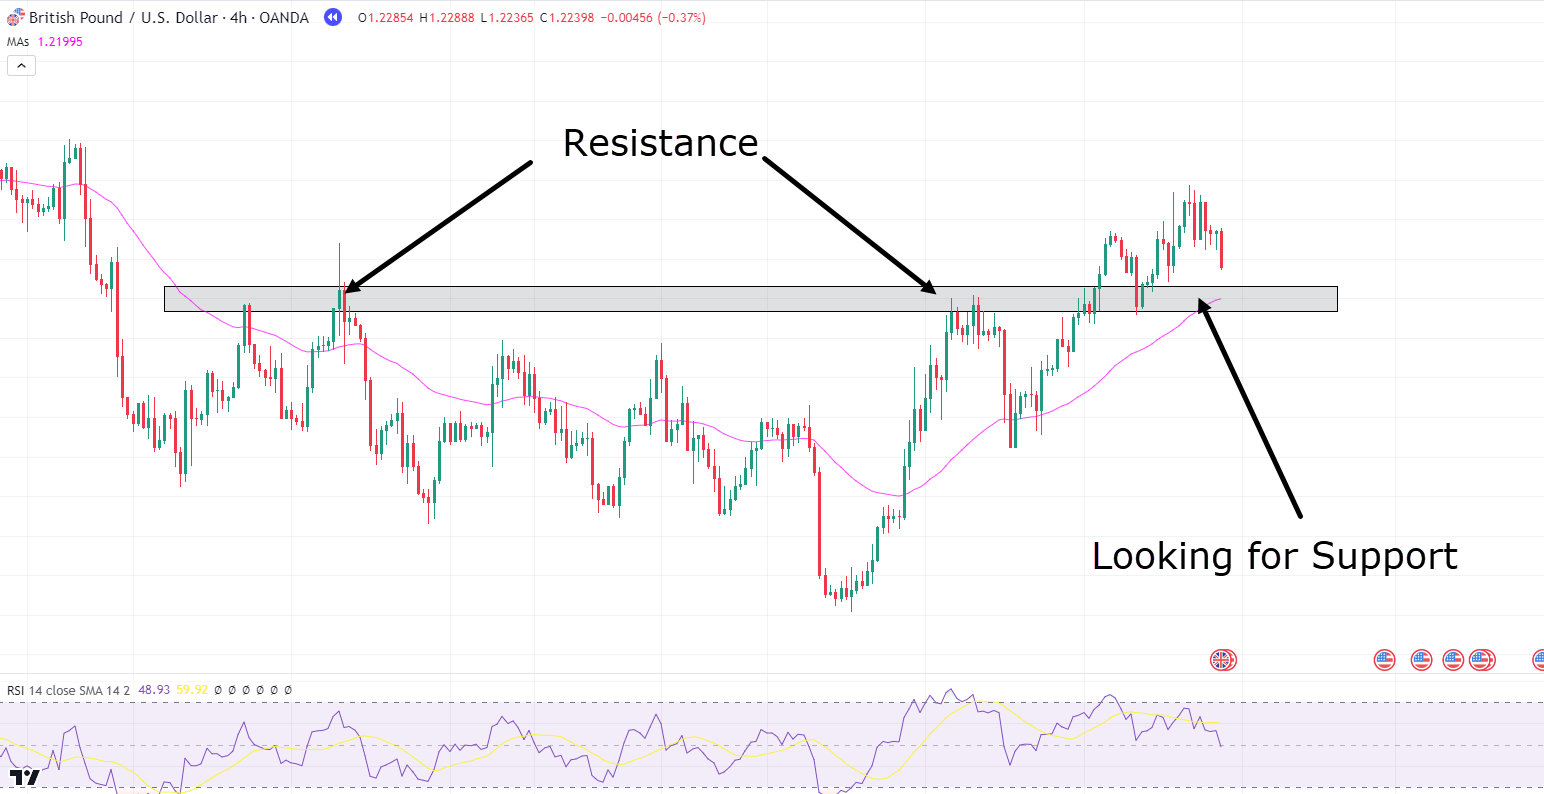
Take a closer look at this chart.
For this example, I am using the RSI indicator in the default settings.
As you can see, the price has formed a clear resistance level on the 4-hour timeframe…
Once the resistance was broken, the price came back to retest the zone and successfully bounced, creating a fresh support zone after the Support/Resistance flip…
Let’s look for an entry at this zone using hidden bullish divergence…
GBP/USD 4-Hour Timeframe Hidden Bullish Divergence:
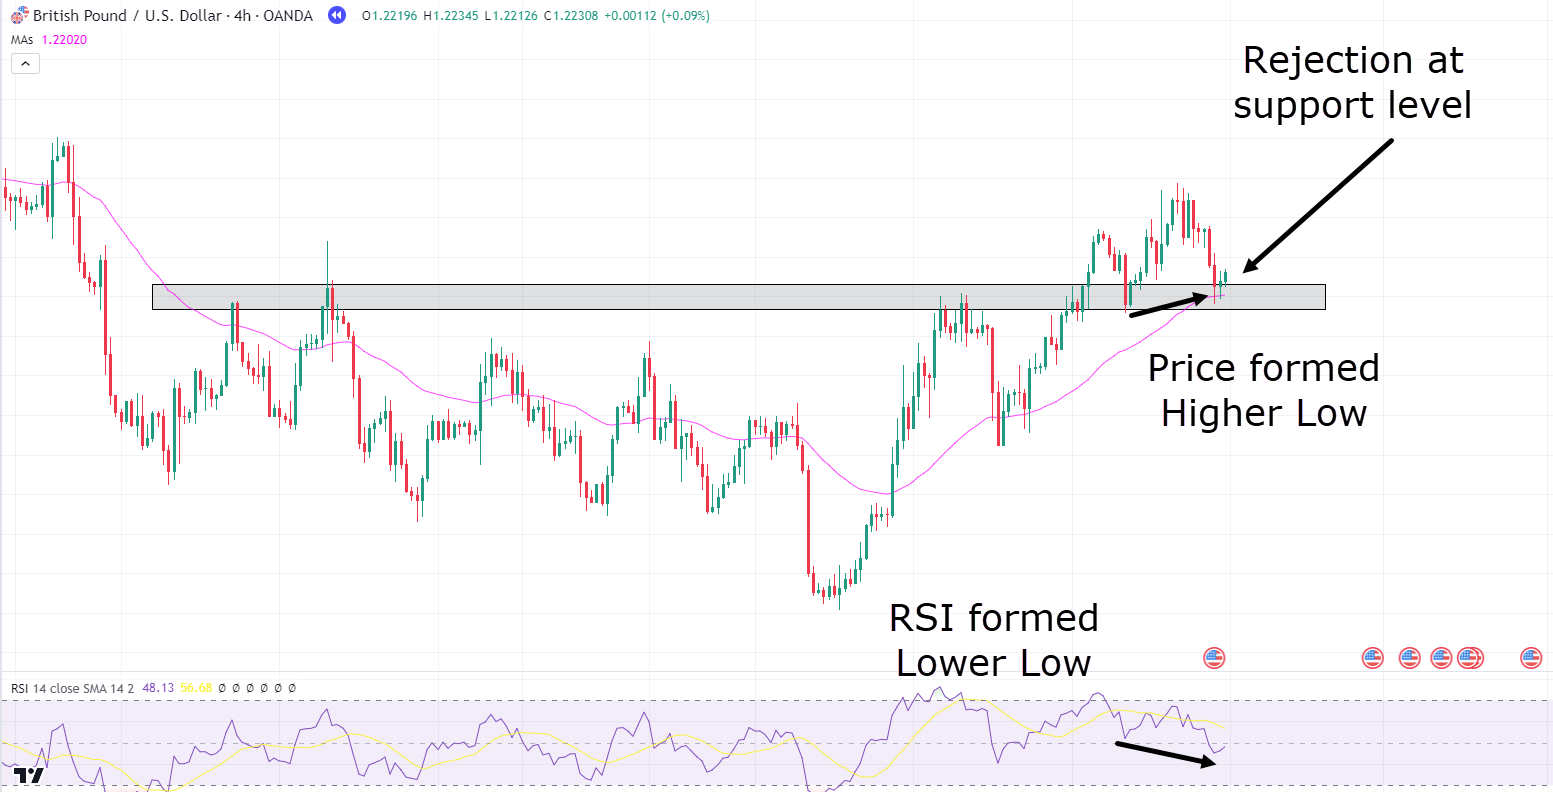
As you can see here, the price has started rejecting at the zone with some hammer candlesticks.
But what’s more important is that our RSI indicator has formed a lower low, while the price has formed a higher high!
This is a prime example of a potential Hidden Bullish Divergence setup using a support level in a new uptrend…
In fact, several factors favor this trade, providing added confidence to take the trade:
– The trend is in favor
– Hidden Bullish Divergence has occurred, signifying continuation
– The support level is being tested
– …and rejection candles show that the price is holding the support level!
Okay, so how would you go about taking this trade?
Let’s take a look!…
GBP/USD 4-Hour Timeframe Chart Entry Scenario #1:
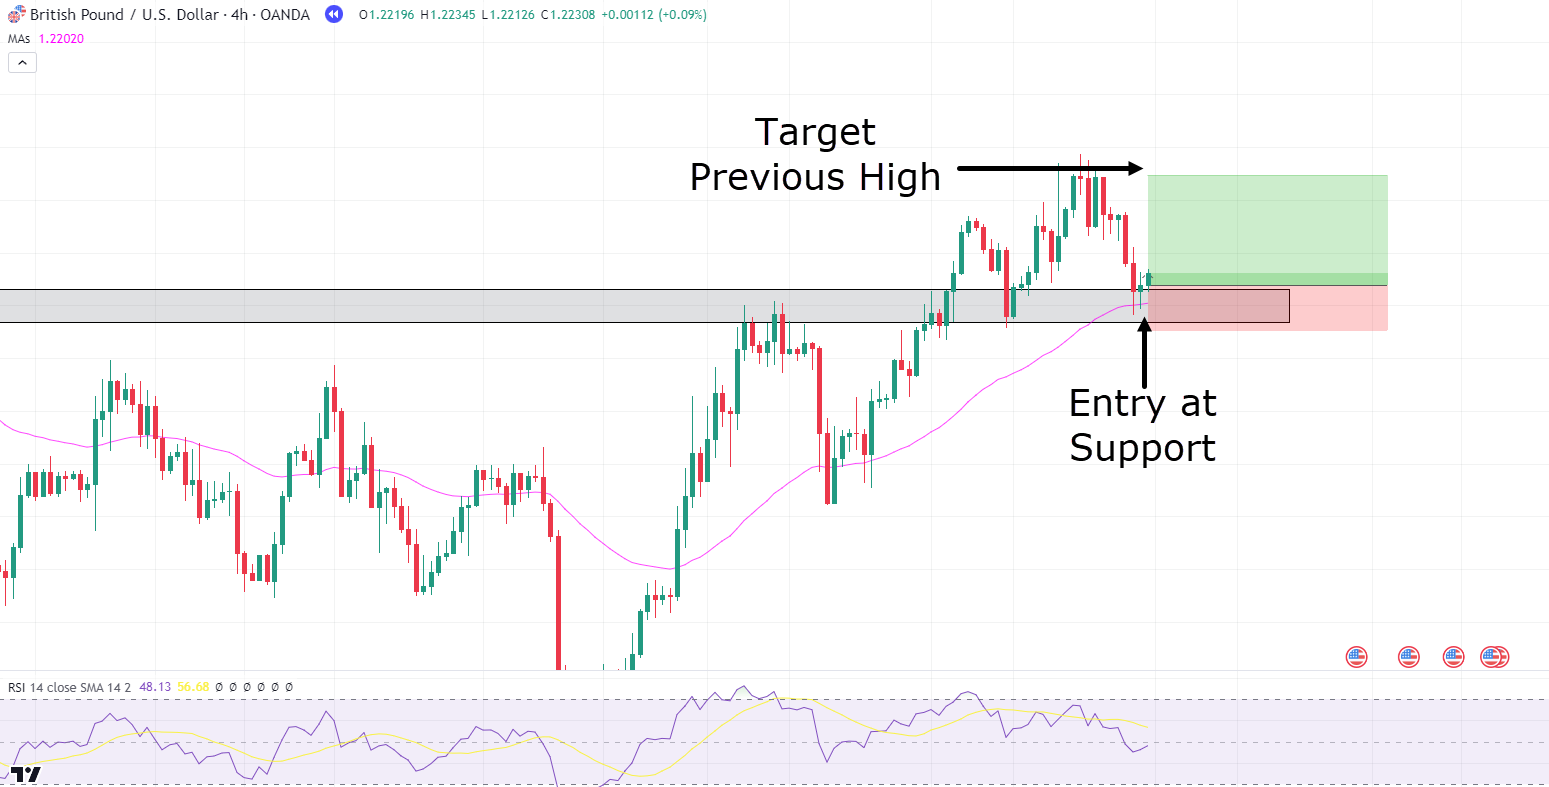
In this first scenario, you could place your stop loss just below the 50 Moving Average and also the support zone…
If the price falls below these levels, the retracement will likely continue deeper below the zone, back to some other area of value.
You could place your take profit at the previous high…
This allows for a quick and easy trade, enabling you to capture profits swiftly with an in-and-out trade.
Let’s take a look at the result!…
GBP/USD 4-Hour Timeframe Chart Scenario #1 Take Profit:
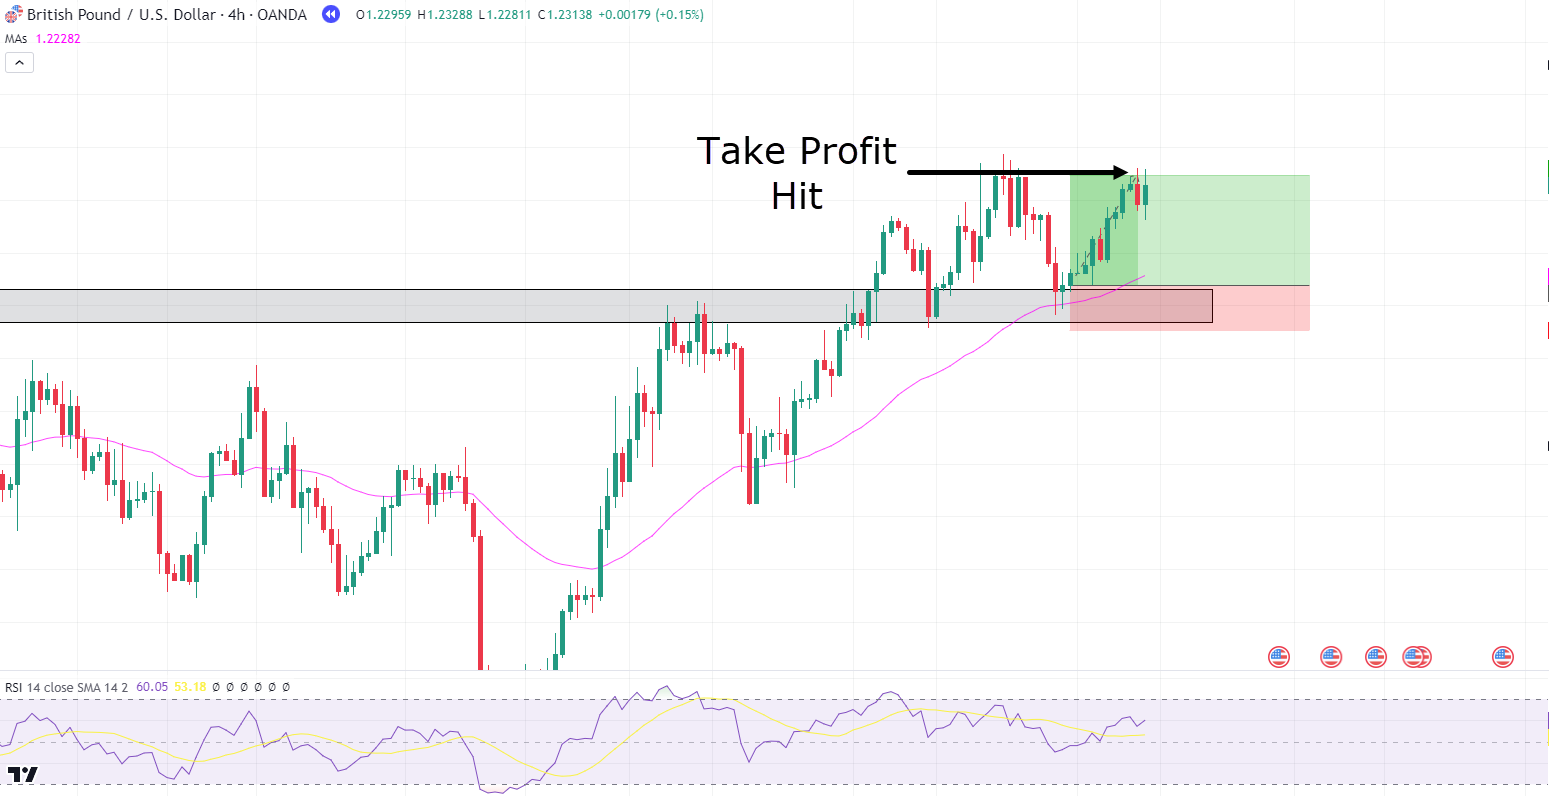
Nice trade!
This could have yielded around a 2RR trade from simply targeting the previous high, which is a modest and realistic target.
Another viable exit strategy is using a trailing stop below the moving average, especially if you want to try to capture the trend for a substantial move.
Let’s take a look at what would occur if you used this method in scenario #2…
GBP/USD 4-Hour Timeframe Chart Scenario #2 Take Profit:
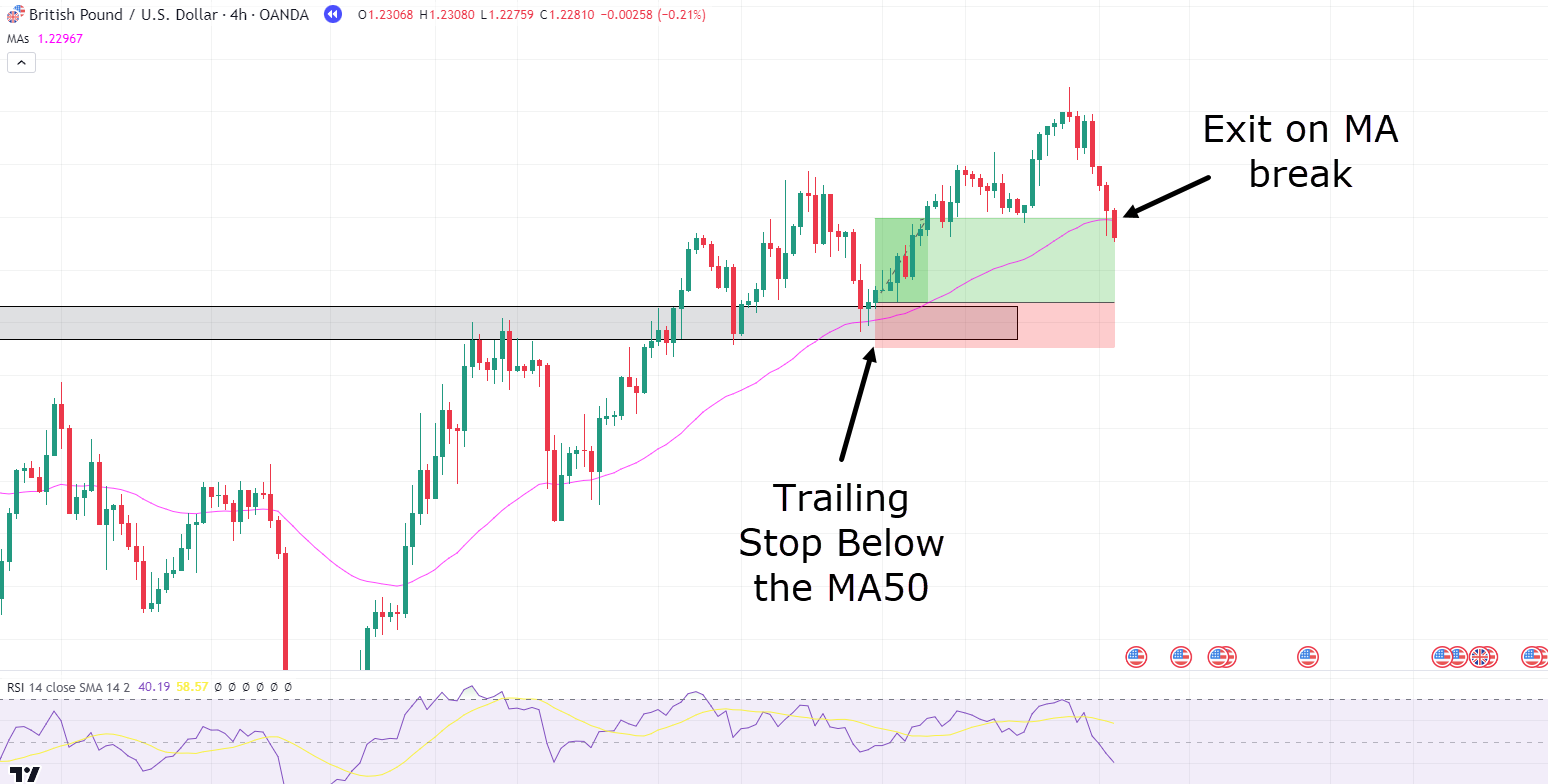
As you can see, the price did continue further than the previous high!
However, as the price retraced, the trailing stop loss had not caught up to the recent move higher, meaning this trade would have actually yielded less return than scenario 1.
So, is one method better than another?
Well… just because, in this example, taking profits at the previous high turned out to yield better results, it is vital to understand that using the trailing stop in this way often allows you to capture the trend, especially if it starts to move strongly in your favor.
Let’s take a look at another example to illustrate this point!…
NZD/JPY 4-Hour Timeframe Chart:
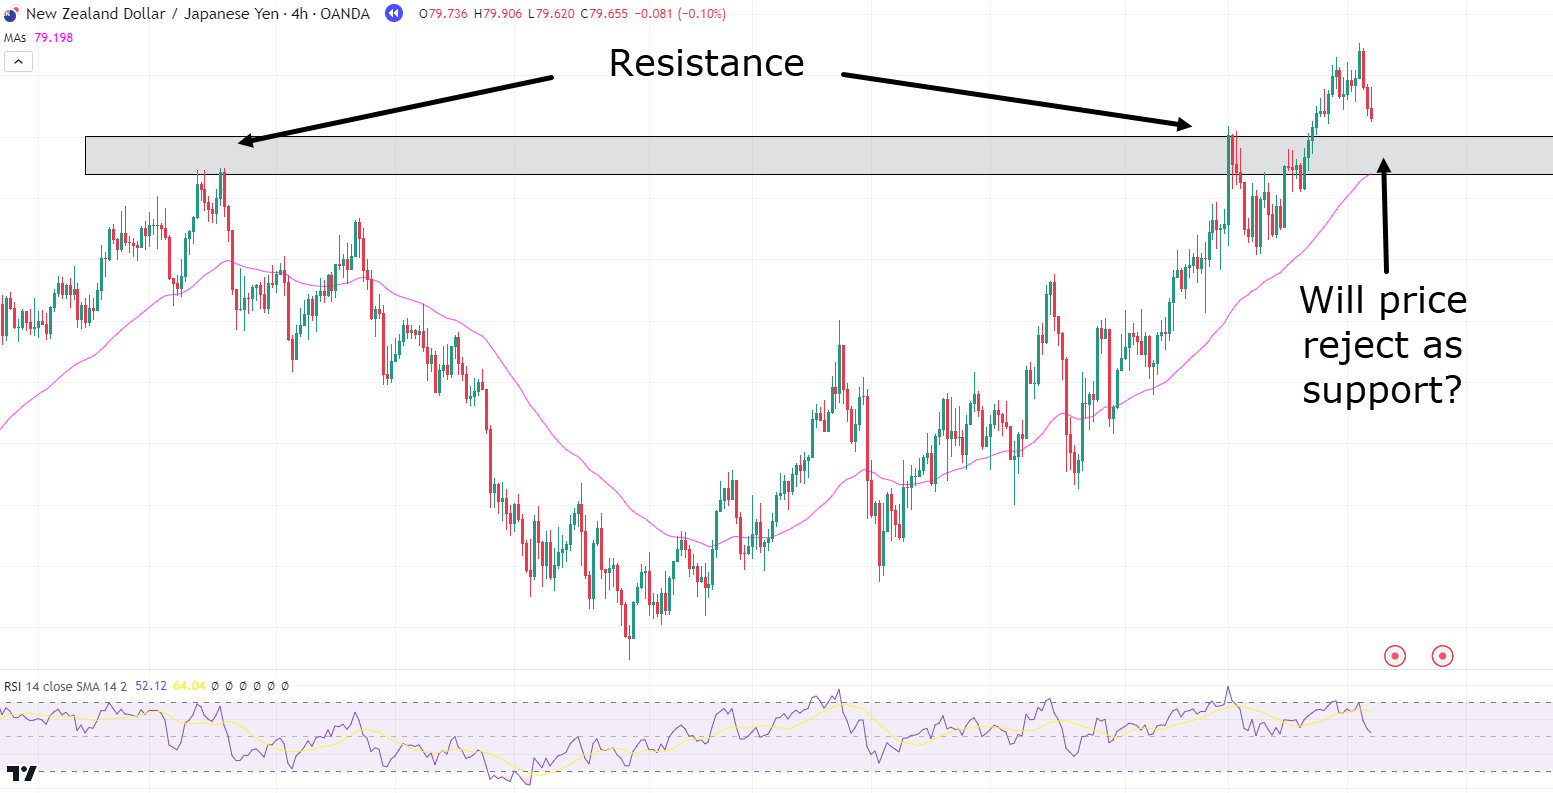
Here you have a very similar situation to the previous example.
Price has created a clear resistance zone…
At this point, you are looking for the price to come back and turn the resistance into support while also observing if some hidden bullish divergence occurs…
NZD/JPY 4-Hour Timeframe Chart Hidden Bullish Divergence:
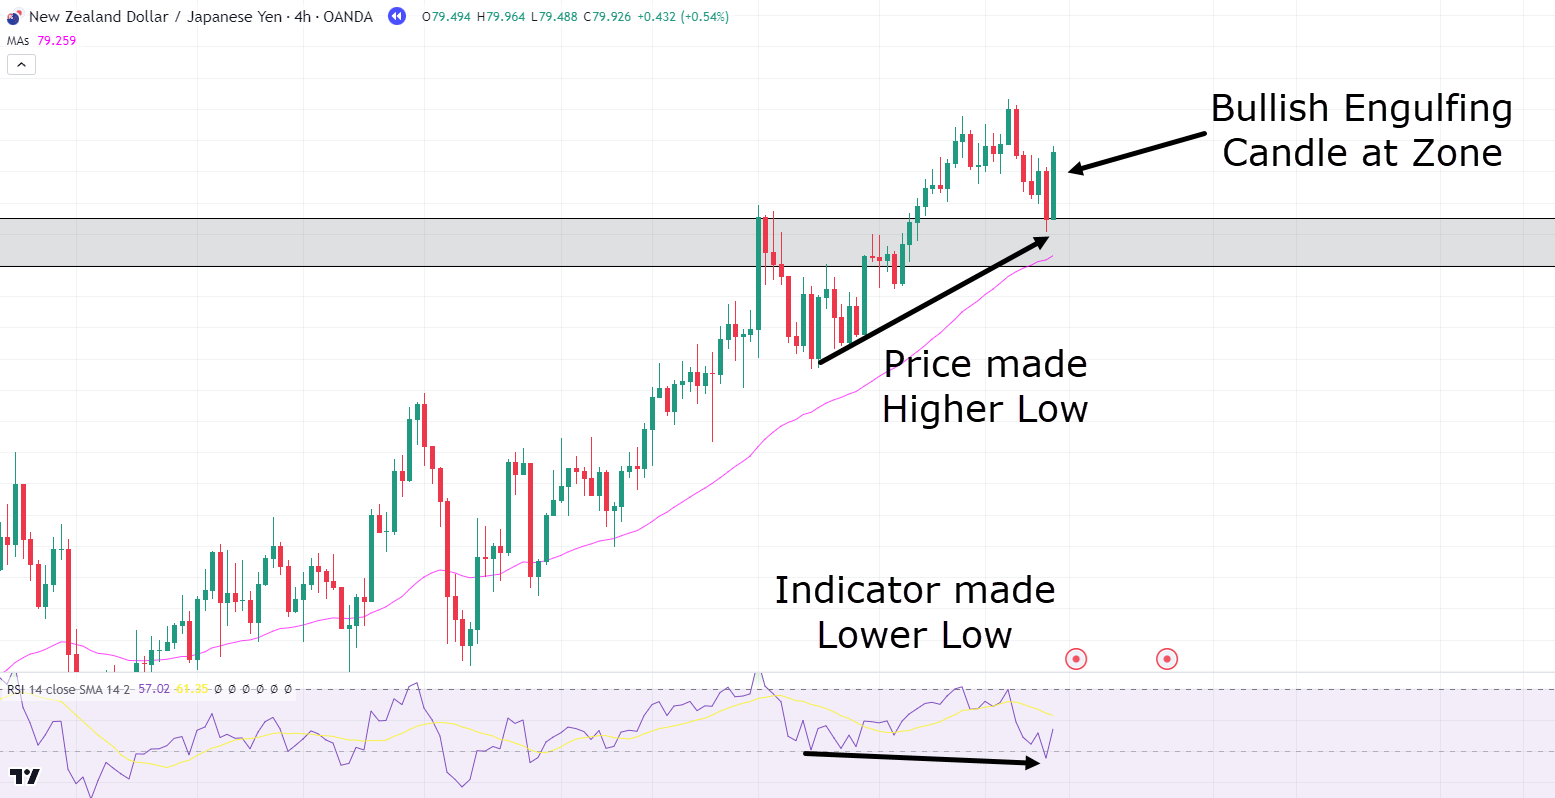
Look at that!
Price made a higher low, and the indicator made a lower low on the RSI indicator panel.
You can also spot the bullish engulfing candlestick right at the zone, which helps identify that the zone has buyers holding it as support…
Let’s take a buy!…
NZD/JPY 4-Hour Timeframe Chart Entry:
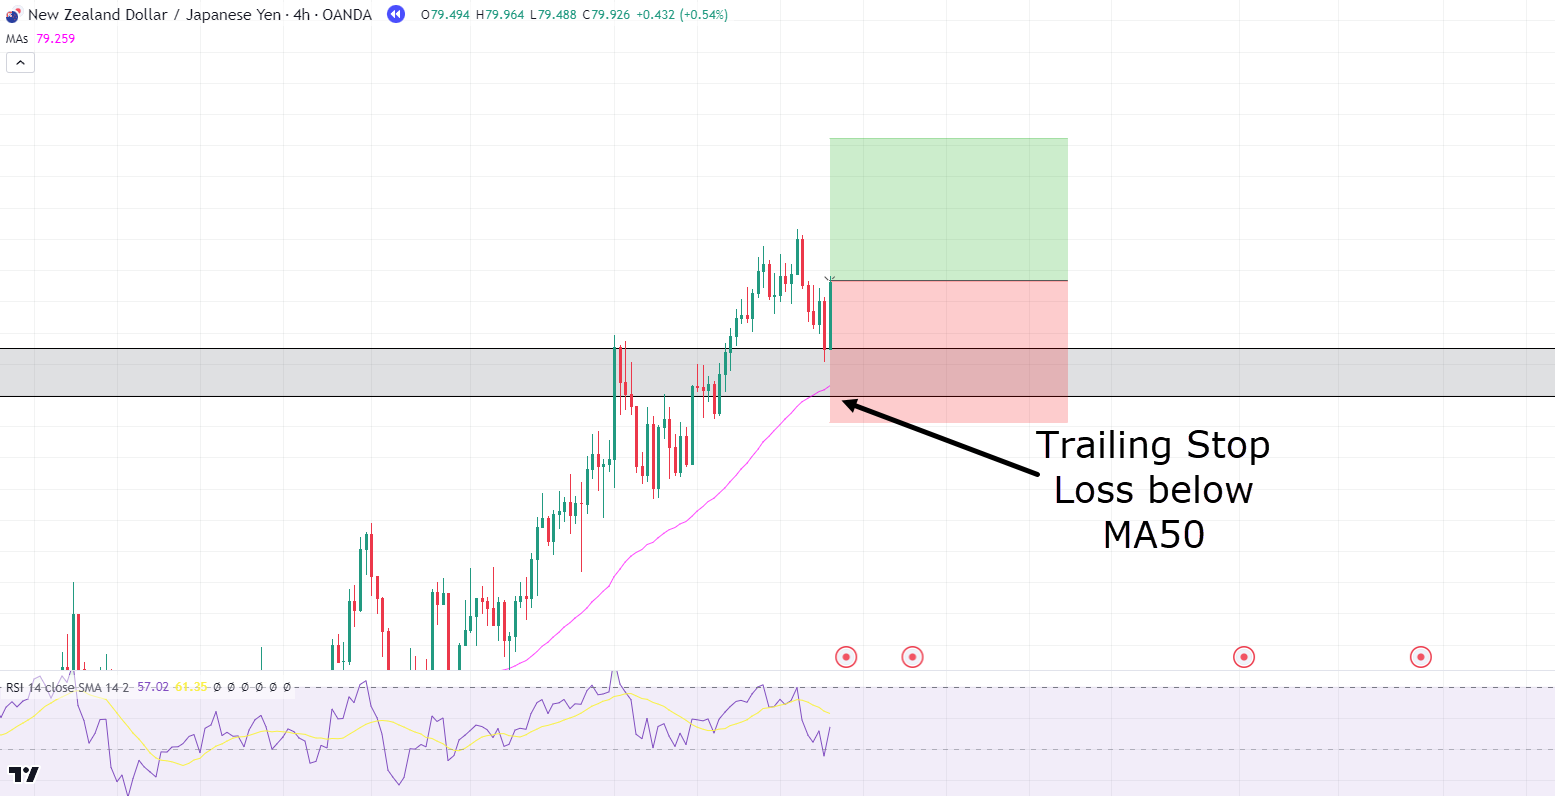
Let’s also enter the trade after the bullish engulfing candlestick and place a trailing stop just below the MA50, so any breach of it results in an automatic stop loss or take profit…
NZD/JPY 4-Hour Timeframe Chart Entry:
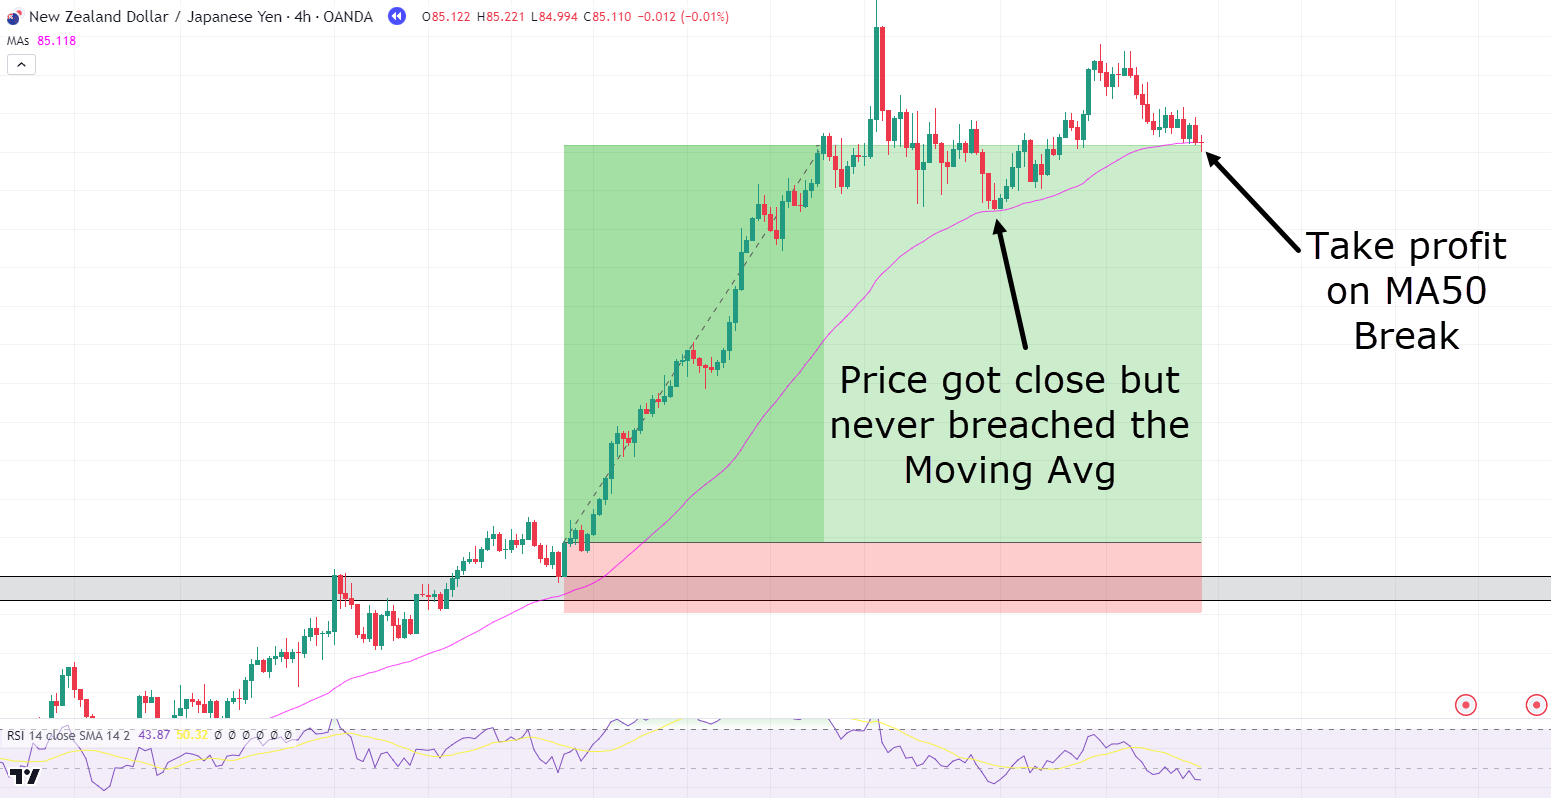
Wow, Congratulations!
You just captured a major trend using the Hidden Bullish Divergence strategy!
Can you see how Price almost breached the MA but actually treated it as support?
Then, the price went on to try to make a new high and failed… before breaching the moving average!
This trade would have yielded anywhere from a 4 to 6 RR, depending on how tightly you trailed the stop loss.
Of course, it’s important to understand that not all trades are going to pan out like this…
…but if you can capture a couple of these, you are well on your way to successfully trading hidden bullish divergence!
Let’s look at one more example to keep expectations realistic…
CAD/JPY 4-Hour Timeframe Chart Entry:
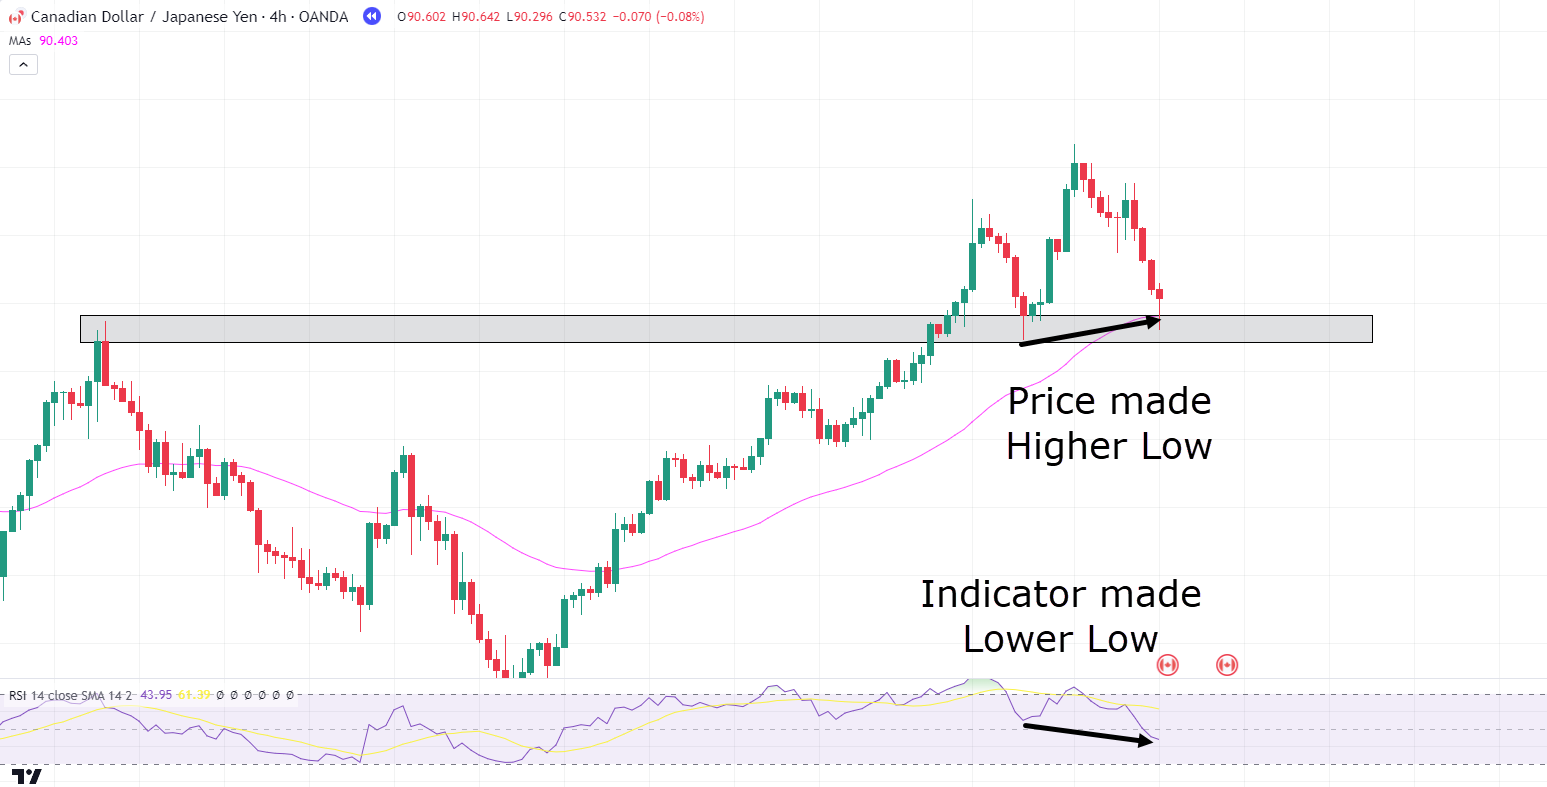
Just like all previous examples, this setup is the same…
Hidden Bullish divergence has occurred at a key area of value!
Let’s take the trade and see what happens if you trail the stop using the Moving average again…
CAD/JPY 4-Hour Timeframe Chart Exit:
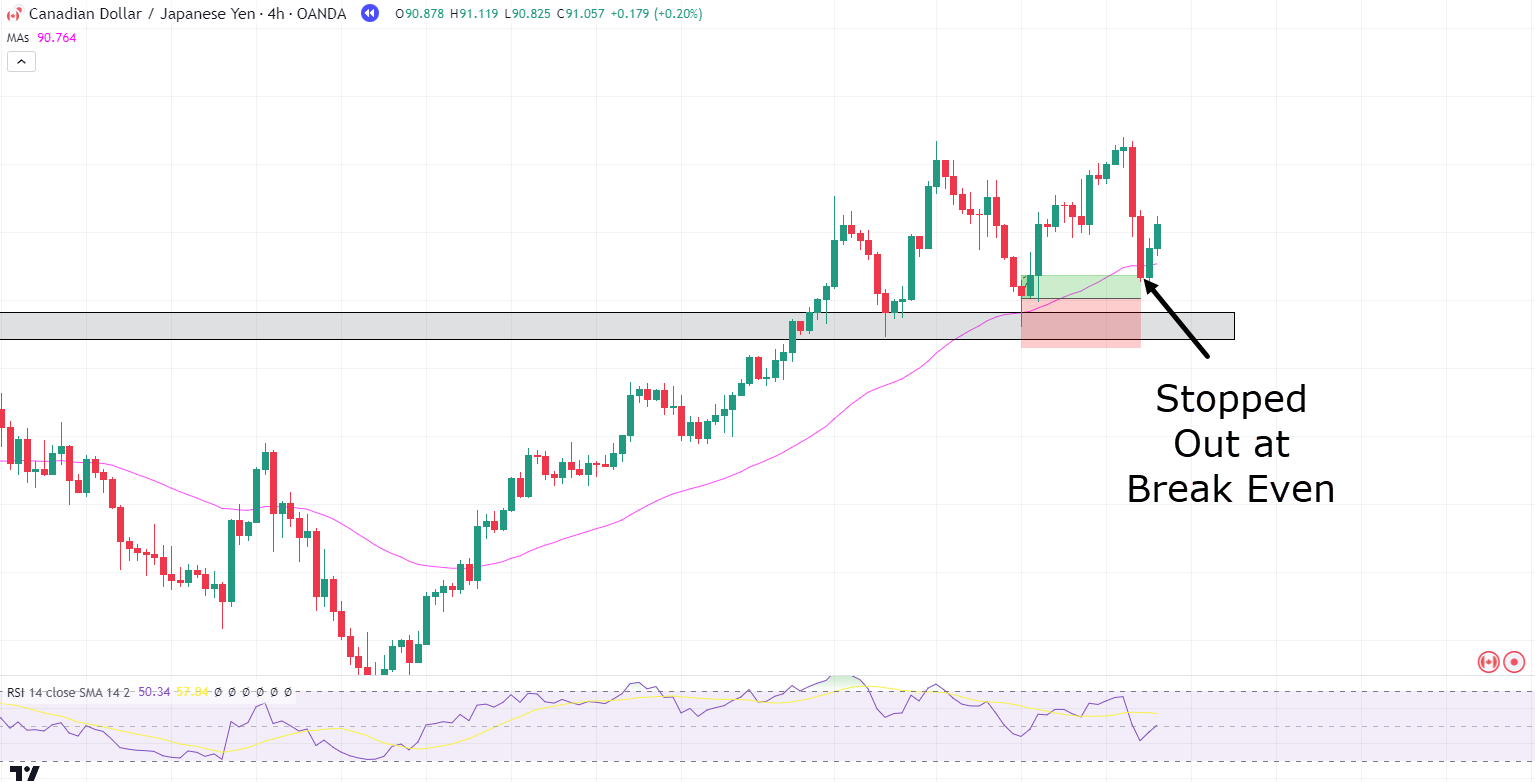
Oh no!
Price didn’t continue in this uptrend and broke below the moving average, barely making any profit.
Well, this is going to occur sometimes… but that’s okay!
Let’s try again, this time in the 1-hour timeframe!…
GBP/CHF 1-Hour Timeframe Chart Entry:
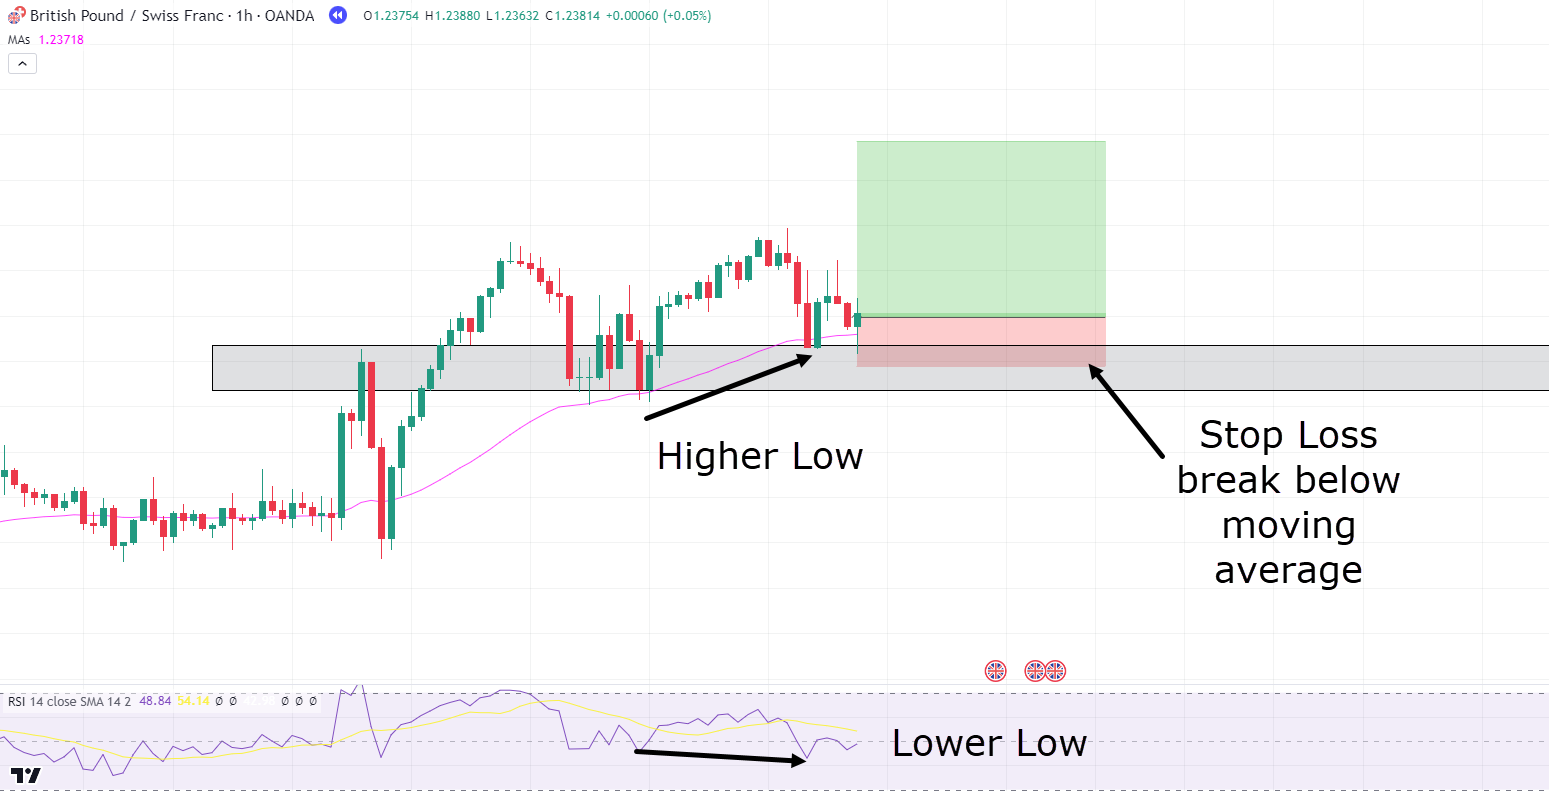
Just like in previous examples, the price has undergone a Support/Resistance (S/R) flip, and I’m utilizing the Moving Average as a guide for support along with the trailing stop loss.
In this instance, the price formed a higher low while the indicator created a lower low…
So for this example, let’s assume I believe that the bullish trend is in full swing and want to capture as much profit as possible – by leaving the trade open until a candle closes below the moving average.
How did this trade unfold?…
GBP/CHF 1-Hour Timeframe Chart Exit:
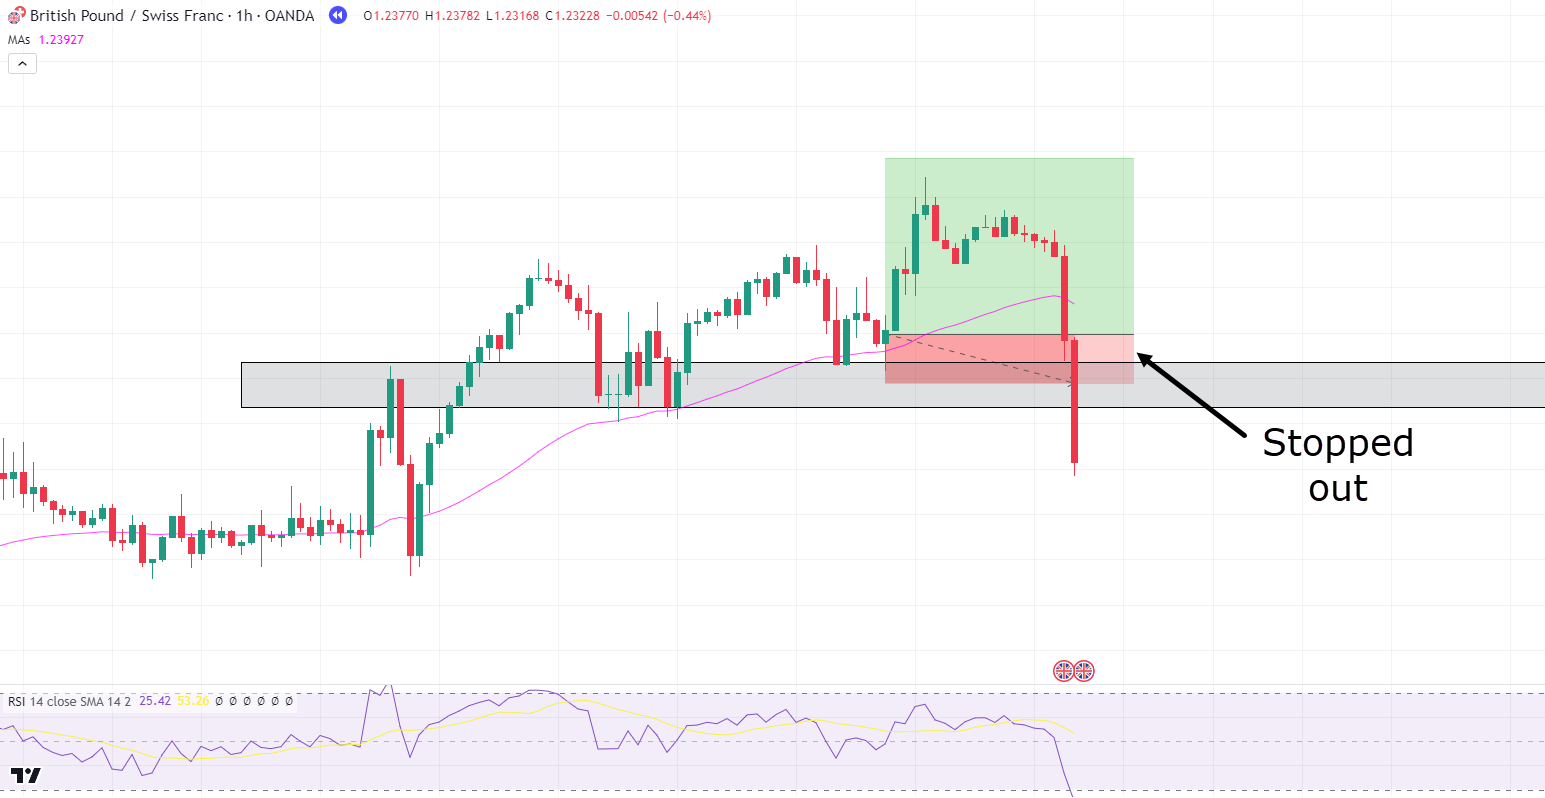
Unfortunately, another loss occurred!
But what if I told you this was a good thing?
OK ok, I hear you…
“Why’s that Rayner!?”
“How could I possibly be happy about a loss!!”
Well, I am not asking you to be happy as such but consider this loss as an important opportunity for learning…
Let’s delve into it…
GBP/CHF 1-Hour Timeframe Chart Analysis:
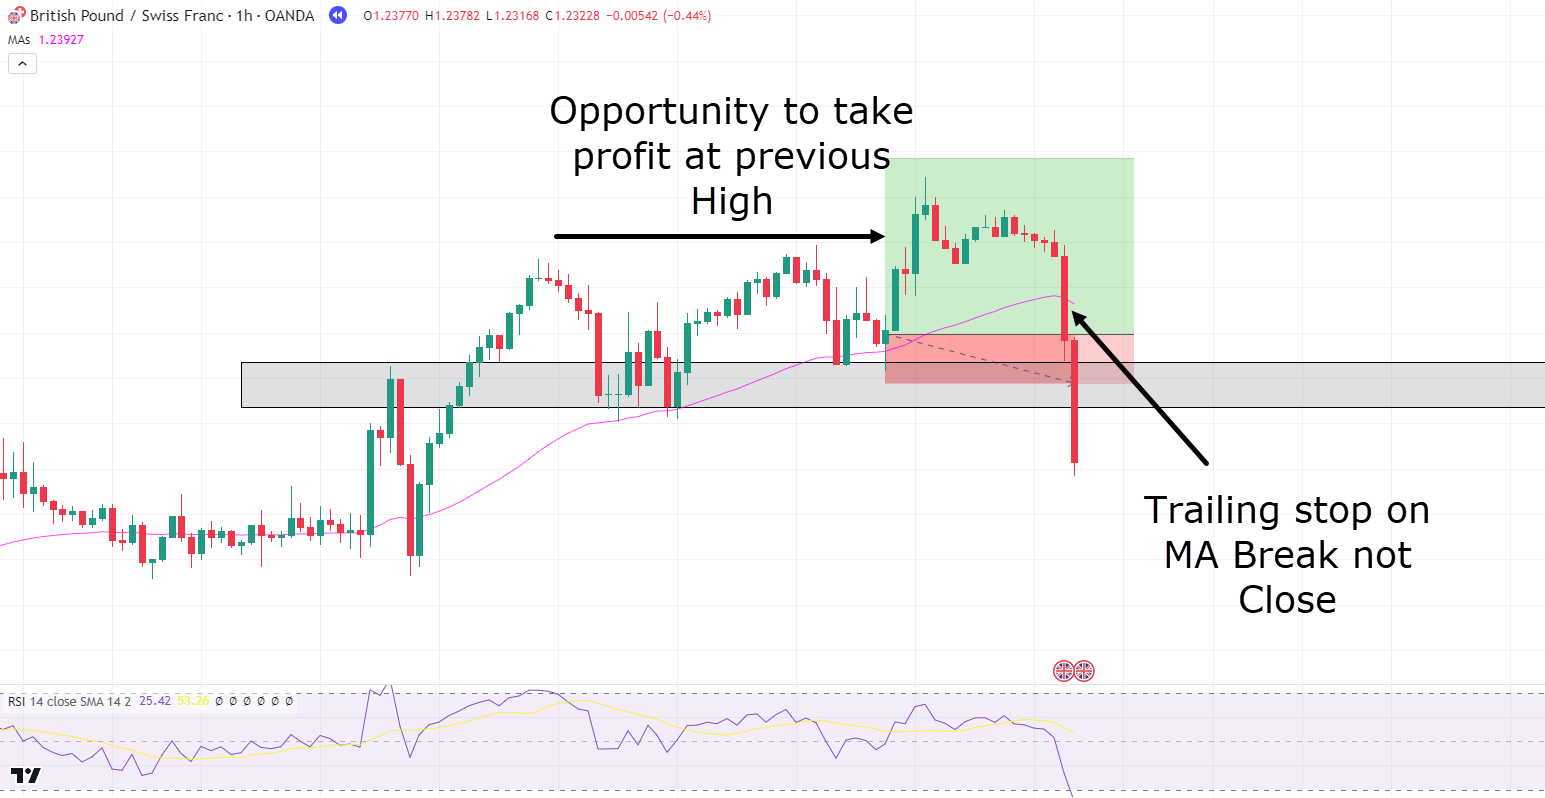
An analysis reveals that there was an opportunity to take profits at the previous high, resulting in a pretty positive trade outcome…
And while it might not have been the coveted 5RR that traders dream of, seizing the profits offered by the market is often a wise move…
Alternatively, if you had waited for the break of the Moving Average with an automatic trailing stop, the trade would have been stopped out during the first substantial bearish engulfing candle, as it started to breach below the moving average…
Exiting with the trailing stop, then, instead of waiting for the candle’s close, could have prevented a losing trade.
Alright, I know – it wouldn’t have been a trade to boast about!…
…but capital protection is paramount in this business, right?
Remember, risk management is key.
It’s crucial to accept that the Hidden Bullish Divergence strategy won’t always unfold as expected…
…or any other pattern for that matter!
Losses are inherent in trading; but you can at least control the extent of your losses.
Upon analyzing our unsuccessful trades, it becomes apparent that the strategy itself isn’t often the issue—it’s how you manage it!
As such, the Hidden Bullish Divergence strategy provides a framework to limit risk while maximizing potential profit.
There are some other flaws too, of course…
Limitations
Let’s discuss some of the limitations that come with the use of Hidden Bullish Divergence.
Can be Hard to Spot:
Unlike standard Bullish divergence, hidden bullish divergence (understandably!) gets its name from the fact that it is actually quite hard to spot!
Looking for a lower low on the indicator can be challenging…
…especially in an uptrending market when the majority of the momentum is pushing the indicator and price upwards.
Which brings me to the next point!
Relatively Uncommon:
Hidden Bullish Divergence is uncommon compared to standard divergence.
When it happens, it can be a helpful tool, but because of the setup’s nature, identifying and using it effectively takes a little more time and thought…
Can’t Be Used in All Market Conditions:
This follows from the previous limitation, as hidden bullish divergence is relatively uncommon.
You, as the trader, are only looking for this pattern to occur in an uptrending market.
This means you can only really use this strategy when looking at an uptrend.
Late Entry
One of the hidden bullish divergence’s strengths is that it requires a lot of confirmation before giving you a buy trigger.
However, this can also lead to another limitation in that by the time the required confirmation is confirmed, the price may have already moved a significant distance away from the best entry or the start of the trend.
Realistic Expectations:
Like any strategy, it does not guarantee a 100% win rate.
Any indicator or method will have its limitations, and expecting these trades to be successful every time is unrealistic!
It is vital to practice different methods and indicators for the Hidden Bullish Divergence strategy to determine what works best for your timeframe and assets.
Tips and tricks to increase success rate
As noted, it’s important to recognize that not all trades will end in success.
However, there are valuable tips and tricks to help you stay out of trades until further confirmation, increasing the likelihood of a win…
Indicator Crossover
Let’s start with the Indicator Crossover.
Some indicators used for divergence have two lines that cross over each other…
Stochastic RSI Crossover example:
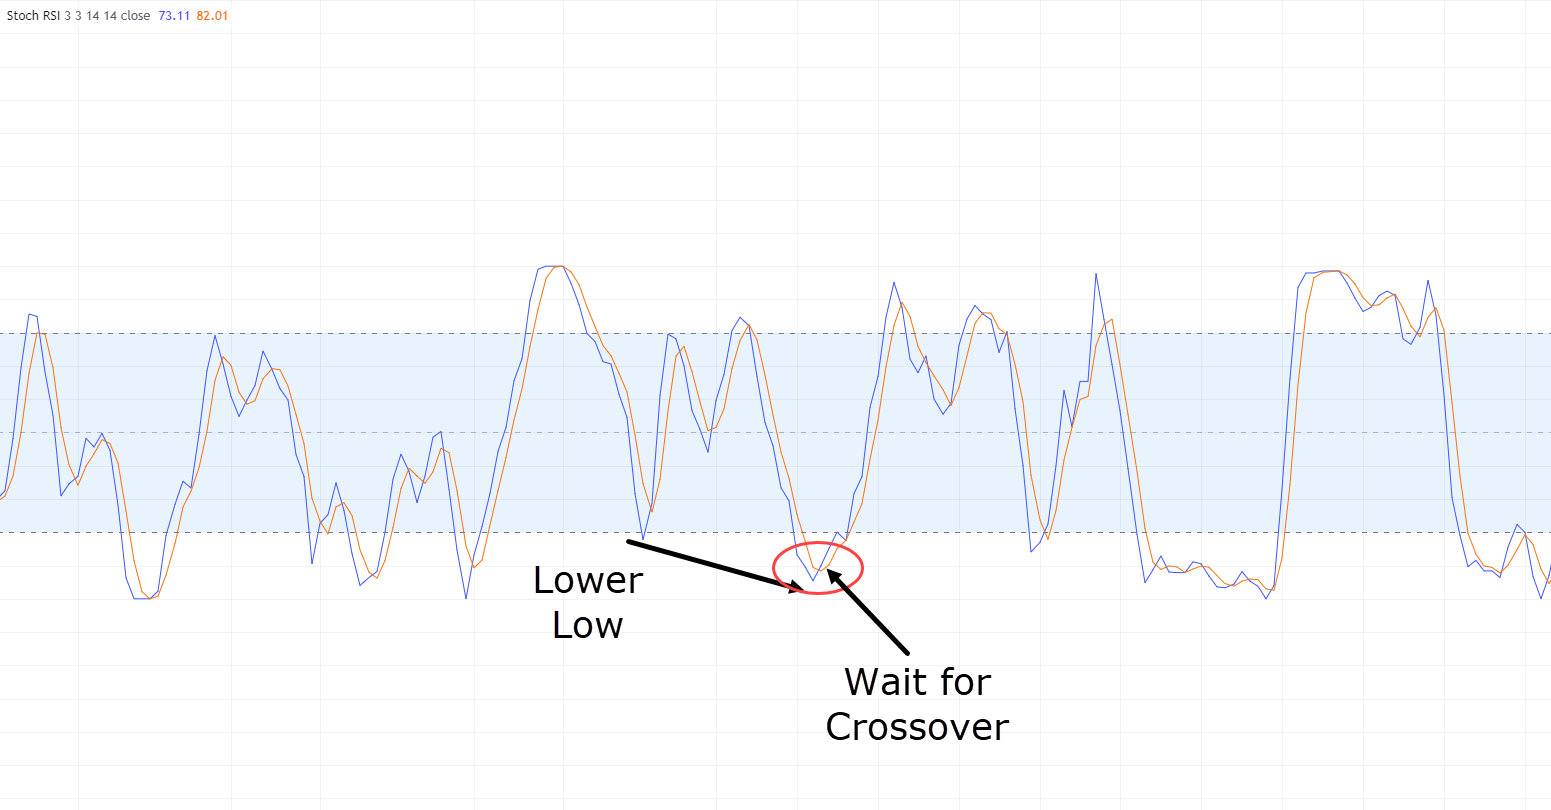
Taking Stochastics as an example, when price forms the lower low, the two lines on the Stochastic have not crossed over.
Waiting for this crossover allows you, as the trader, to enter the trade when momentum has truly shifted back to the bulls!
In some cases, this might mean entering a trade a bit later, but it provides an additional layer of confidence when making trading decisions…
Oversold areas
Overbought and oversold areas are less relevant to hidden divergence scenarios, but it’s worth mentioning that if your setup is in an oversold area, it might be beneficial to wait for the price to leave the oversold range…
Stochastic RSI Oversold example:
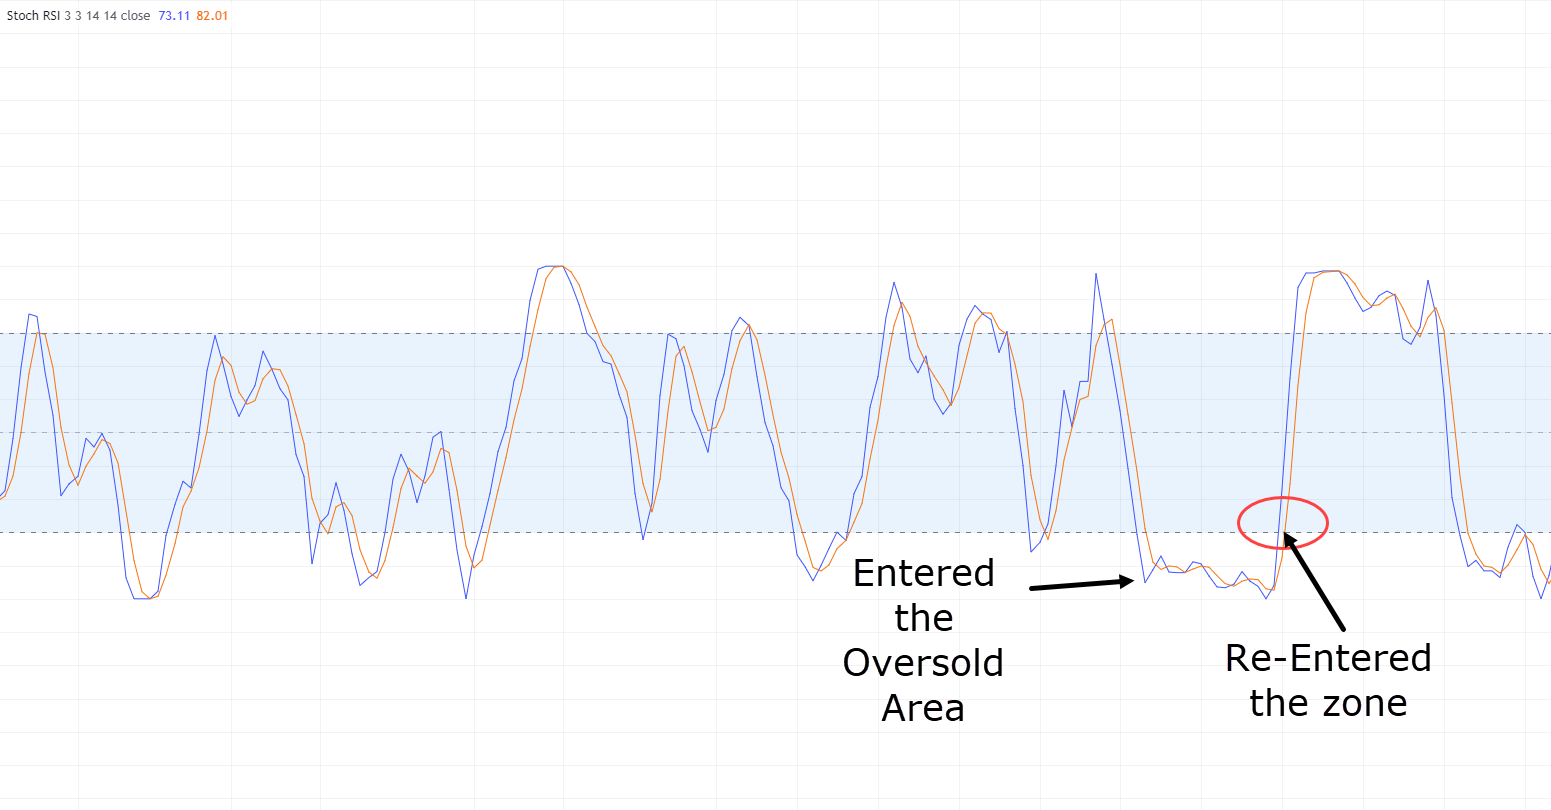
If the price is in an oversold area and forms the lower low for the hidden bullish divergence, sometimes it’s best to wait for the indicator to exit its oversold area.
Then, you can place the trade as the momentum truly begins to shift in favor of the bullish trend.
Patience!
Last but not least, all of the above relies heavily on one thing…
…perhaps the most difficult thing…
…being patient!
Traders often rush into the first thing they see, taking every possible trade.
But it’s important to take a deep breath…
…and take only the best setups.
When using the techniques above, practice patience in waiting for them to occur!
At the end of the day, being patient might cause you to miss some trades, but I assure you that it will prevent overtrading, taking poor setups, and questioning your trading strategy altogether.
Conclusion
In conclusion, the Hidden Bullish Divergence strategy emerges as a powerful tool for capturing the continuation of bullish trends, offering a precise entry trigger.
Combining this strategy with other technical analysis tools increases the chances of a successful trade by aligning several favorable factors.
Throughout this comprehensive guide, you’ve acquired the knowledge necessary to navigate and execute the hidden bullish divergence setup.
Moreover, you’ve gained insights into its limitations and discovered invaluable tips and tricks to further elevate your success rate.
To summarize our journey:
- You now possess a deep understanding of the distinctions between regular bullish divergence and hidden bullish divergence, enabling you to discern the most suitable market conditions for each.
- Armed with the knowledge from practical setups, you have the tools to enter trades with momentum, placing the odds in your favor from the outset.
- Practical setups equip you with multiple options for taking profits and setting stop losses, letting you manage your trades effectively no matter how they unfold.
- By delving into the limits of hidden bullish divergence, you can approach your trades with realistic expectations, gaining a resilient trading mindset.
- The article has provided valuable tips and tricks to prevent premature entries, making sure you have the confirmation you need to trade with confidence.
So, with your new-found knowledge, I encourage you to put these techniques into practice, refining your approach to suit your trading style!
Now, what are your thoughts on Hidden Bullish Divergence?
Have you grasped the difference between Regular and Hidden divergence?
Do you use divergence in any of your trading?
Feel free to share your insights in the comments below!


