Let’s face it…
Top traders understand that having a stop loss is key to protecting their accounts.
It’s crucial not to enter trades without them, right?
But at the same time…
What is it that makes them so tricky to master?
Because at one point, I’m sure you’ve asked yourself:
“Why do I keep getting stopped out so early?”
“Does my broker hunt my stop loss?!”
Well, in today’s guide, I’ll teach you the best stop loss strategy to manage your trades and protect your account on a whole new level!
Specifically, you’ll learn:
- The truth about stop losses (how they work, and a deep-dive into your trading psychology on why they can hurt)
- The BEST practices for setting your stop loss so that you’ll never second-guess yourself when placing them again
- Time-tested trading indicators that help you place your stop loss regardless of your trading methodology
- Crucial notes on how NOT to use stop losses
I know it hurts whenever your stop losses get hit, to the point that you’d start blaming your broker, indicator, or even your mentor…
This training guide aims to change that!
It’s time to show you how stop losses give you an edge in the markets, helping you to become a more independent trader.
So, are you ready?
Then let’s get started!
Best Stop Loss Strategy: How Does It Work, And Does It Protect Your Account?
Let’s get to the basics…
A stop loss is a type of order you place in the markets where if the price hits it…
…you exit the trade…
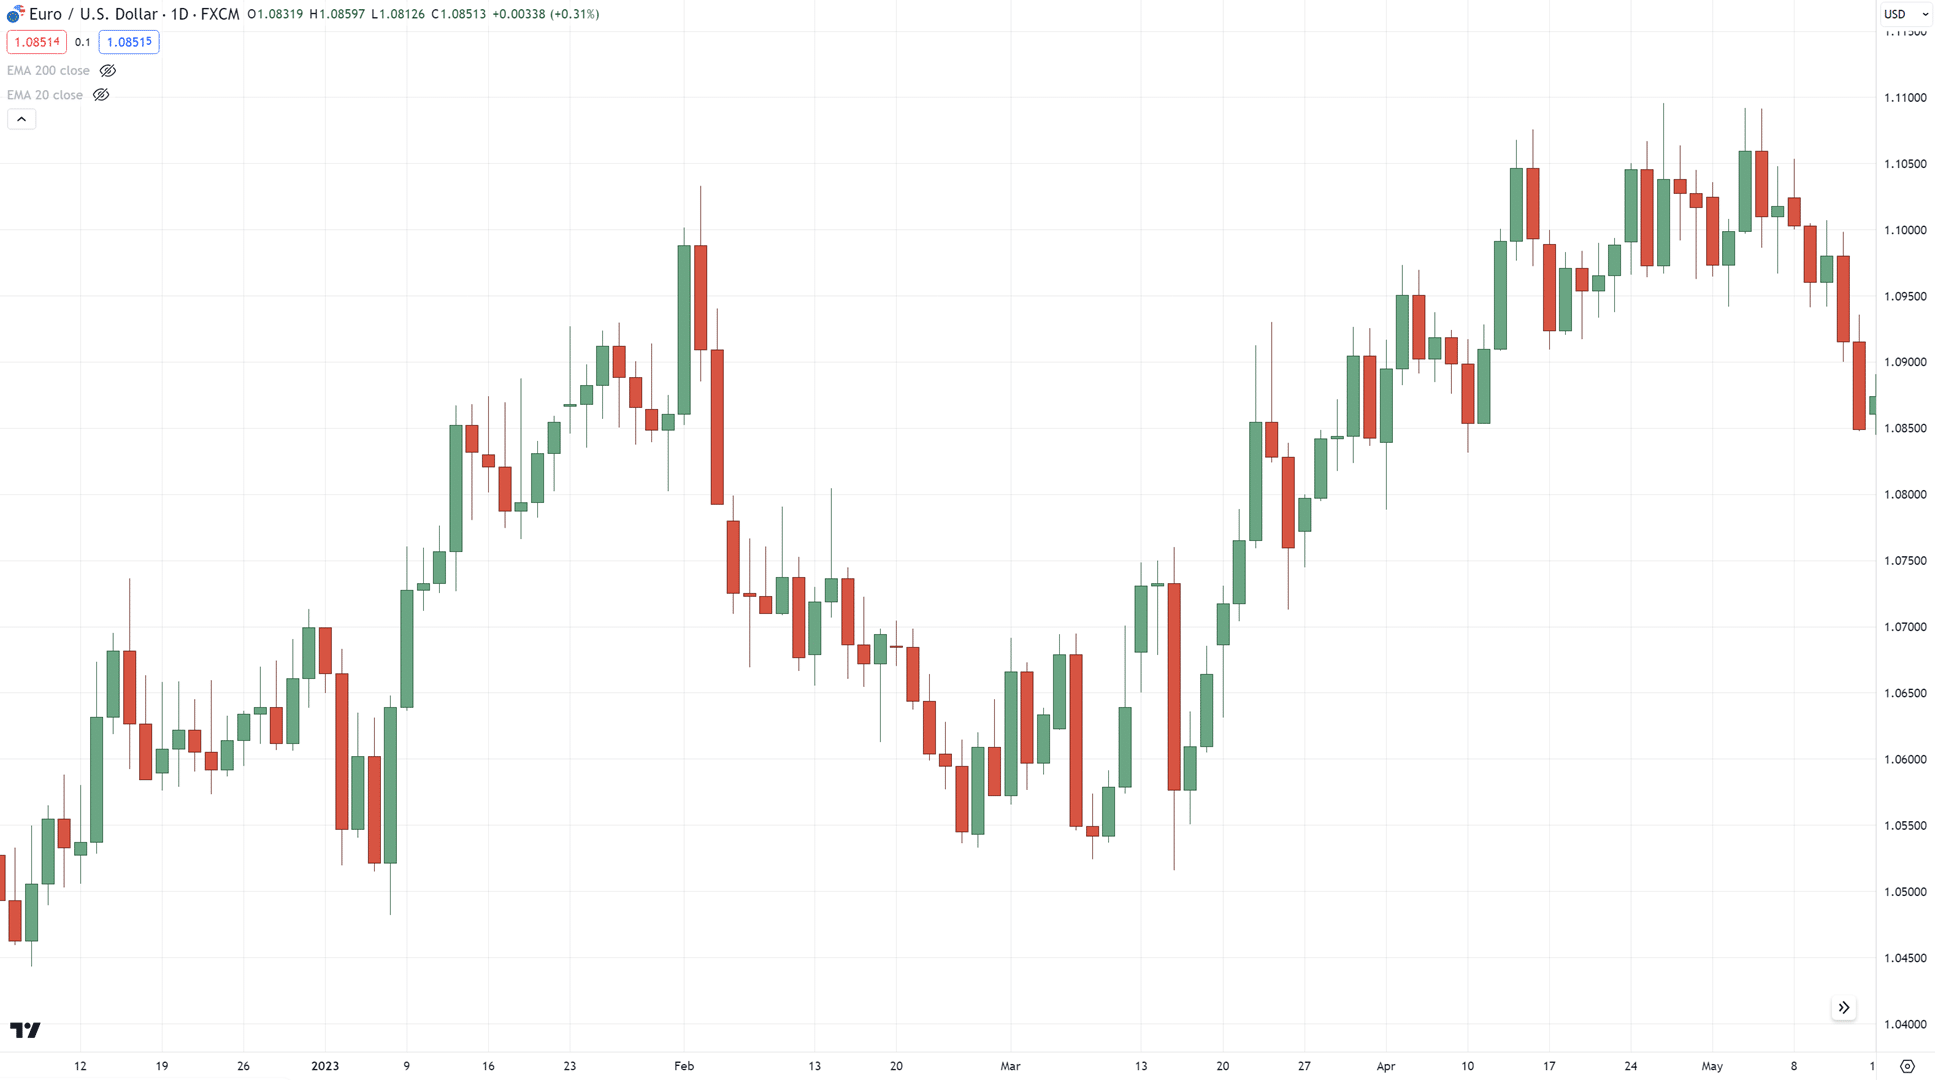
…and your position gets liquidated.
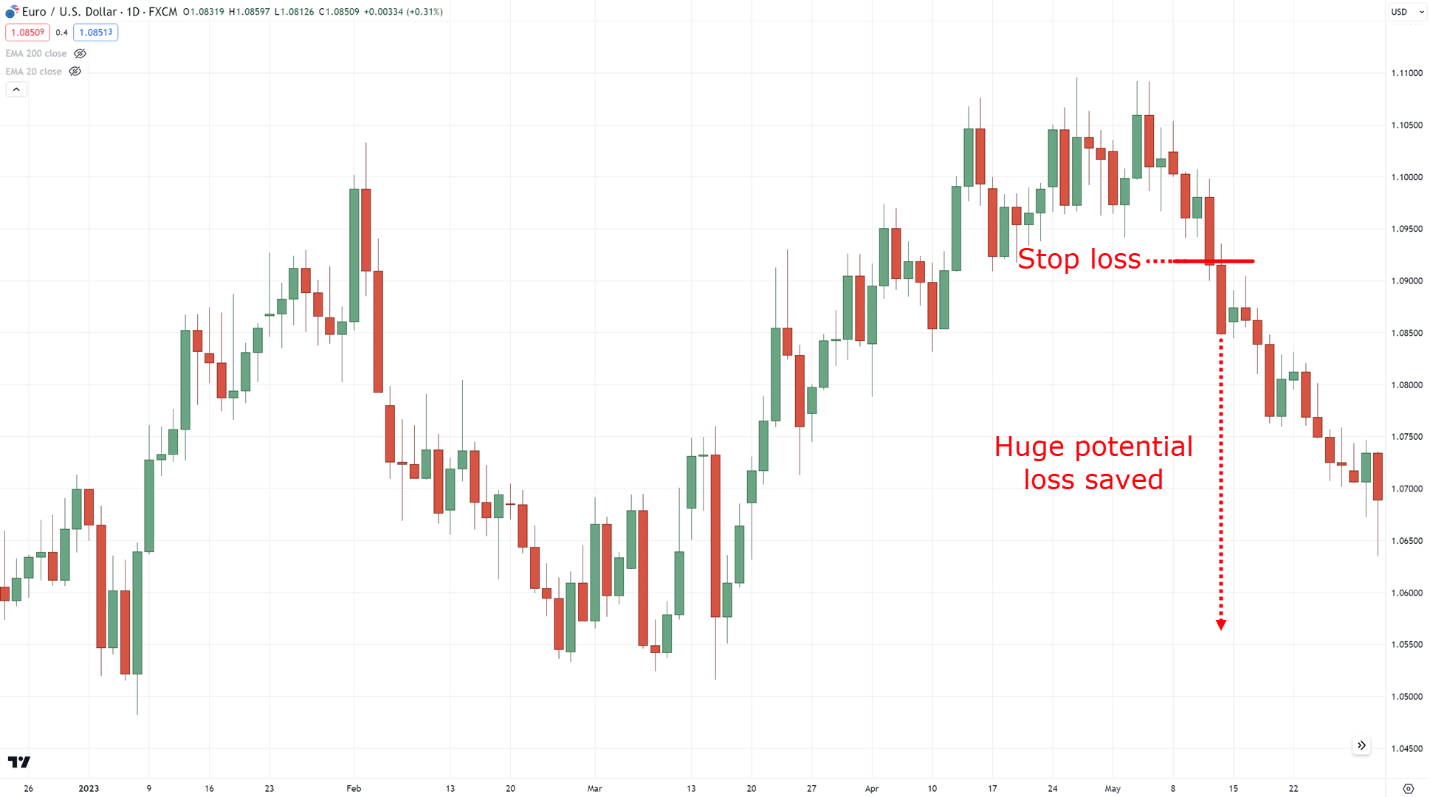
That’s right, a stop loss makes your losses “real” in the markets.
Which hurts – I get it!!
But at the same time, having a stop loss protects your account from huge potential losses such as this…
So, it just makes sense to have them there, right?
But, how come this happens so often!?…
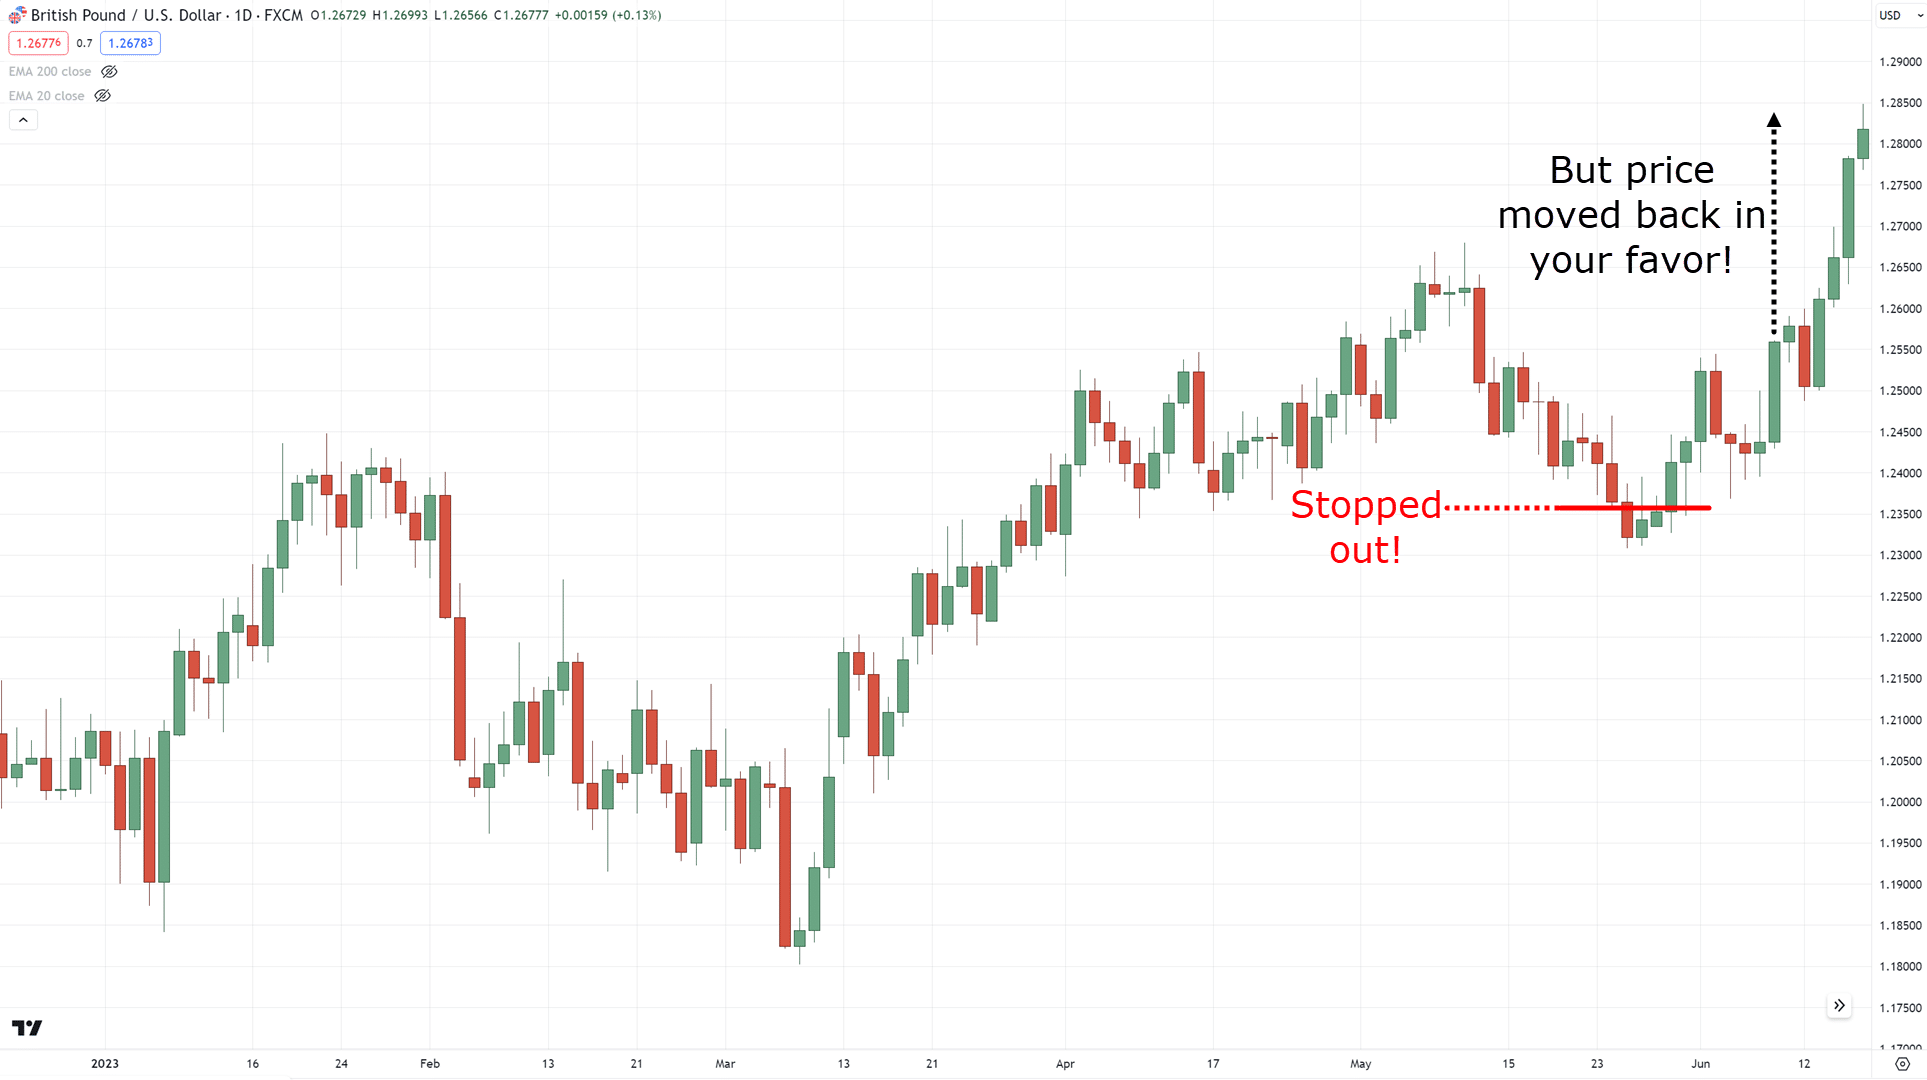
You start to tell yourself…
“Argh!! If I’d just held on to my trade a bit longer, it would’ve been a winner!!”
“I knew I shouldn’t have had a stop loss!”
OK, but seriously… Did you ever wonder what causes this to happen?
How come the market always seems to know where your stop loss is placed?
Why do you always get “stopped out?”
Here are three potential reasons to think about…
1. You’re placing your trades close to high-impact news
This is pretty much common if you trade the lower timeframes in the Forex and Stock markets.
As you may know, there is a “spread” in every market.
It contains the bid and ask price (which are usually close to each other)…
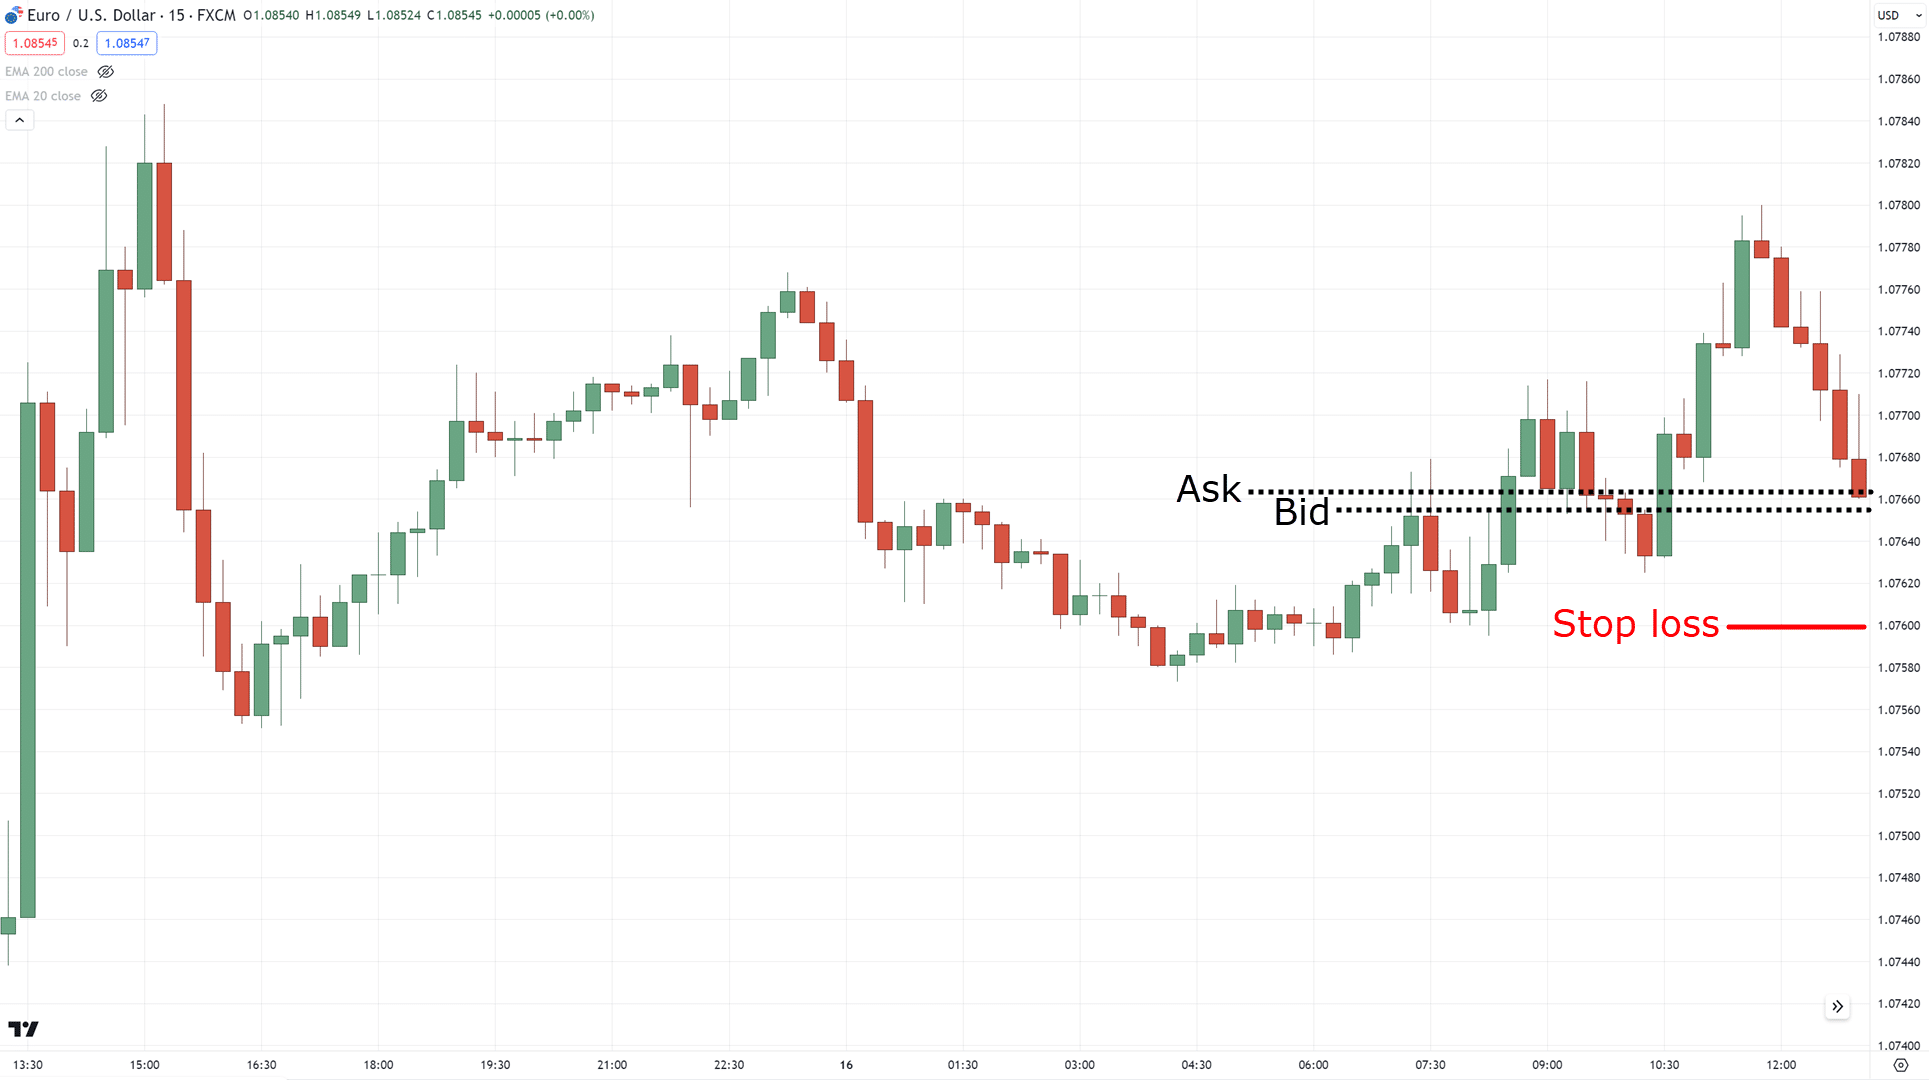
Whenever high-impact news occurs, what happens is that there is a sudden surge of liquidity in the markets!
The result?
Well, it widens the spread!
But… then what happens?
You guessed it!
Your stop loss suddenly evaporates in an instant…
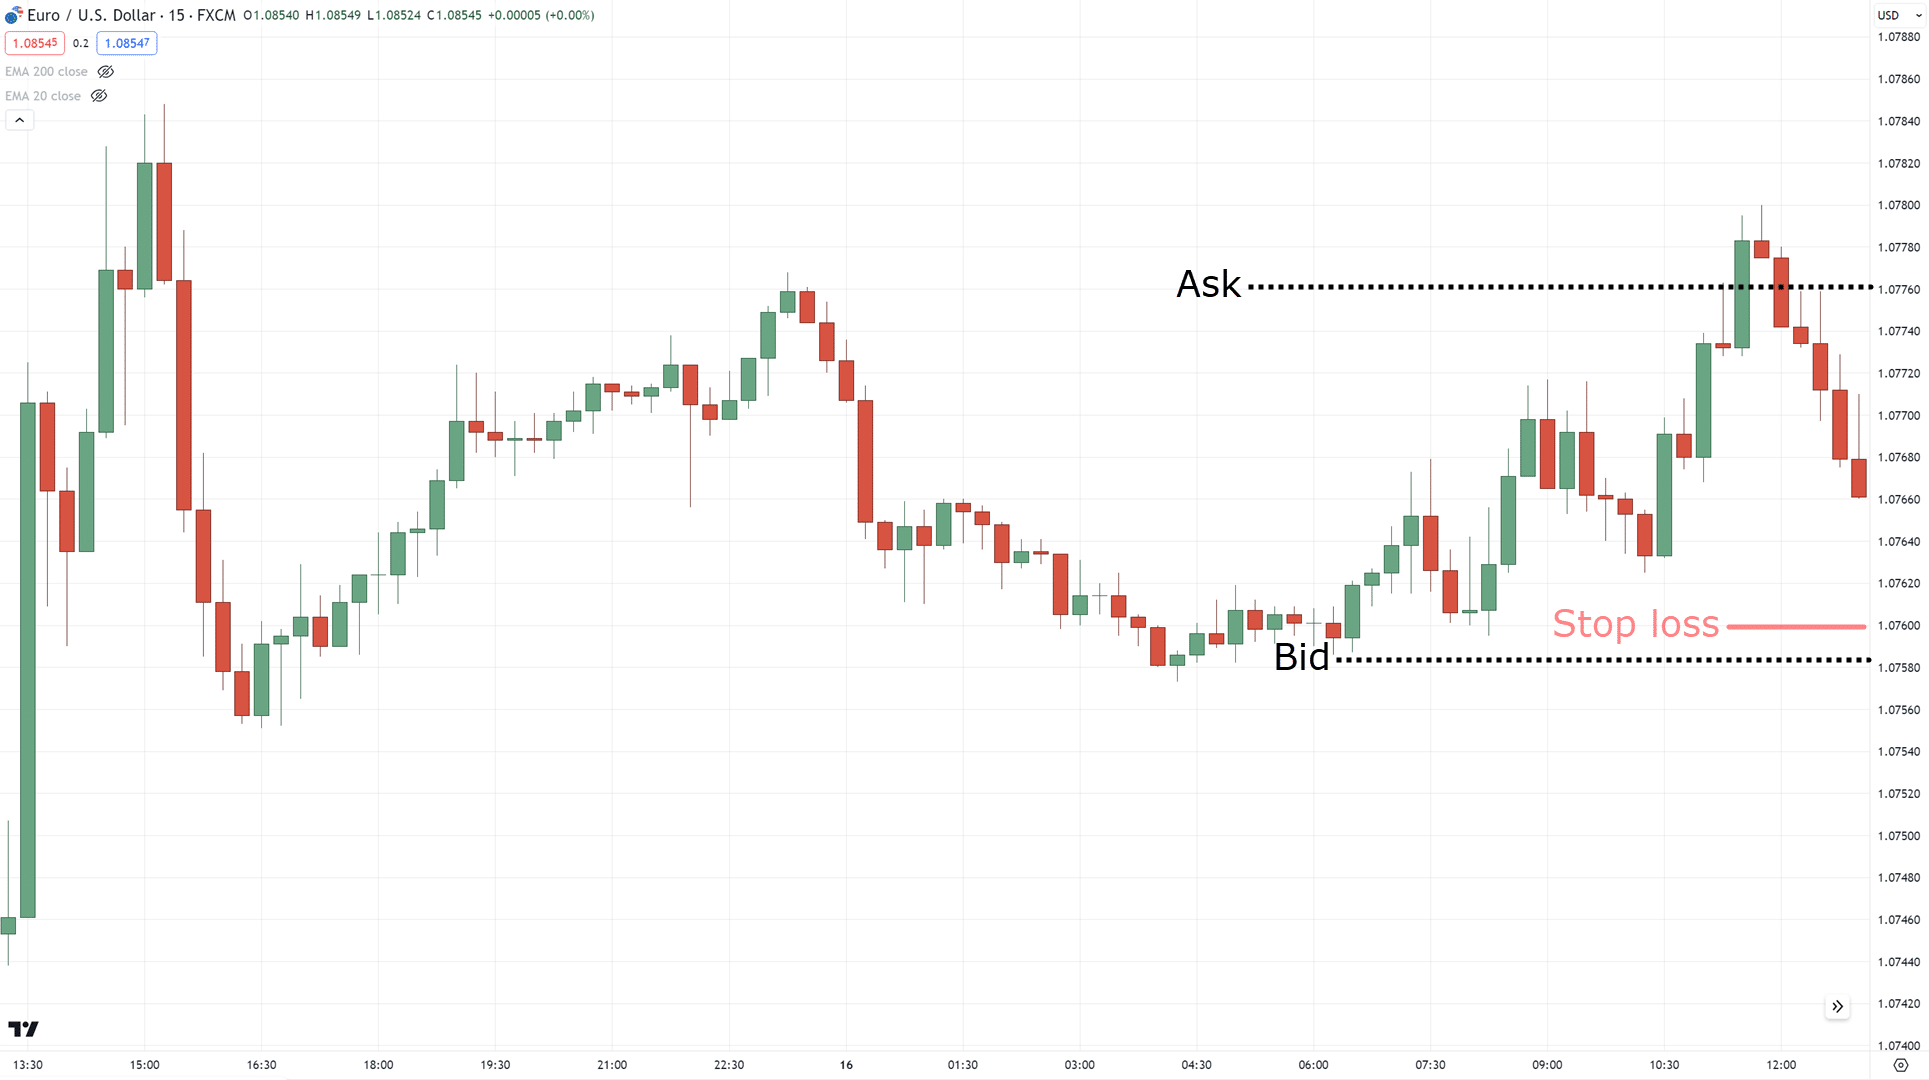
This is why it pays to know when high-impact news is released (as these changes happen within split-seconds!).
It’s a useful way to understand when not to place your trades.
Again, this applies more to those trading in lower timeframes…
Higher timeframe traders will typically experience this less.
Now, another potential cause…
2. Your stop loss is placed too tight relative to the market condition
As you know…
Not all markets are the same.
And yes, I mean it!
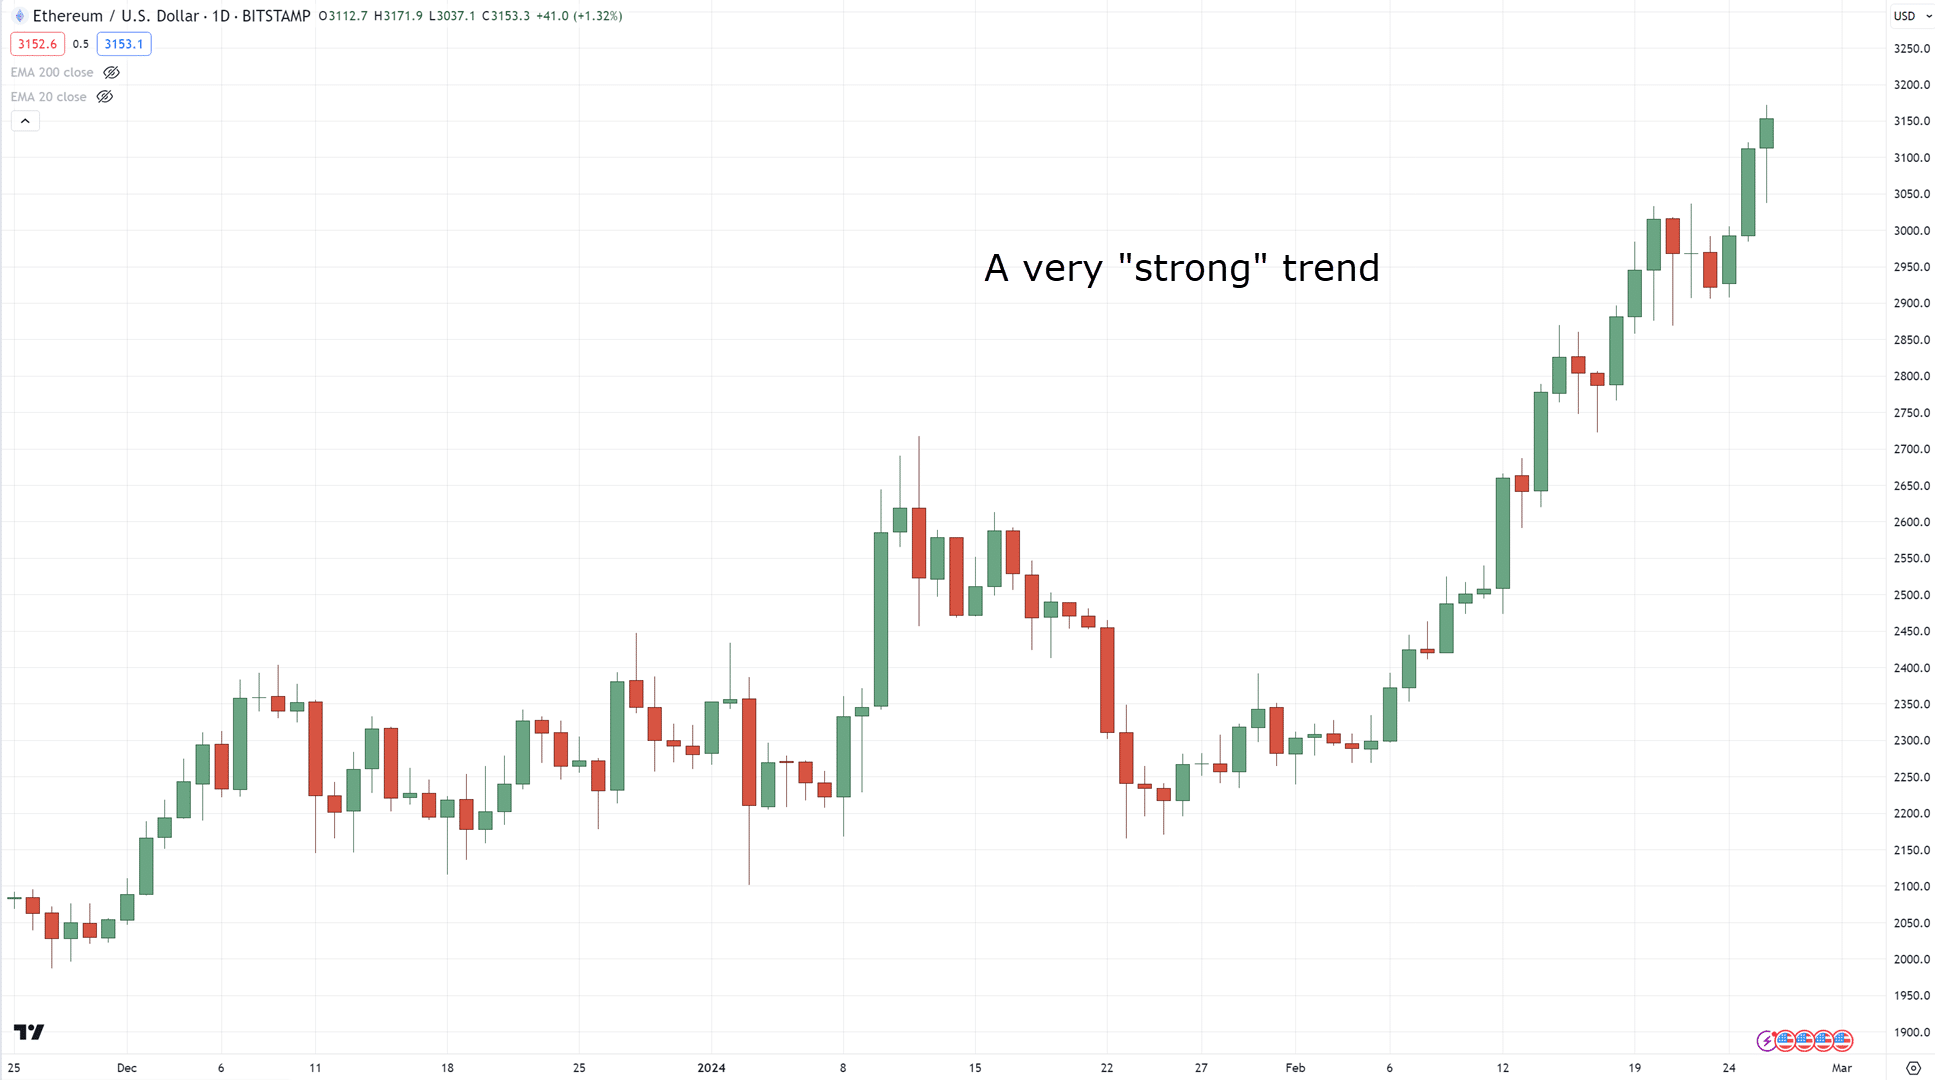
Take a look at this…
…and then this…
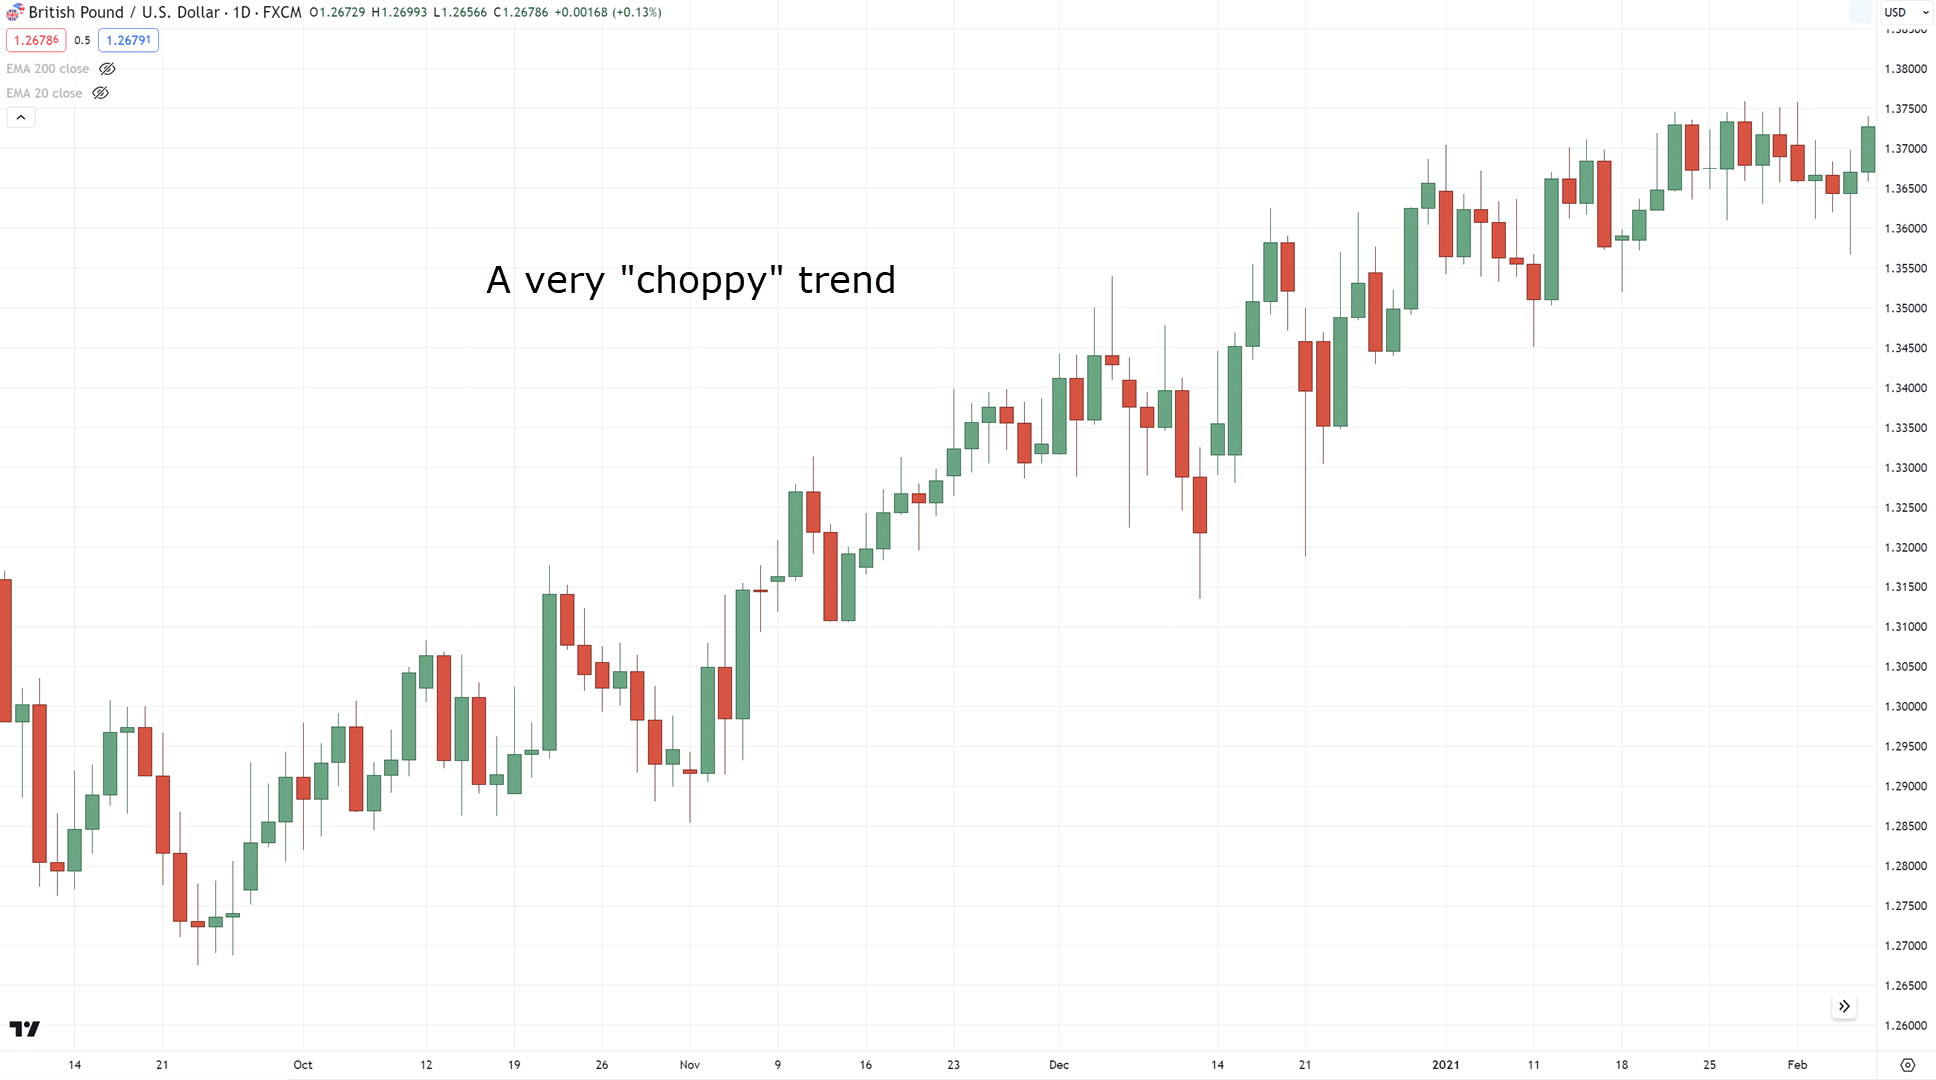
You can safely say that they are trending markets, right?
However, their behaviors are not the same.
As such, how you place your stop loss should also be different, right?
So, taking a closer look at the examples again…
…where do you think you would place your stop loss?
That’s right, like this…
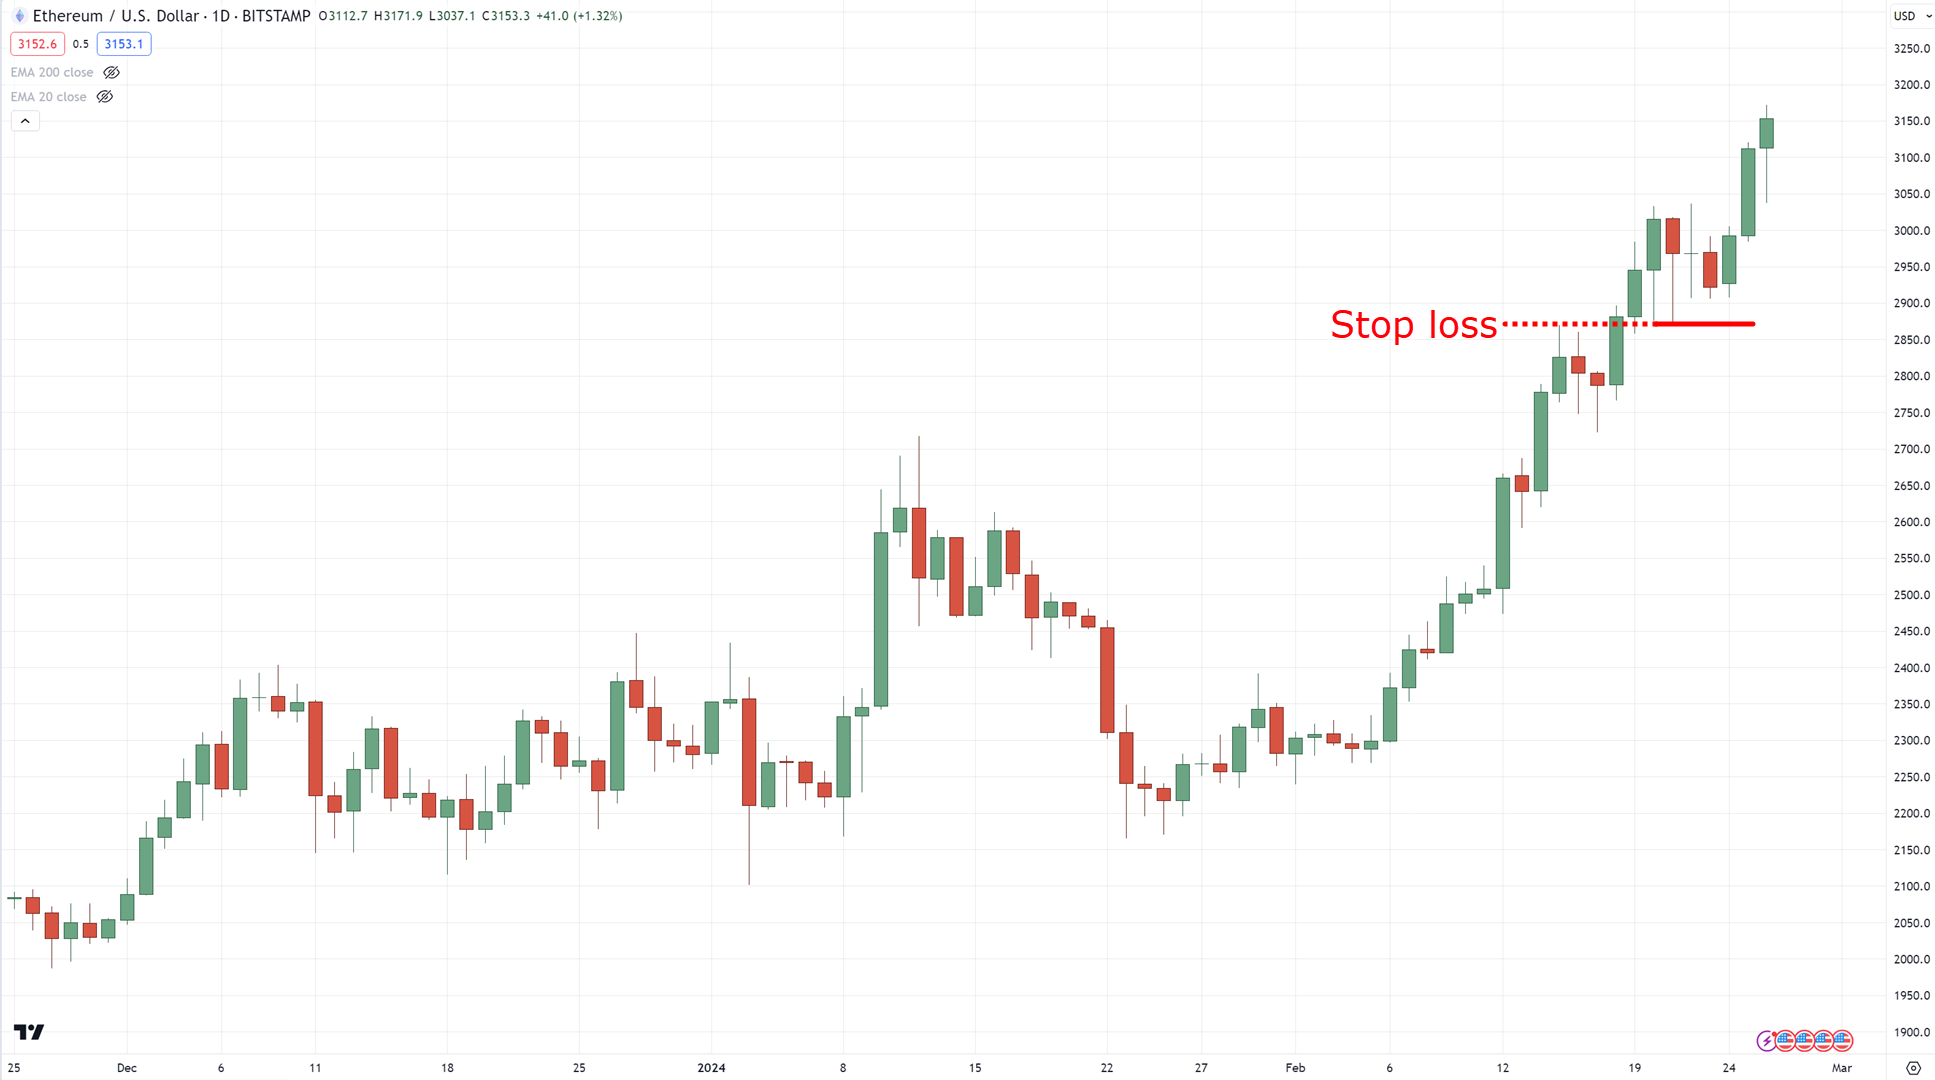
Tighter stop loss on strong trends…
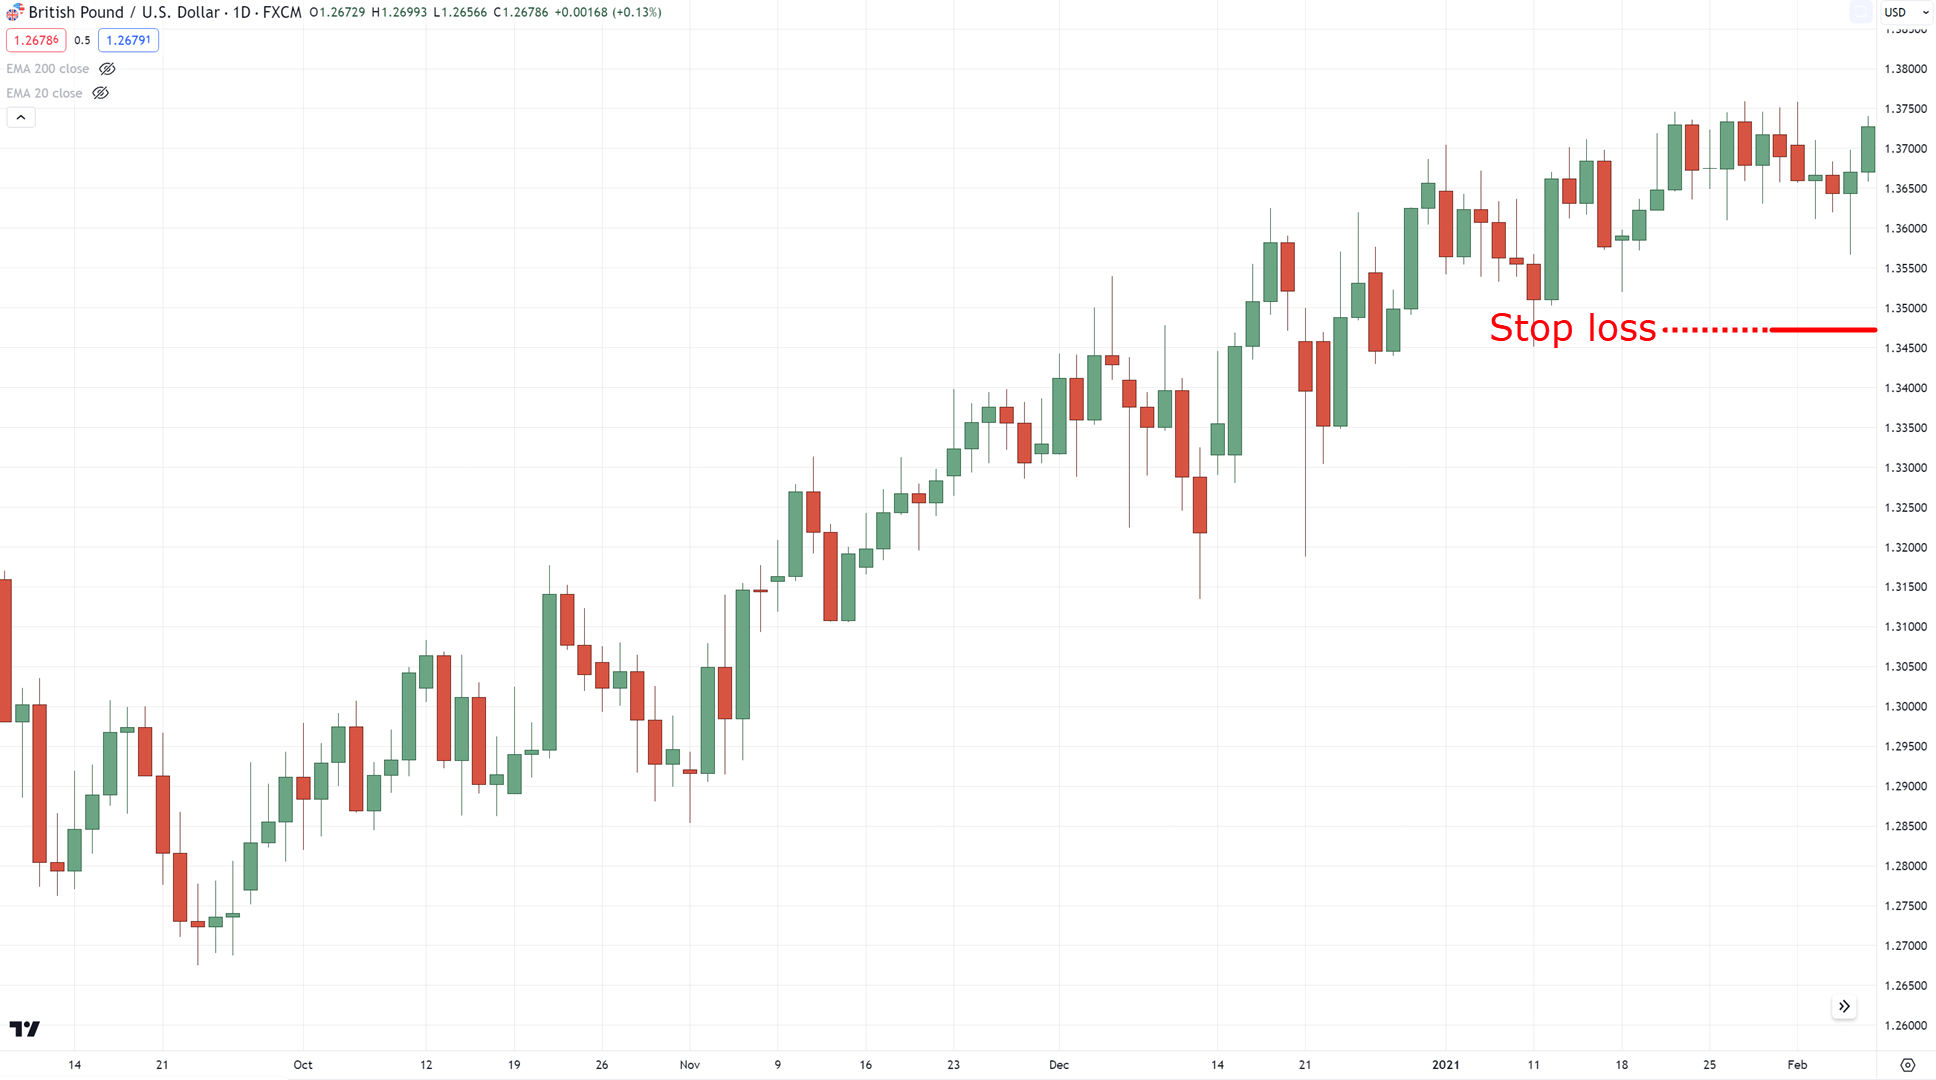
…with a wider stop loss on choppy trends!
And yes, this philosophy also applies to ranging markets, too.
Not all of them are the same!
Some ranges are small, while some range markets are erratic and very choppy…
3. You don’t know the reason why your stop loss is placed
I want you to remember this quote from Bruce Kovner, one of the Market Wizards:
“Place your stops at a point that, if reached, will reasonably indicate that the trade is wrong”
That is the REAL purpose of having the best stop loss strategy.
It’s meant as a way to tell you that your trading idea is wrong!
So, at this point, you’re probably wondering:
“What’s the solution, then?”
“What are some ways on how I can improve my stop loss placement?”
Well, don’t worry, my friend.
Because in the next section…
I’ll reveal the secrets you need to implement the best stop loss strategy and save you plenty of heartache in the market!
So, read on!
A Cheatsheet On Having The Best Stop Loss Strategy
Ready to get down to the nitty-gritty details on how to set your stop loss properly?
Good.
Because in this section…
I’ll share with you the best stop loss strategy for price action traders.
First…
Beyond Support or Resistance
As you know, support and resistance act as “barriers” on your price chart.
However, the reliability of those barriers depends on how the market reacts to them.
If the market reverses from an area of support…
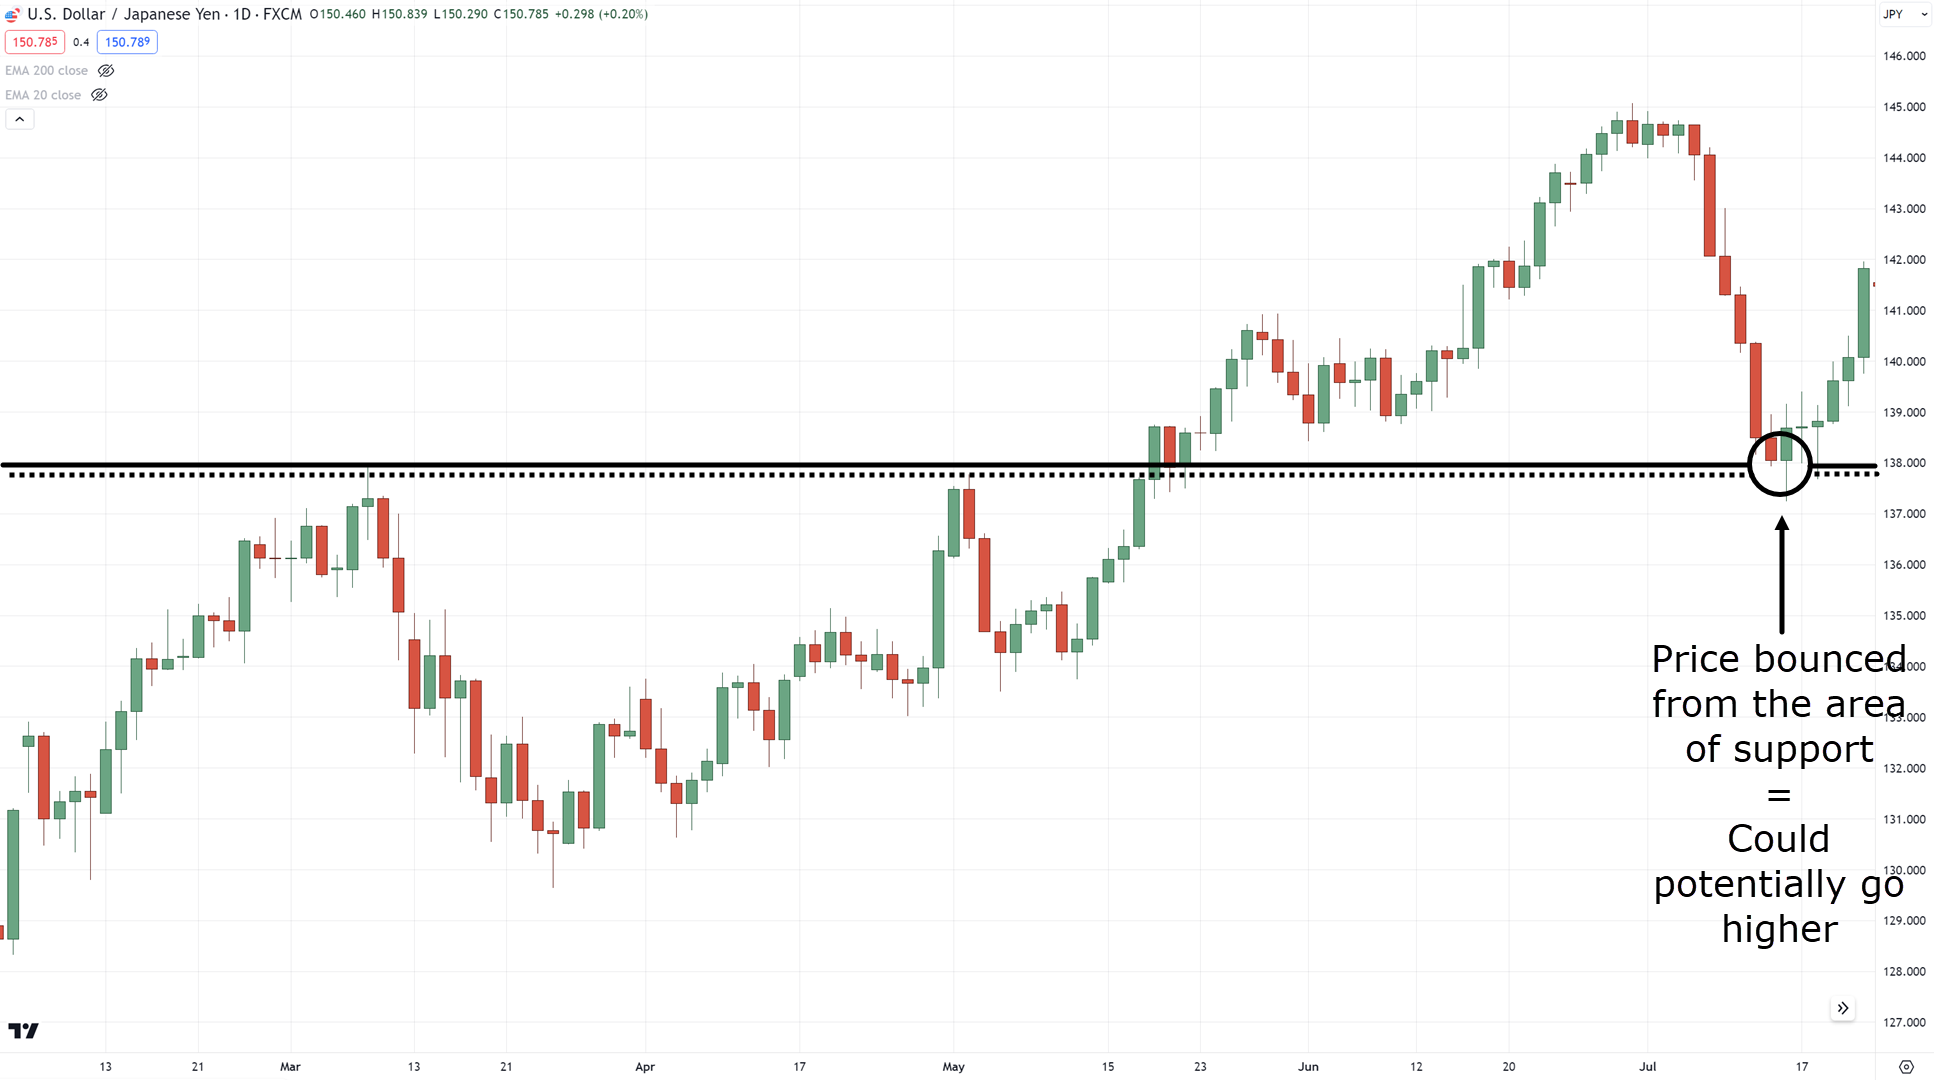
This tells you that the market has recognized such a level and can potentially continue going higher.
That’s right; it means that your support line is no longer an “imaginary” line.
On the other hand, if the market breaks an area of support…
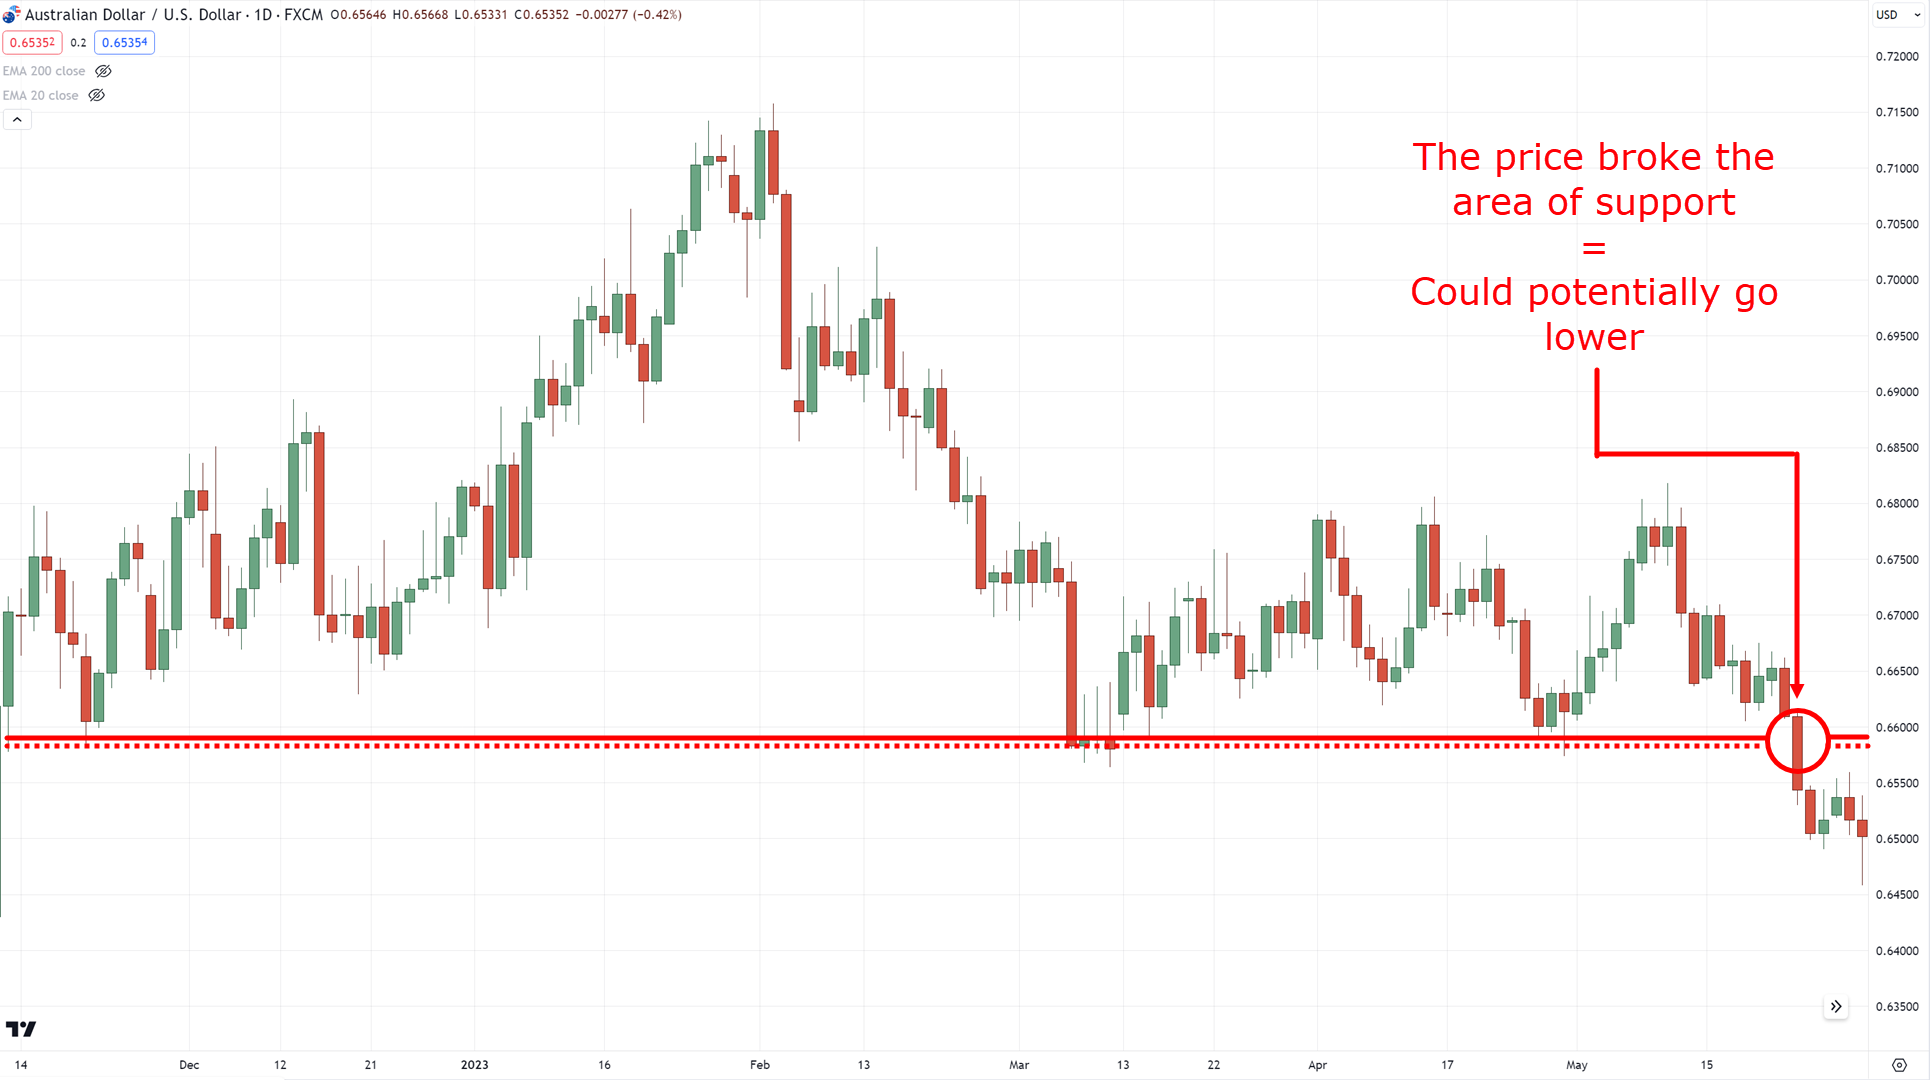
This tells you that the market can potentially go even lower.
Of course, this illustrates that support & resistance levels can fail…
…and it’s exactly why you want to see how the price reacts to such a level, and that’s why you need a stop loss!
So, how do you go about it?
First, make sure you plot your relevant support and resistance levels…
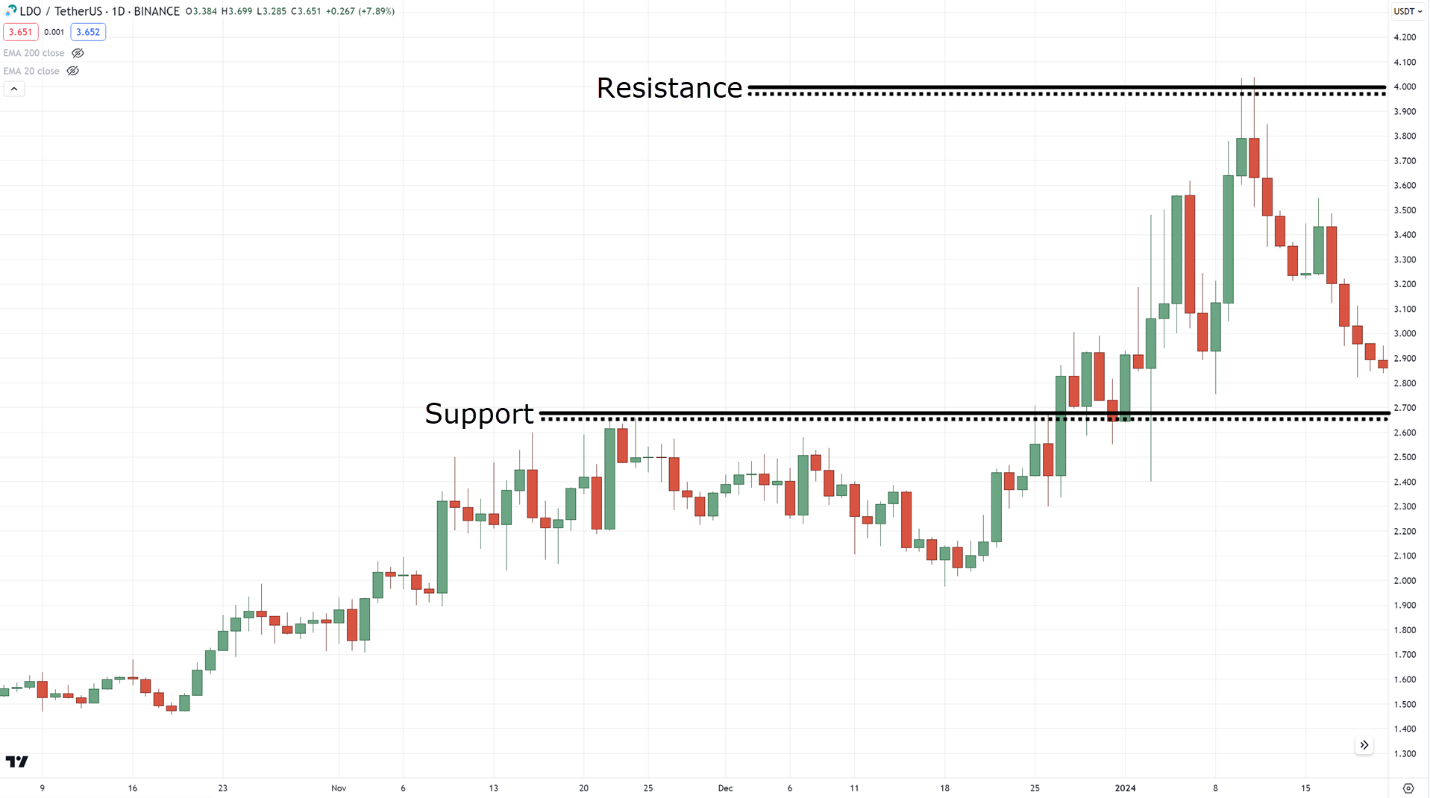
Next, is to wait for a valid setup which in this case is a false break setup at the area of support…
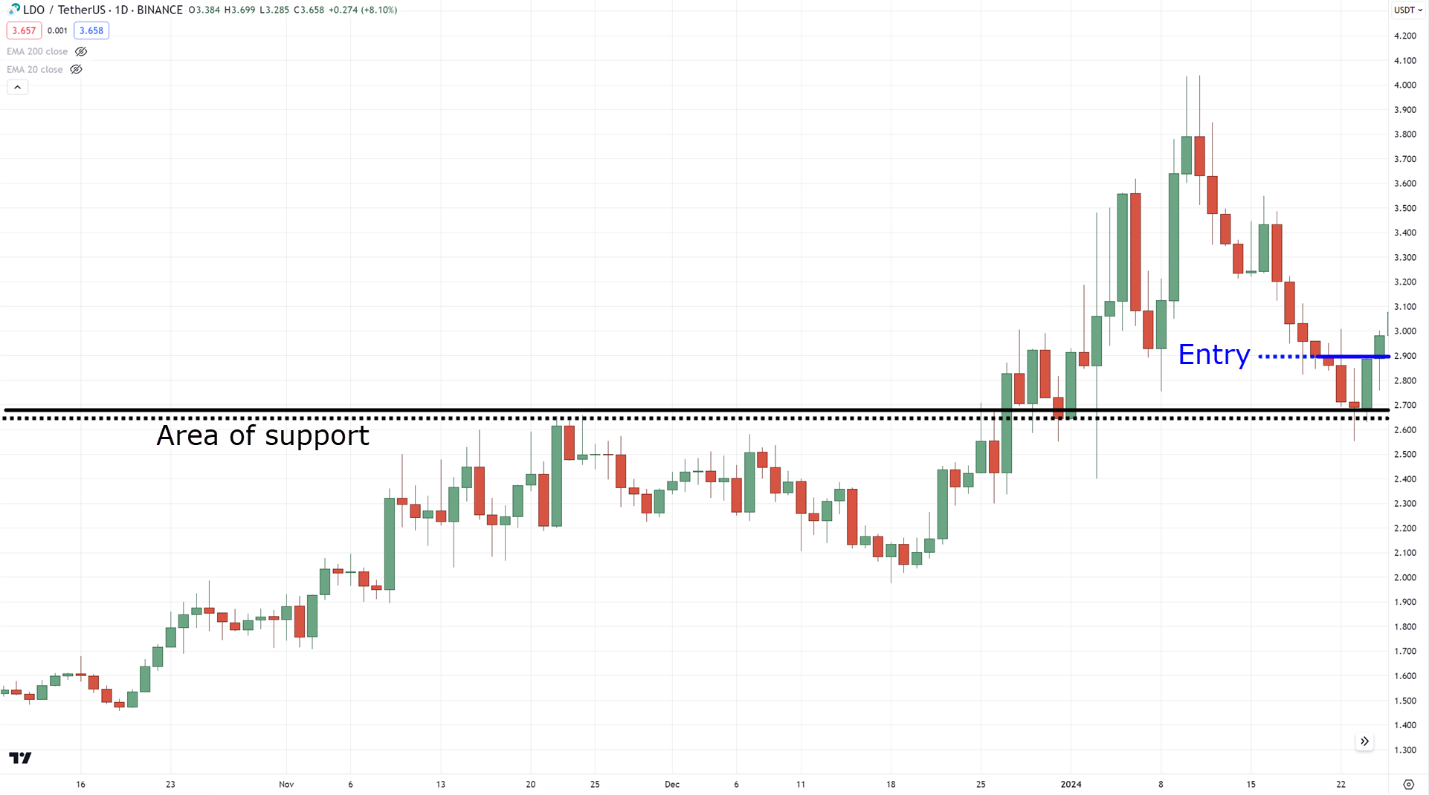
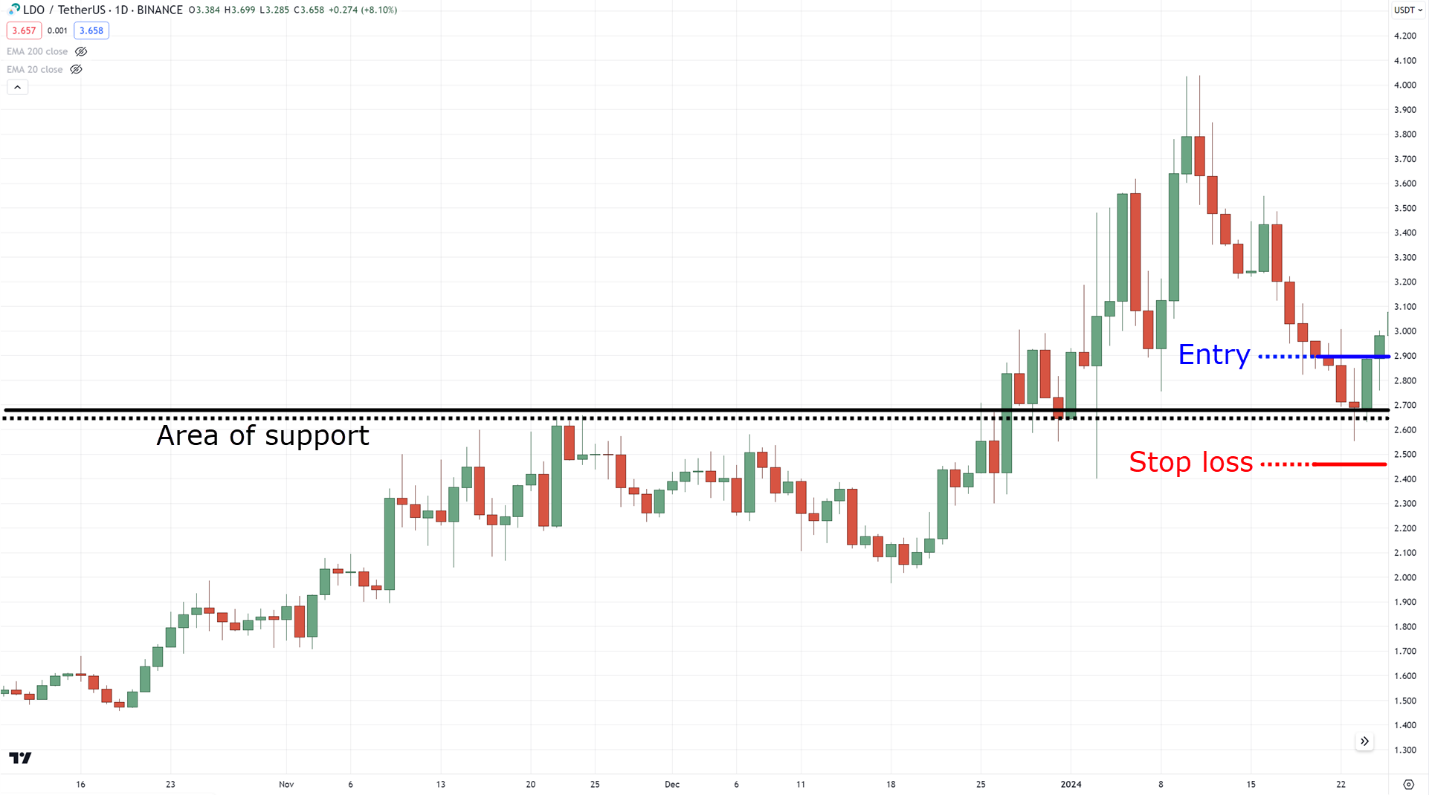
And, where do you put your stop loss?
Below the area of support, of course!…
And if it’s a false break at resistance, then place your stop loss beyond that area of resistance…
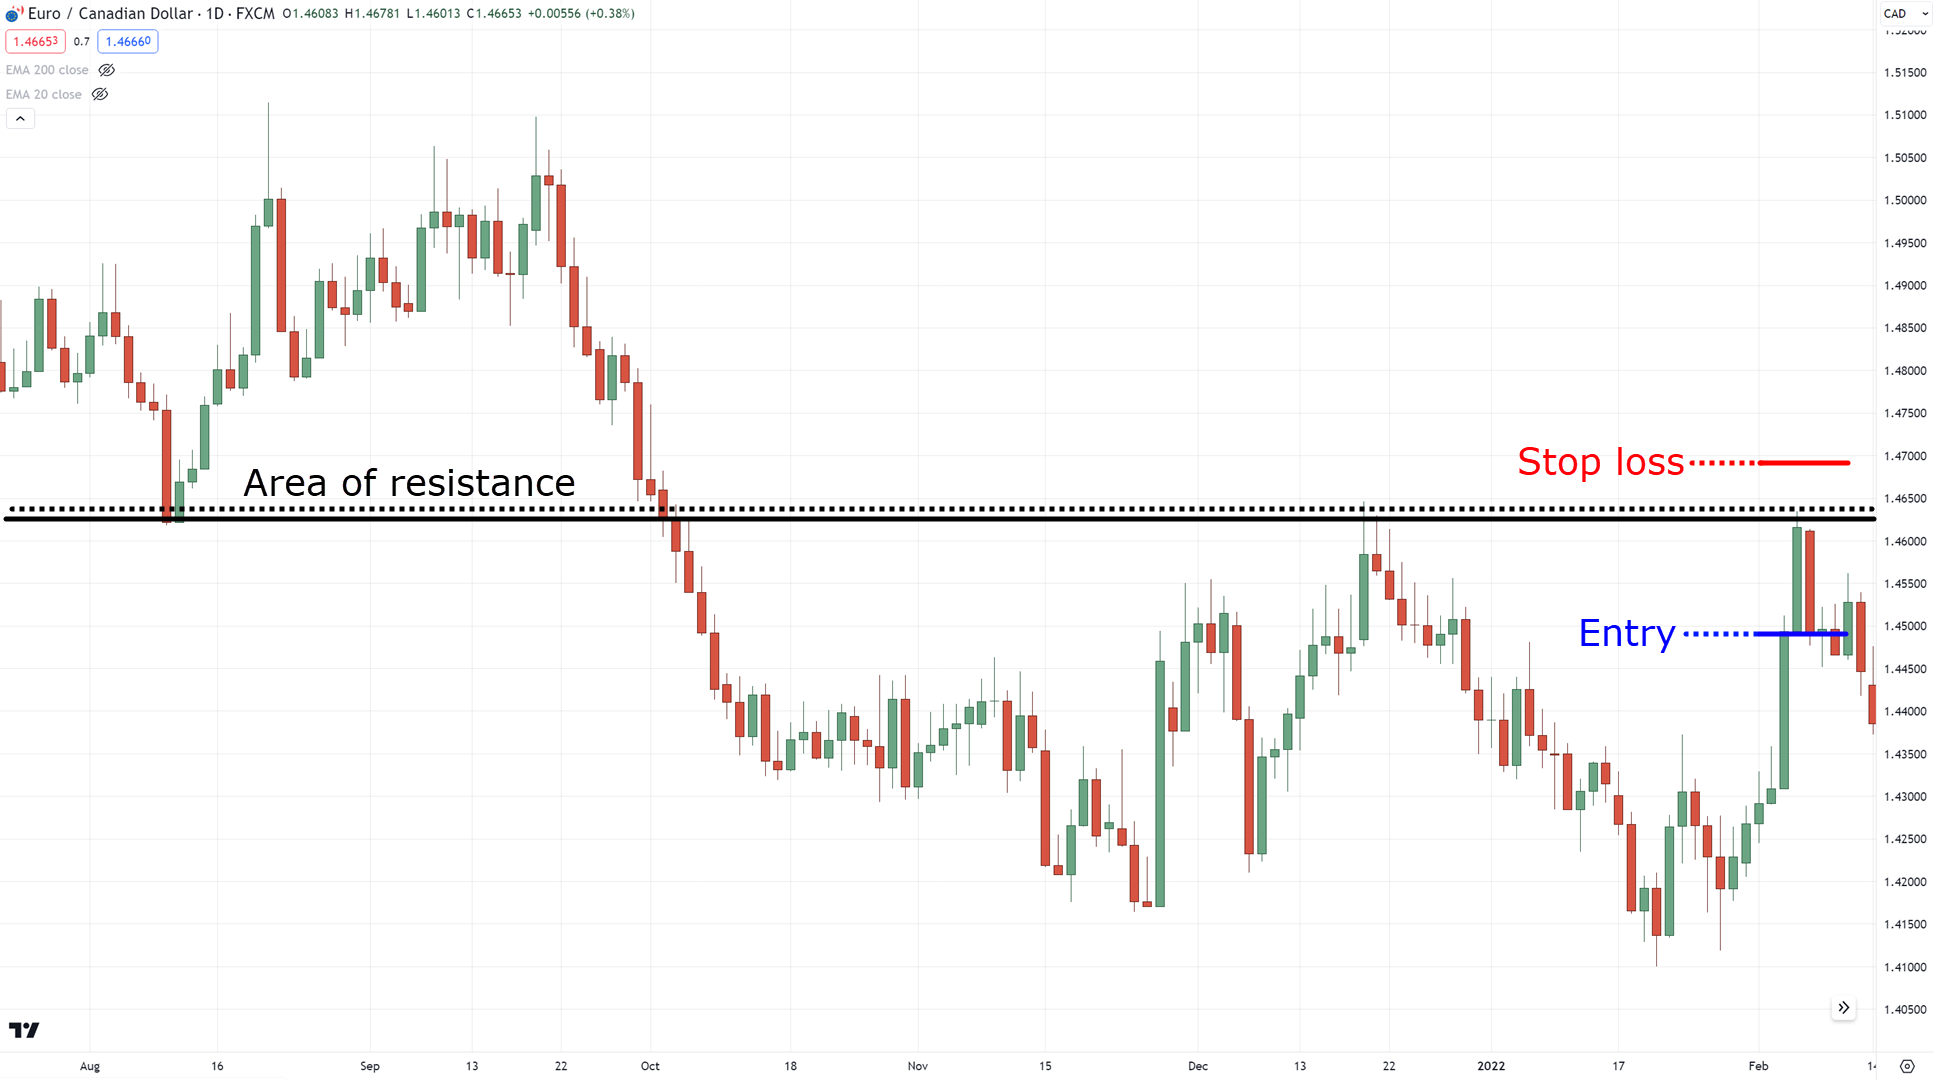
Always remember, this concept can still apply even if you trade different setups!
So what’s next…
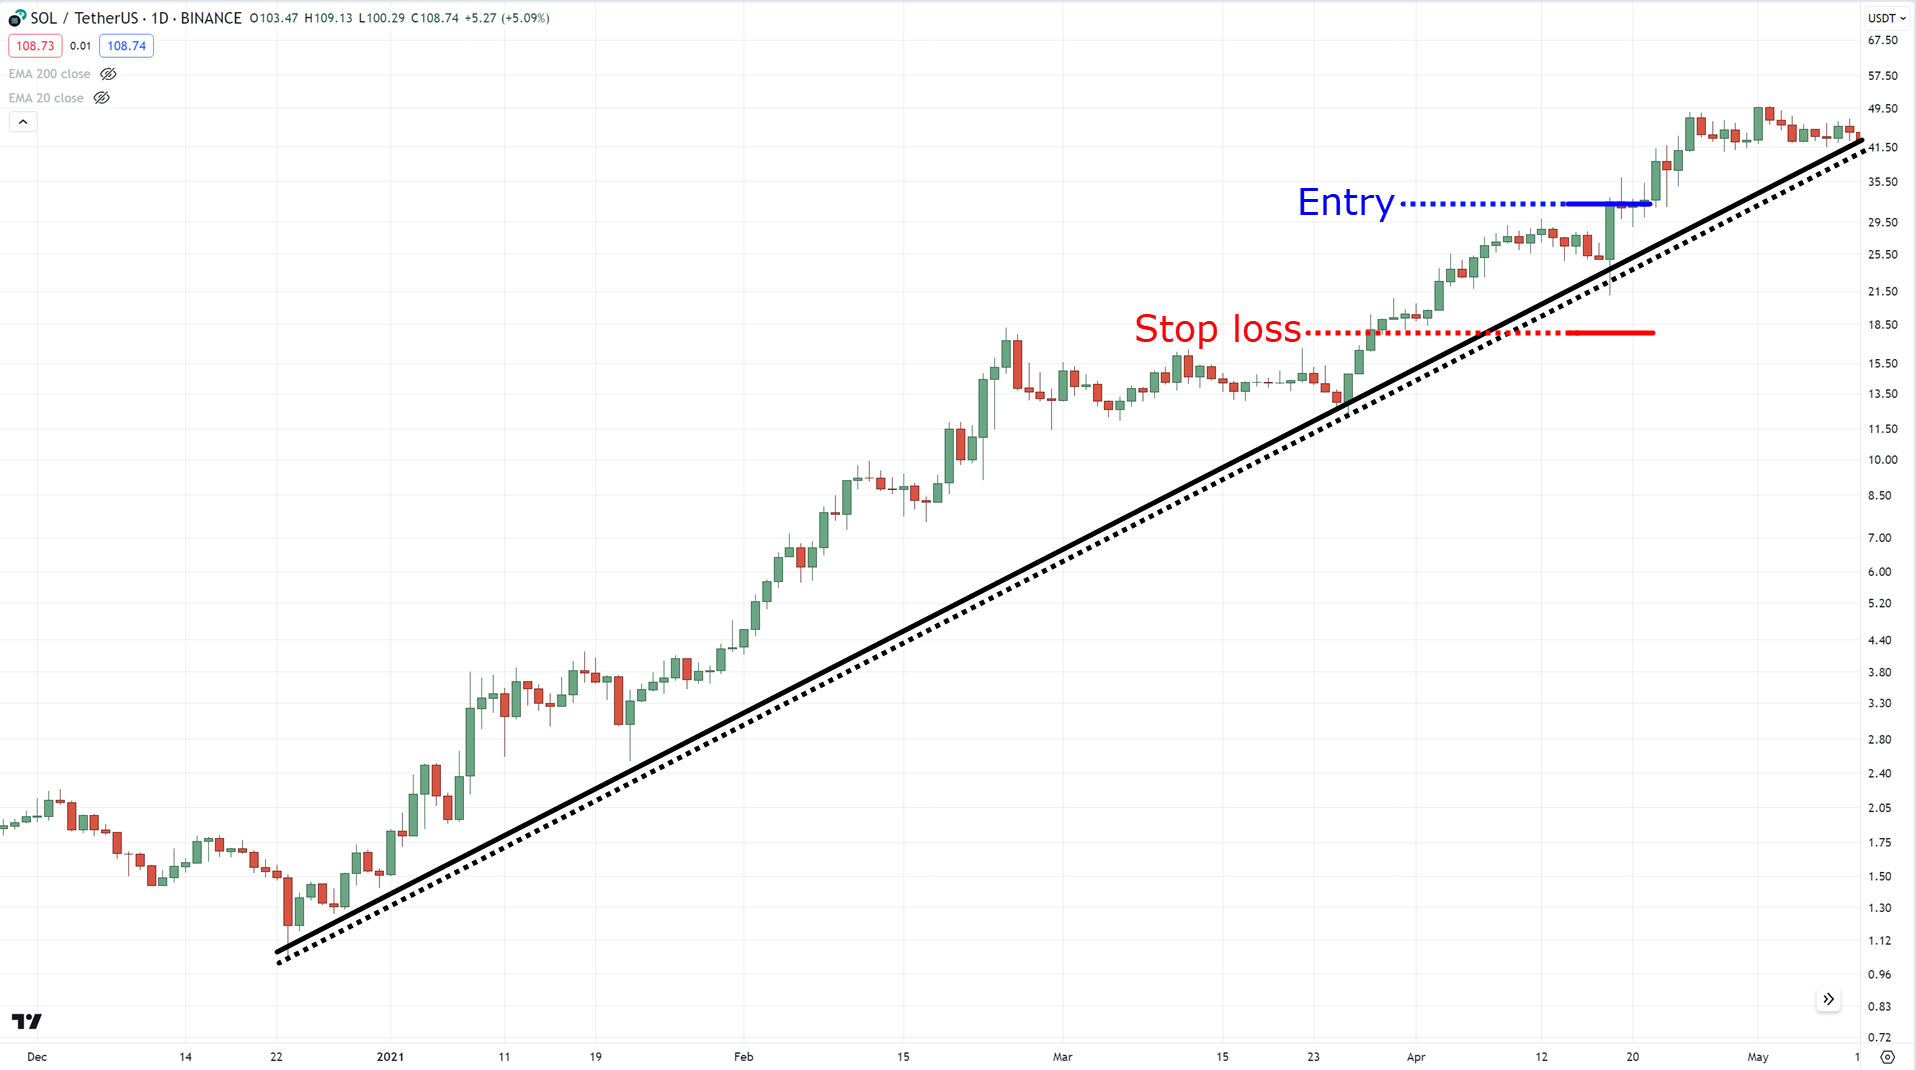
Beyond a Trend Line
Unlike Support & Resistance, which are mostly helpful for ranging markets…
…using a trend line is a great tool to determine the area of value in a trending market…
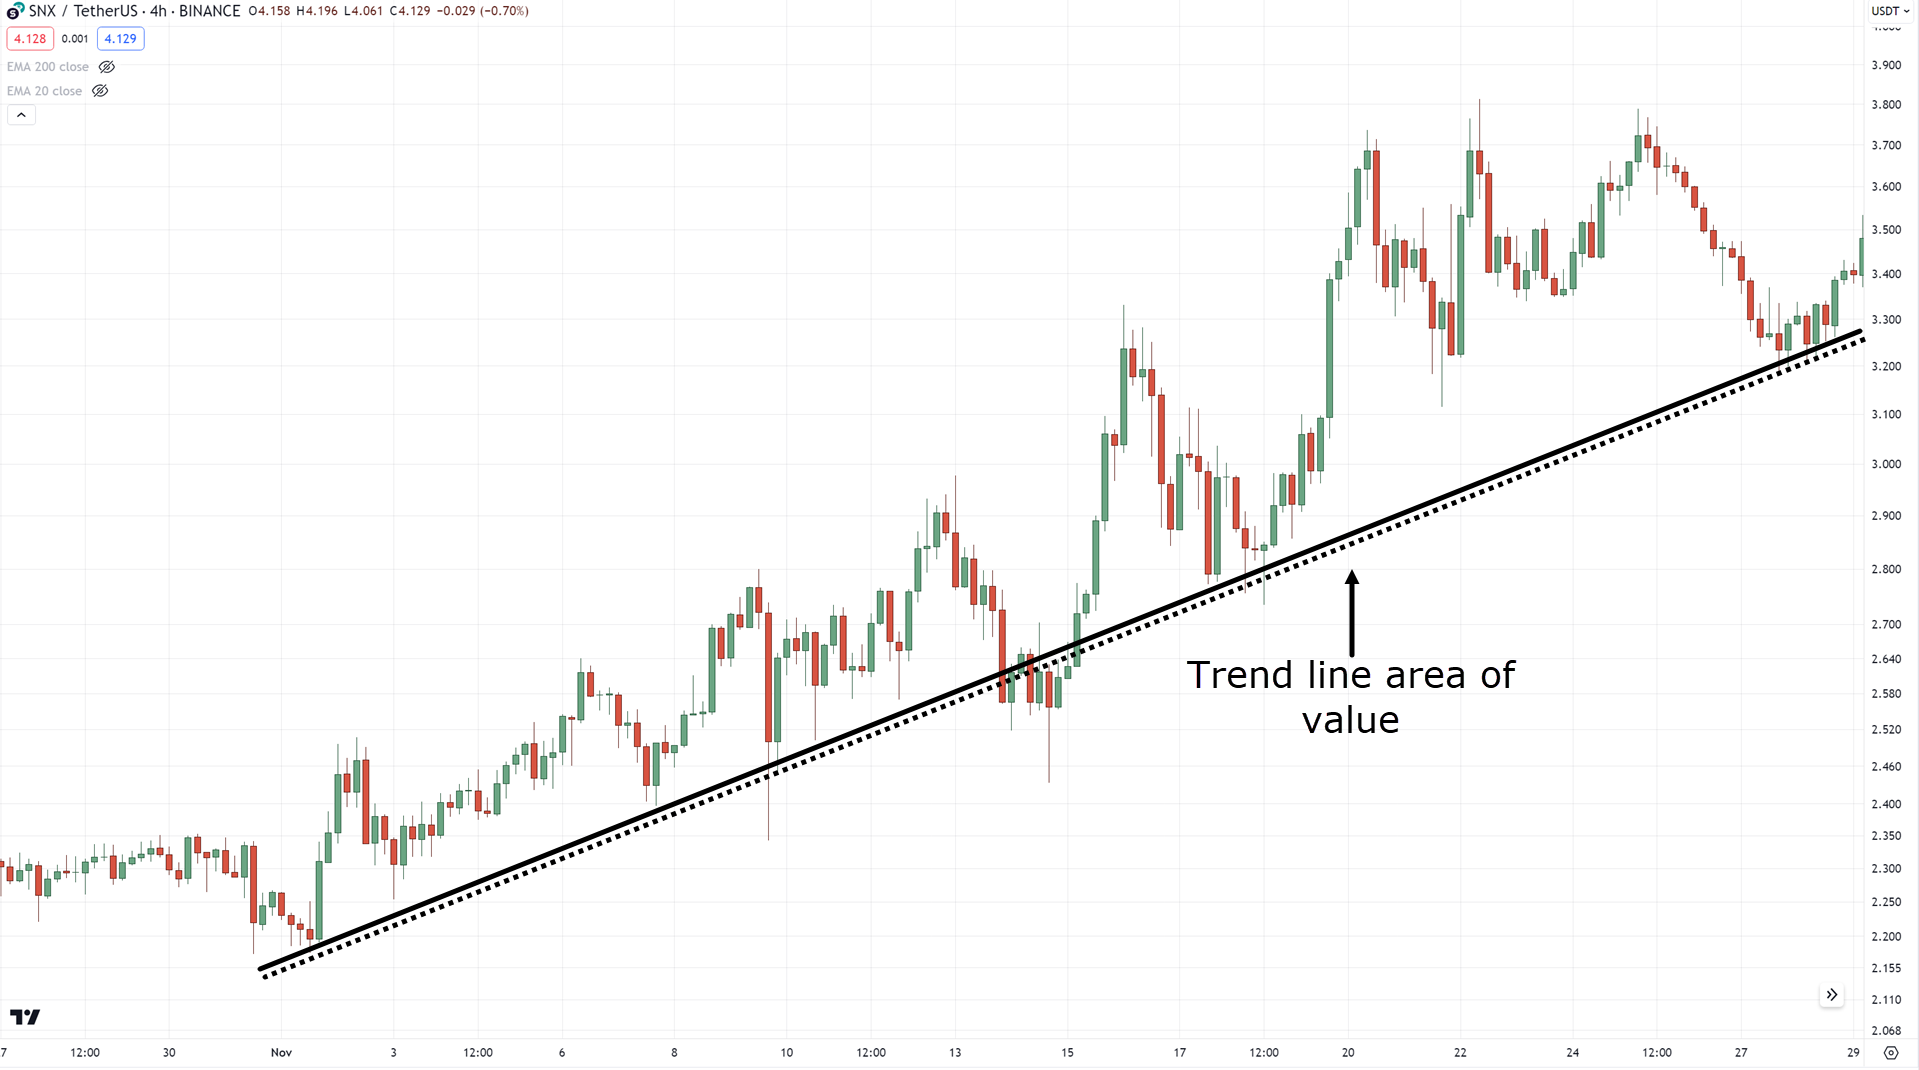
At the same time…
It can be a good basis on where to place your stop loss as well, regardless of any setup…
Alright?
Now there is another piece of advice lurking here…
Beyond a Chart Pattern
This part is something that I may not cover completely today.
Why?
Take a look at this…
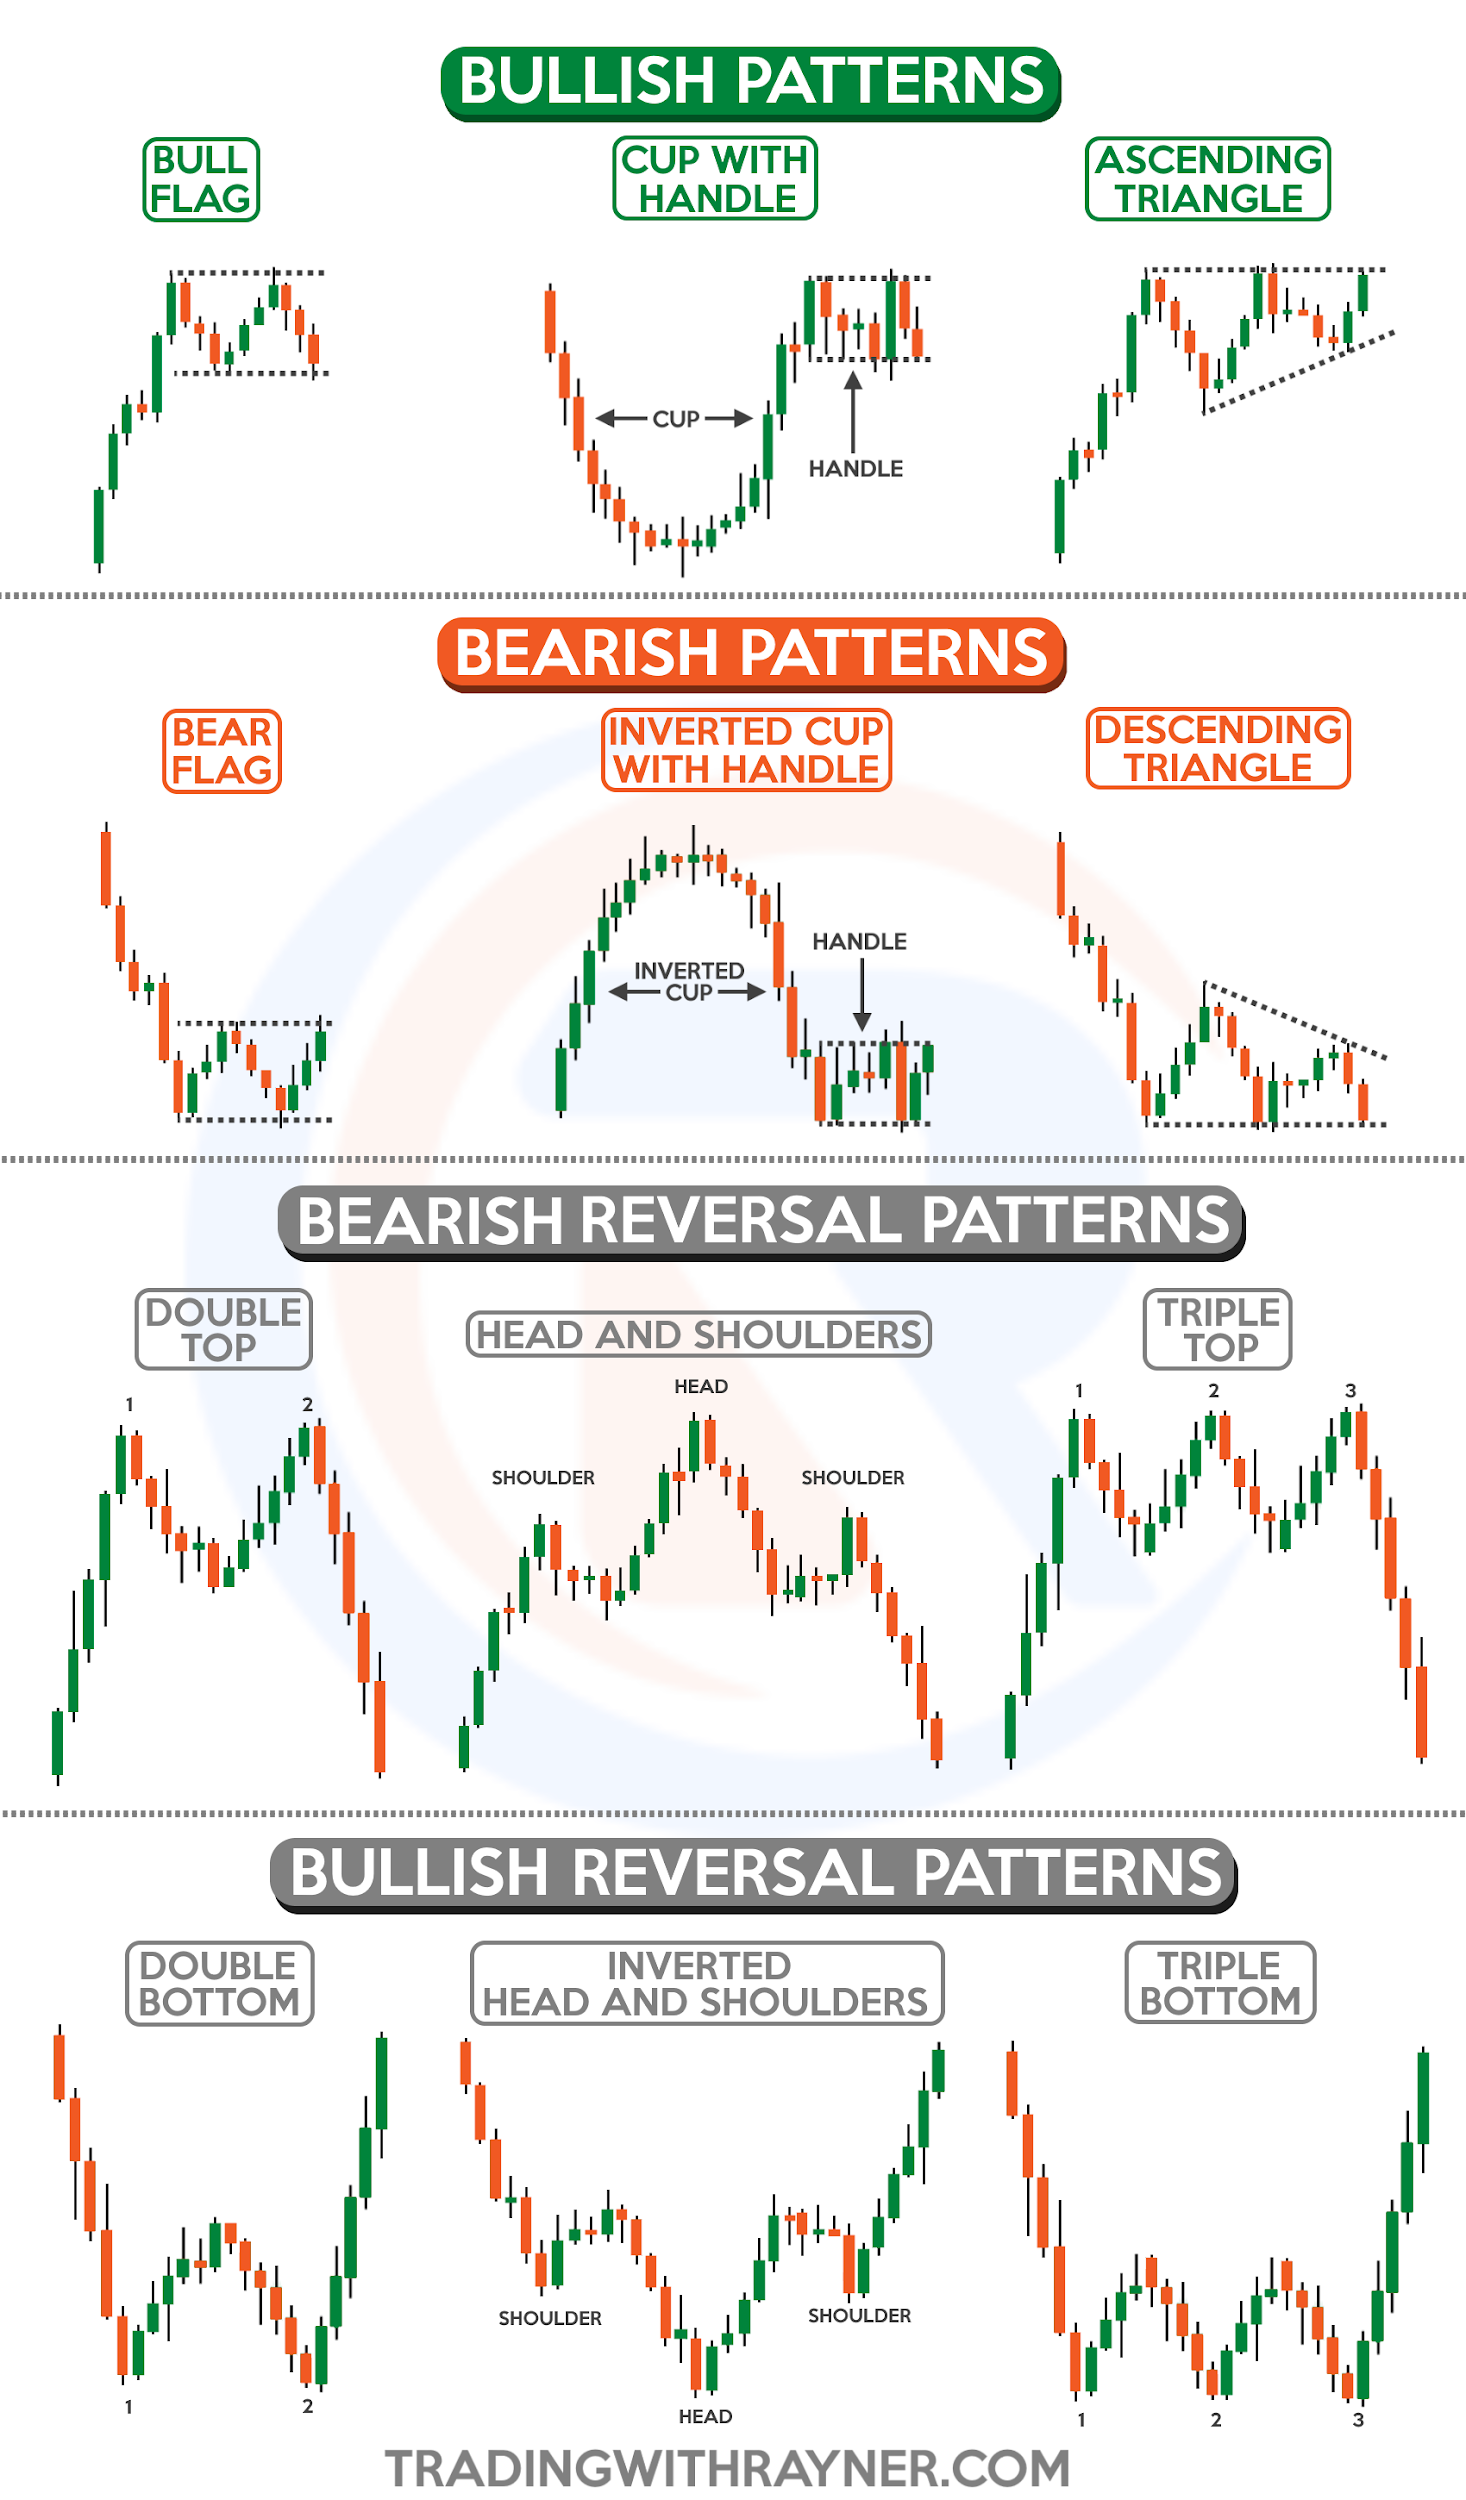
…err, there’s a lot of chart patterns in the market!
While I may not be able to cover all of them today, the main principle is this:
Always know when a chart pattern gets validated (entries)…
…and…
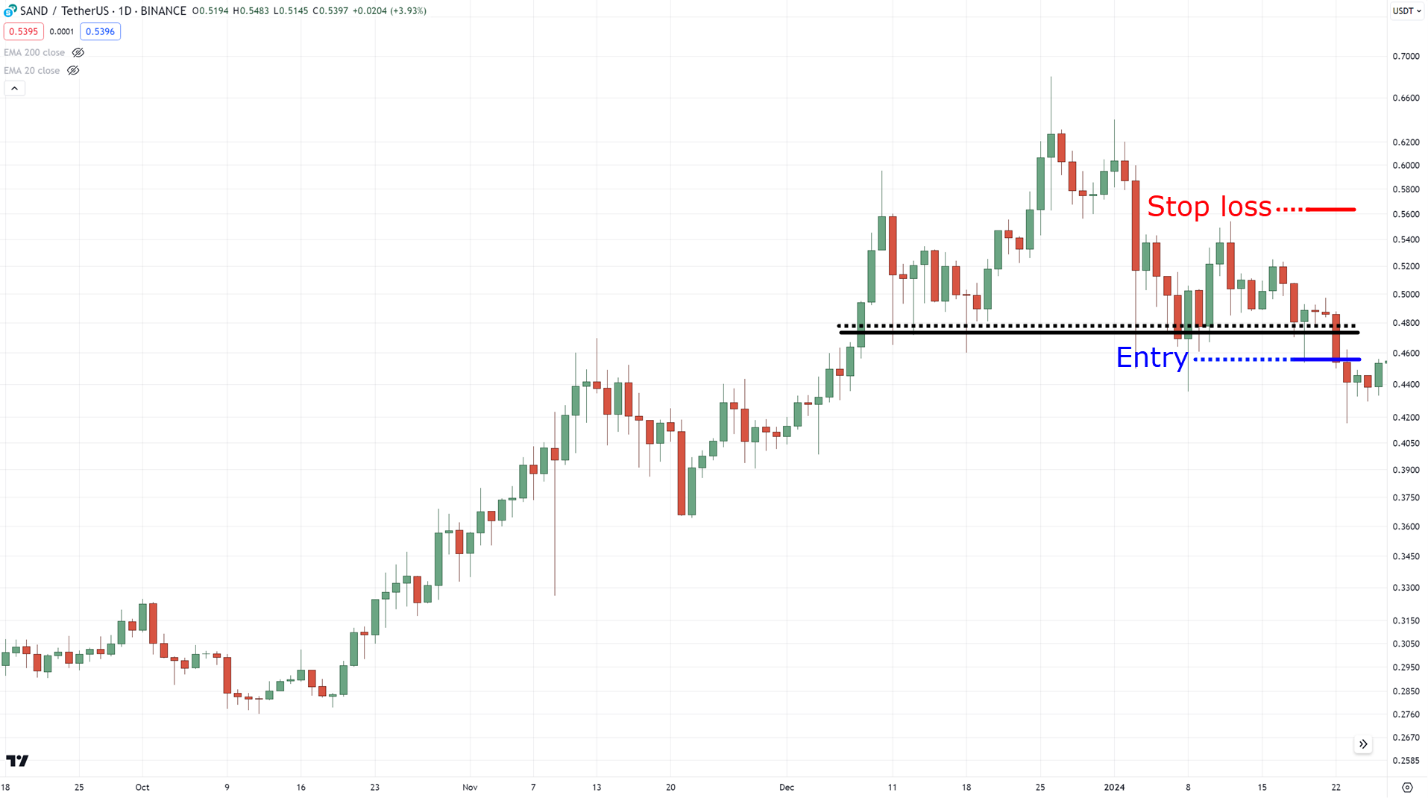
…when it gets invalidated (stop loss)!
For example, a head and shoulders get validated when the price closes below its neckline…
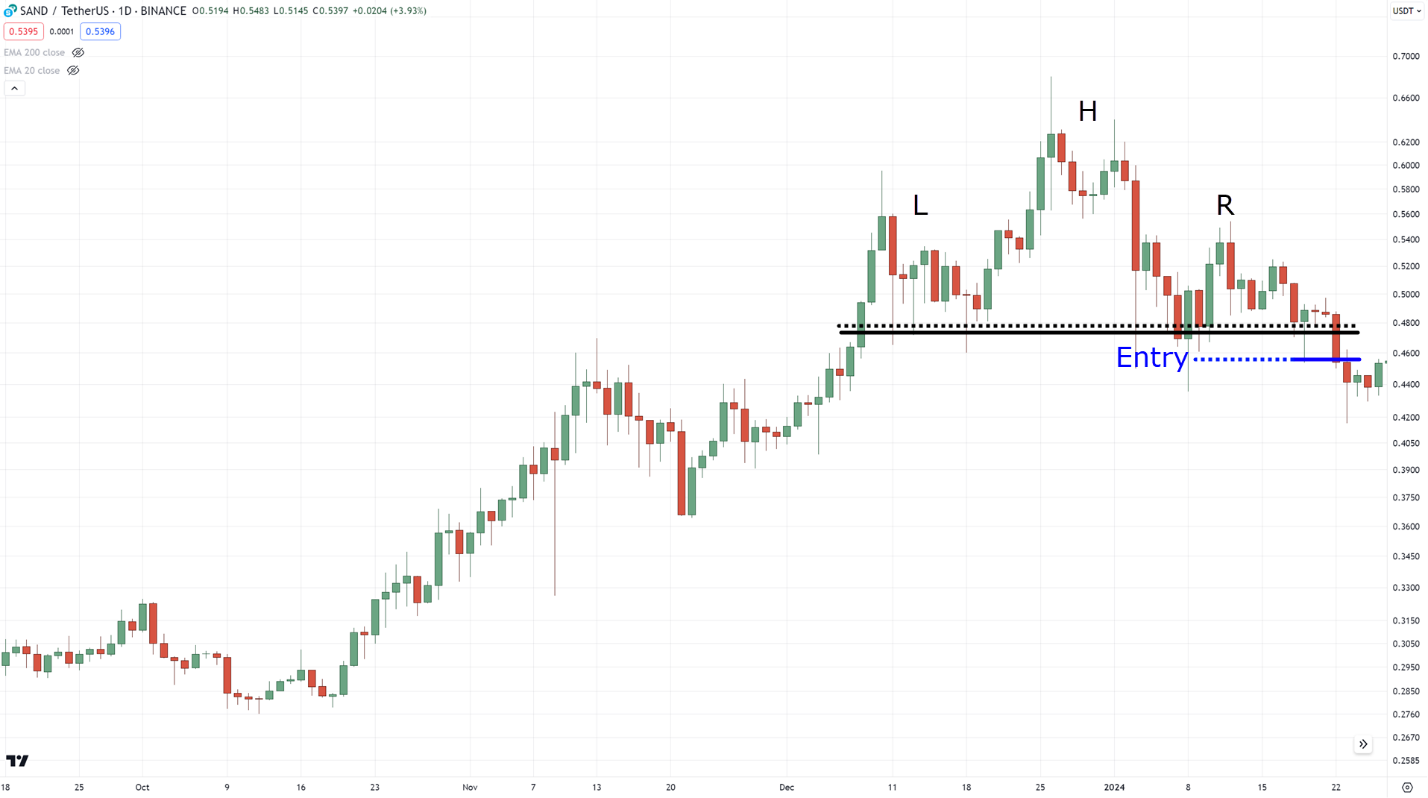
A valid entry trigger, right?
Now, when does it get invalidated?
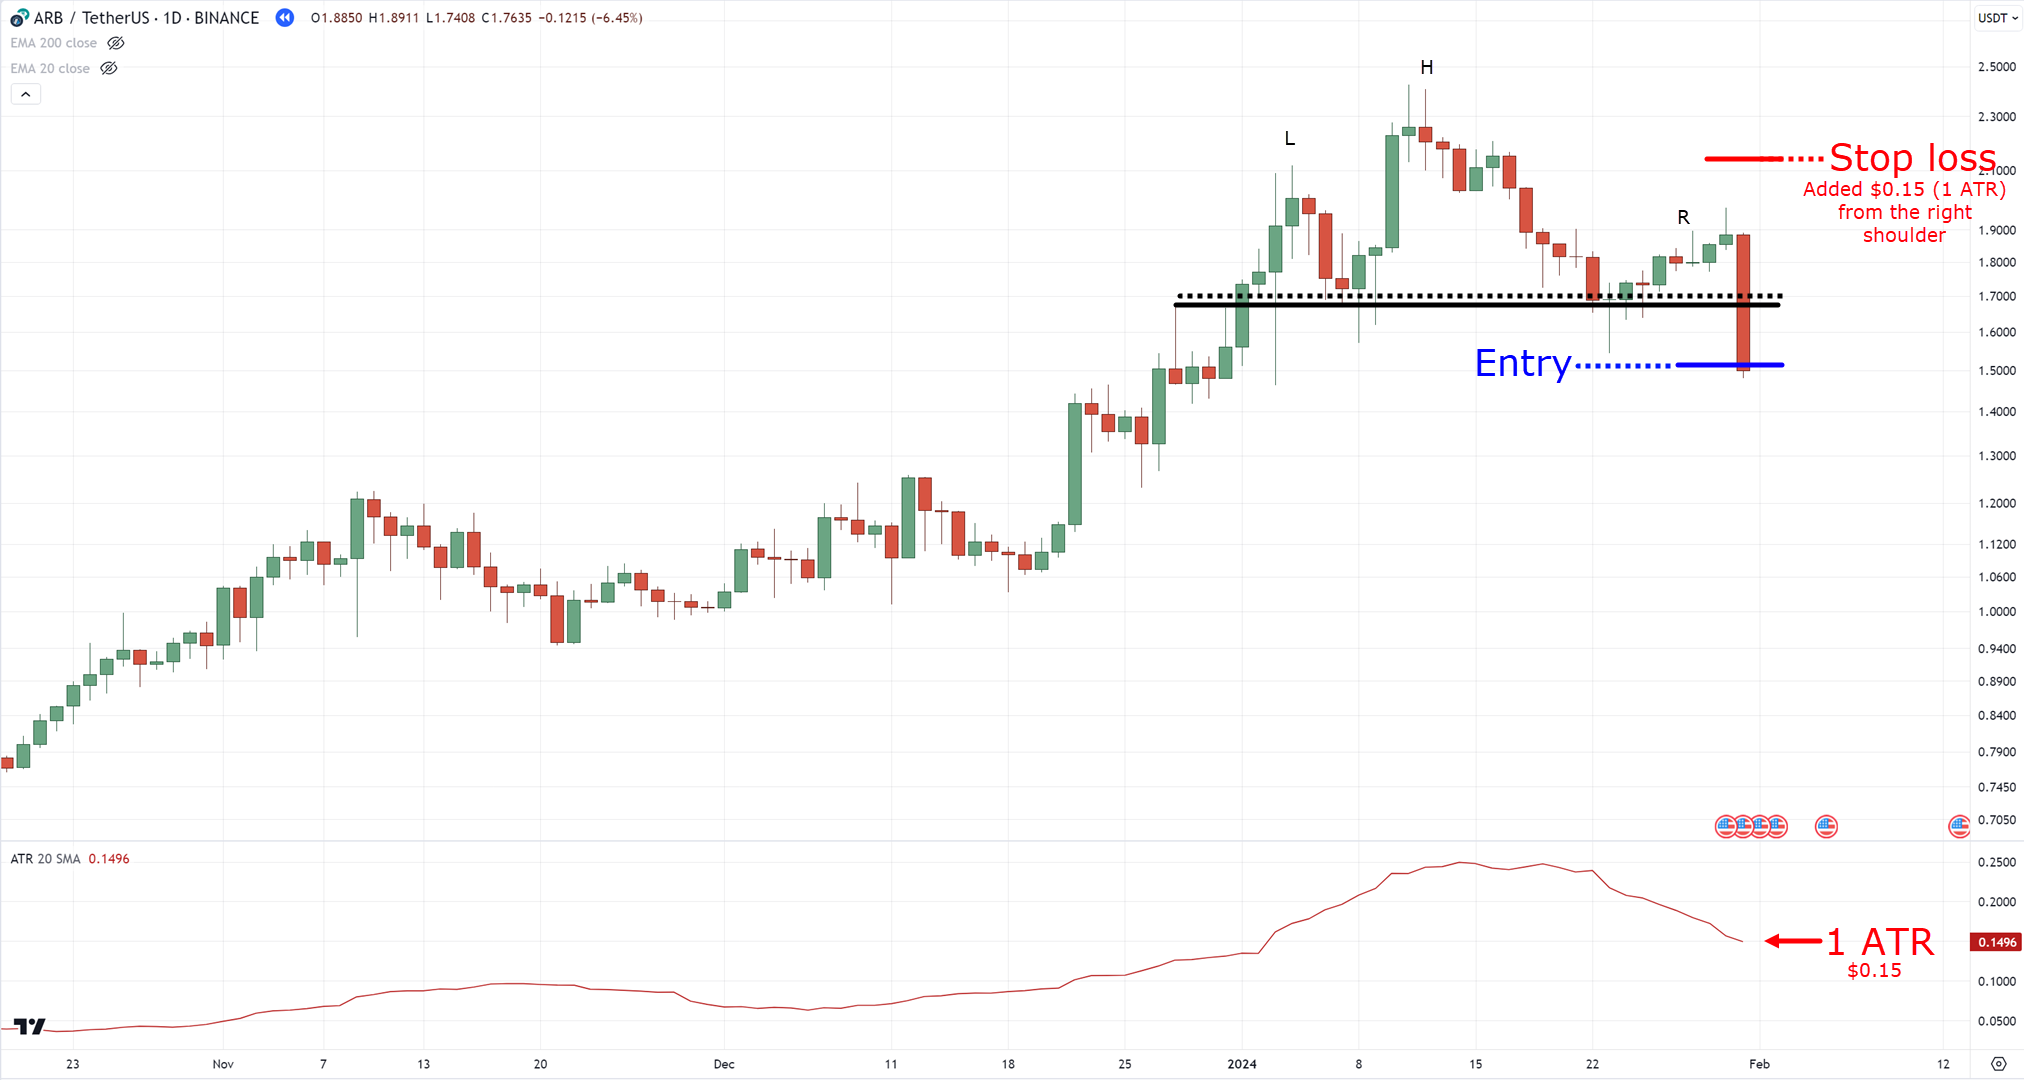
Well, when the price reverses back from its neckline and breaks above the right shoulder!…
See what I mean?
Not only do you have a valid reason for entry – but also a great reason for exit!
I mean, I want us to be on the same page here…
The reason why I share these concepts is not only to reduce your chances of getting stopped out prematurely…
…but to always find a reason behind your stop loss!
That makes sense, right?
Nonetheless, feel free to learn more about these concepts in detail here:
Support and Resistance Trading Strategy — A Beginner’s Guide
The Trend Line Breakout Trading Strategy
The Essential Guide to Chart Patterns
Now…
If you want a much simpler way to place your stop loss, then I have the right set of tools for you in the next section.
So, read on!
The Best Stop Loss Strategy Indicators For Every Type Of Trader
Do you know what the best thing about this section is?
It’s that everything that you’ll learn in this section can be used with the concepts I shared with you earlier!
Furthermore…
What I’ll show you here is especially helpful if you are a “systematic” trader who wants to trade with black-and-white rules.
So, are you ready?
Then let’s get started!
Super Trend Indicator
This indicator is fairly simple, because at first glance…
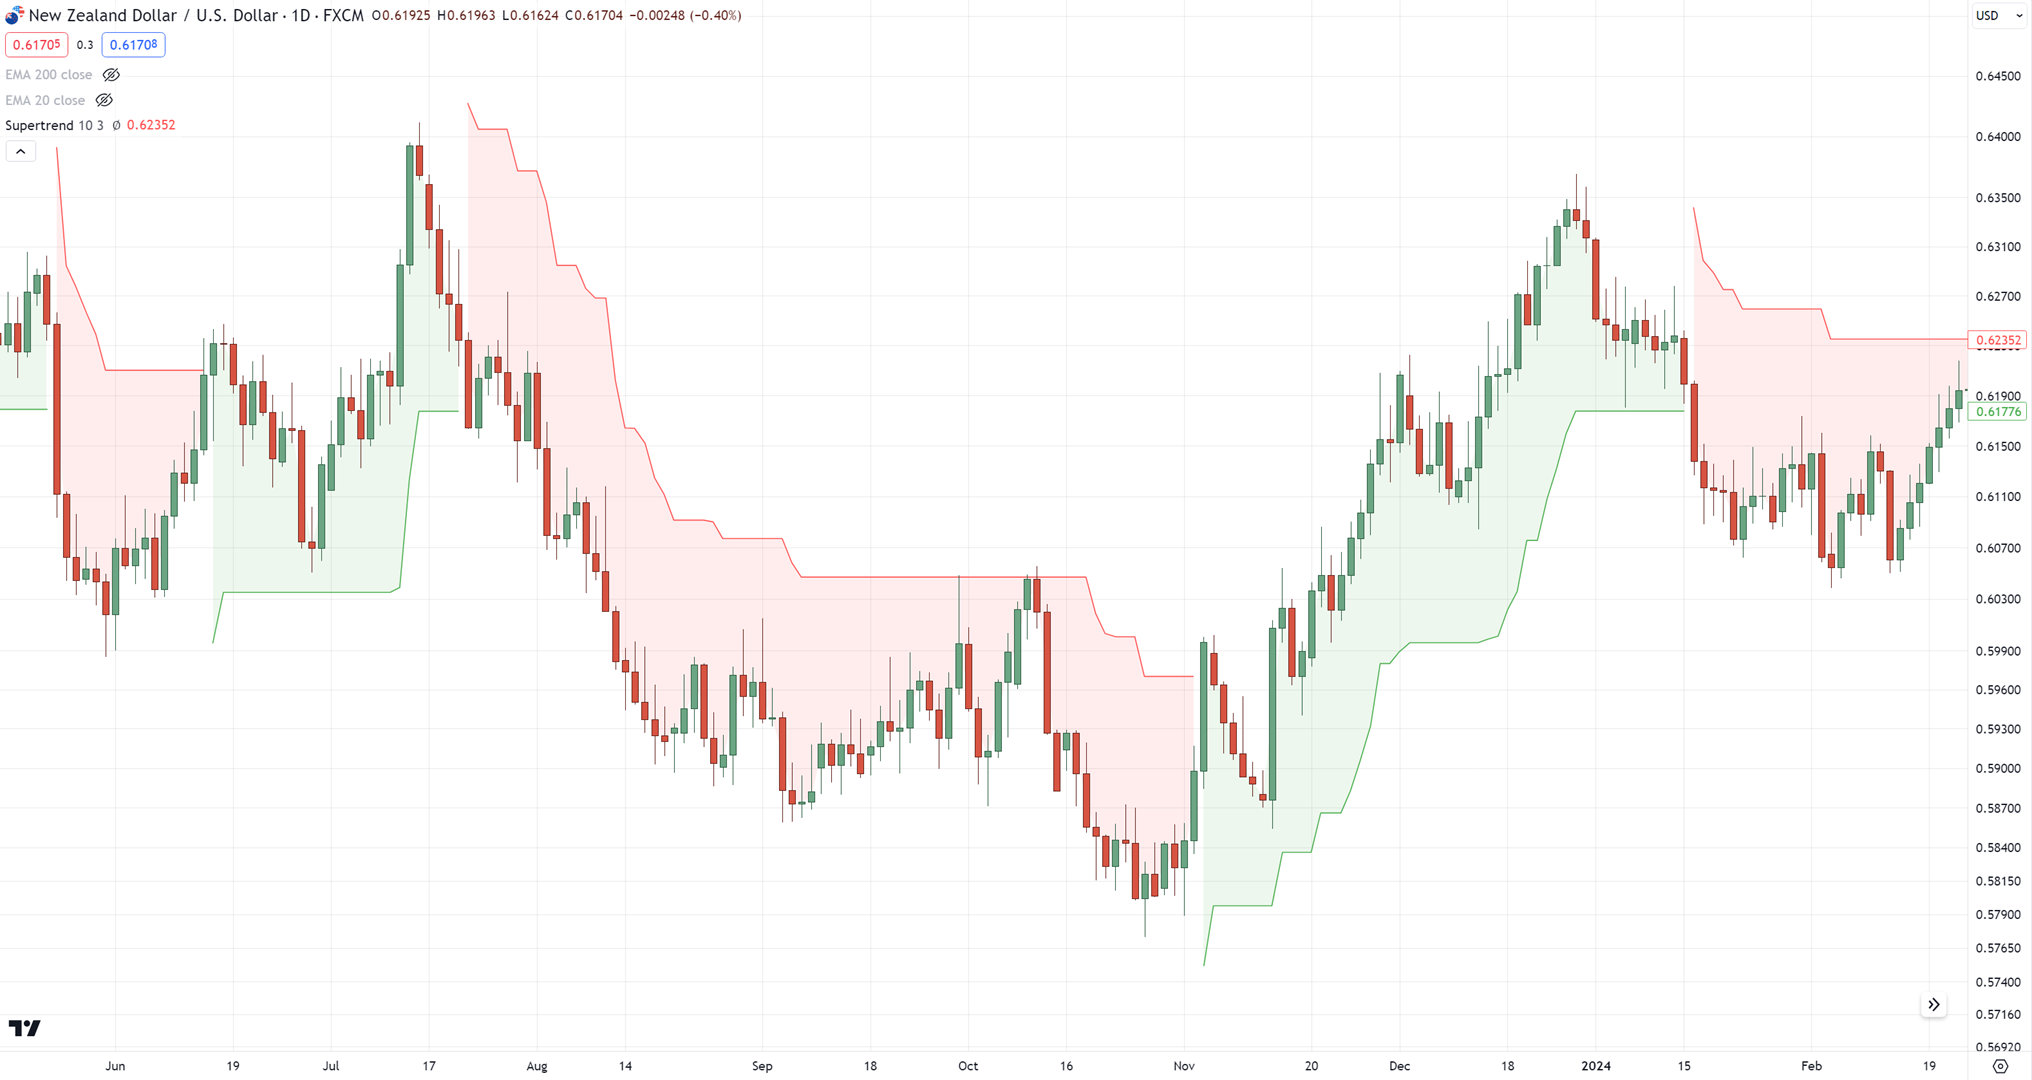
…I think you already know where your stop loss should be!
So, if you want to take long trades, base your stop loss on the green line!
For short trades?
The red line!
But the real question is, how does this indicator produce such a signal?
What’s the best setting to use?
Well, in terms of settings, you always want to ask yourself this:
Which setting is the most suitable for my trading style?
Let me explain…
If you want to capture short-term trends, then using this setting will help…
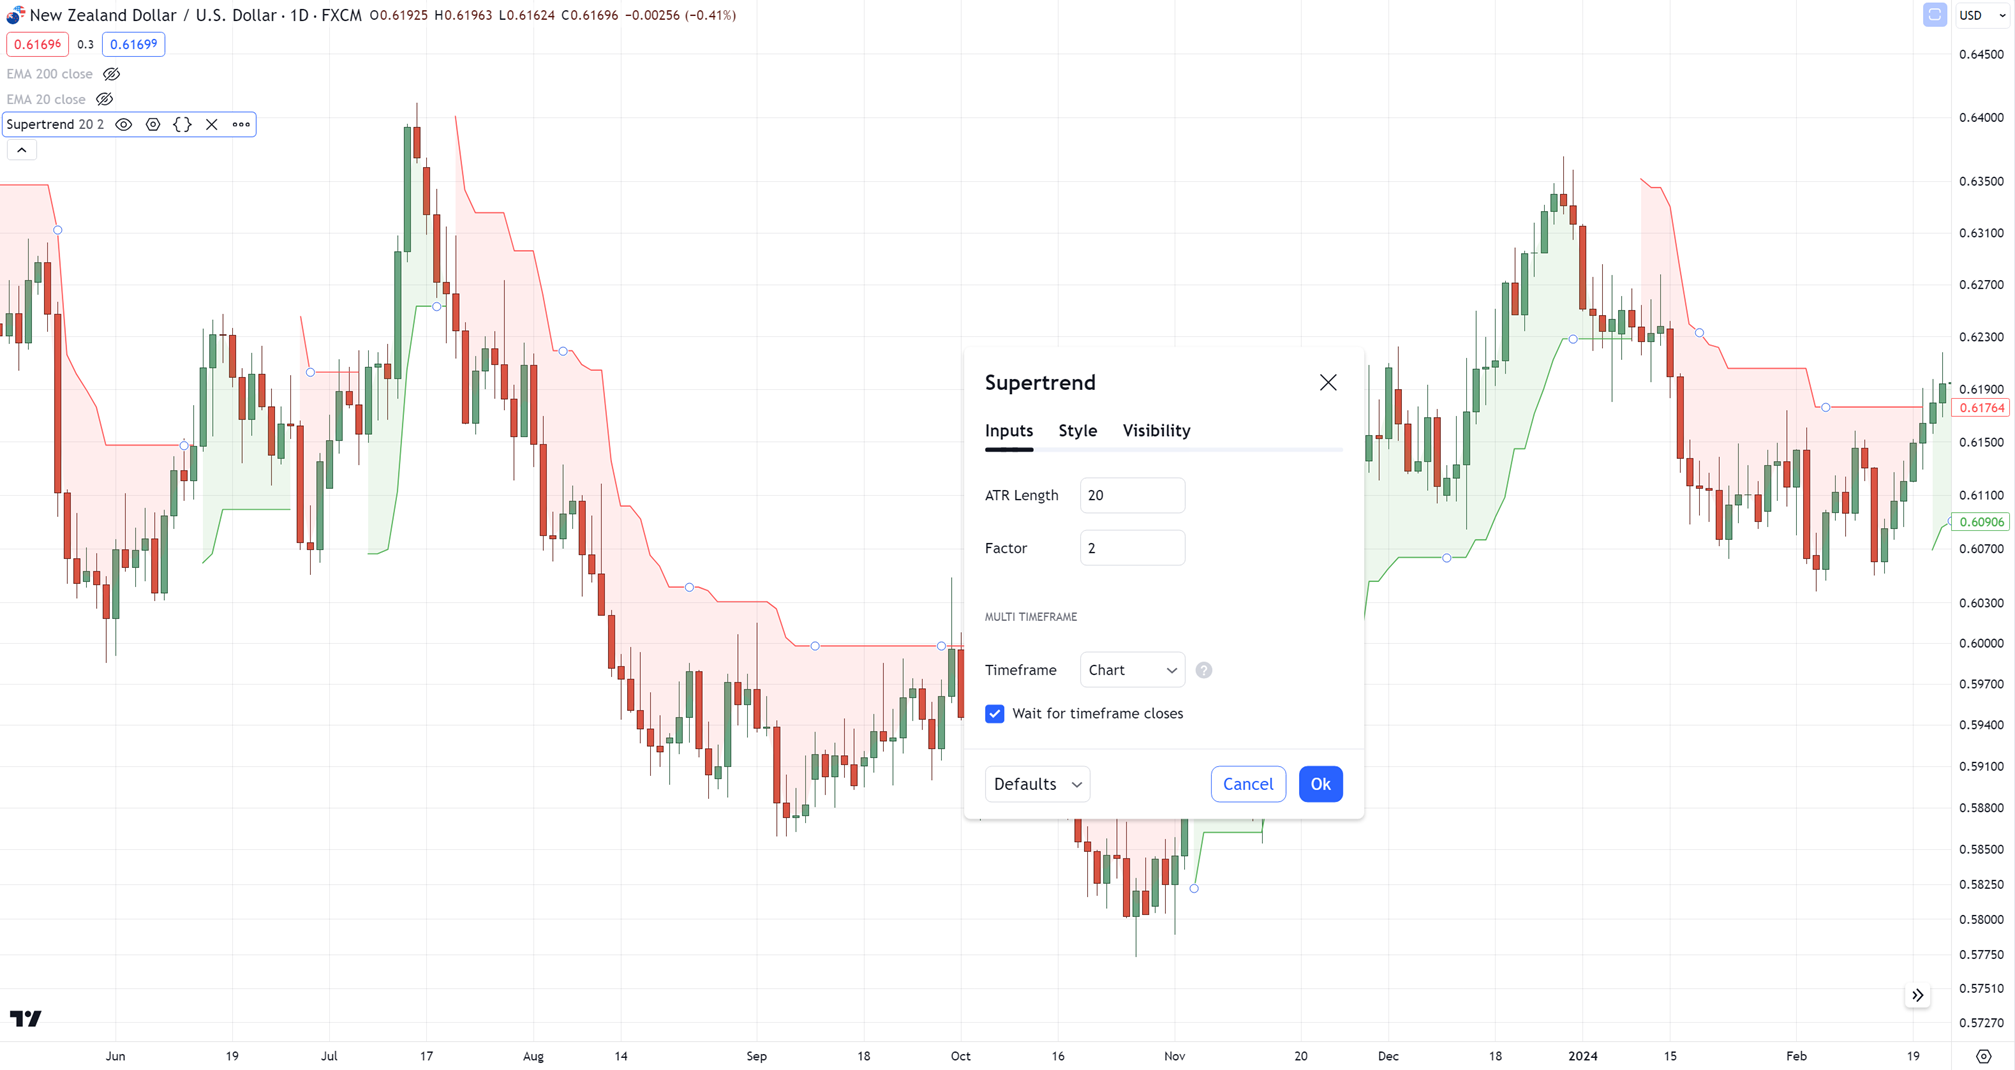
For medium-term trends, you can consider this…
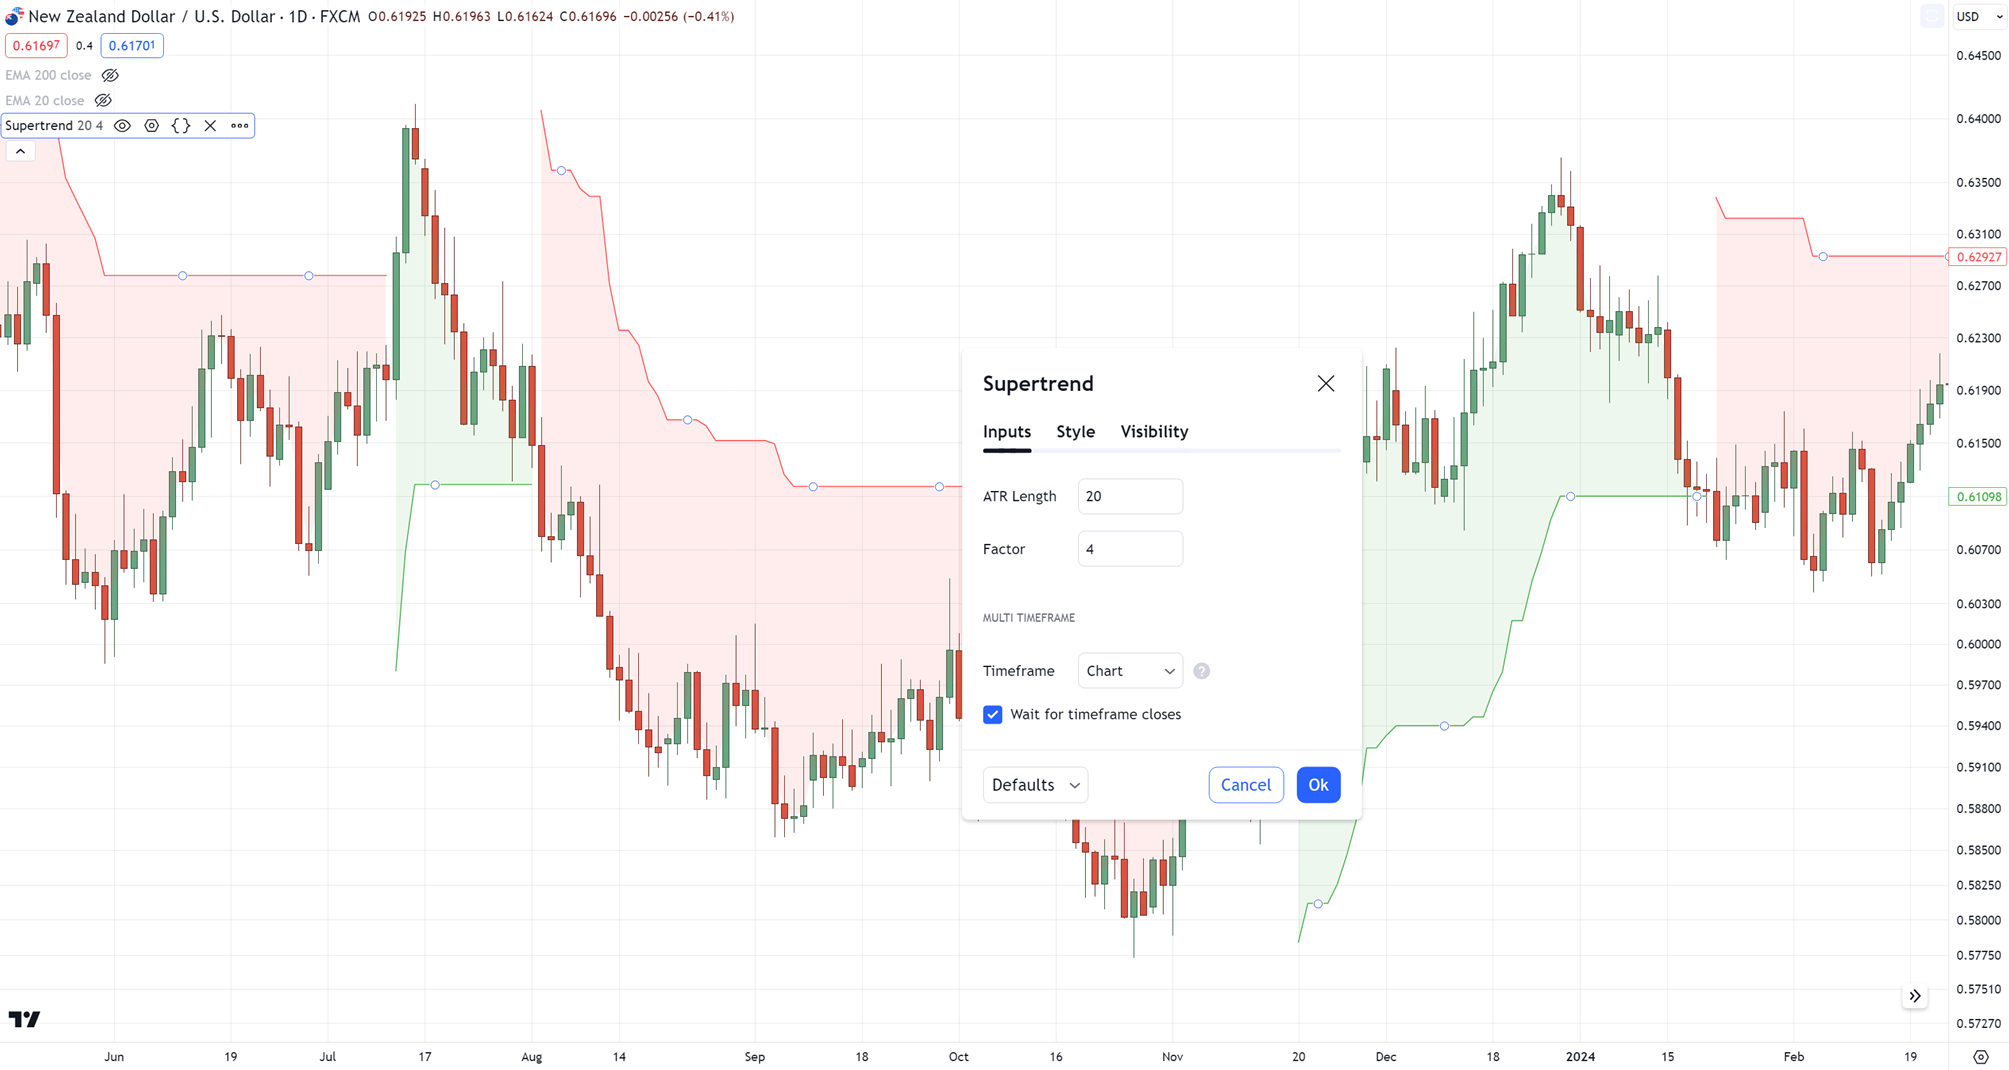
Finally, if you’re a trader who wants to capture long-term trends, then this setting may help…
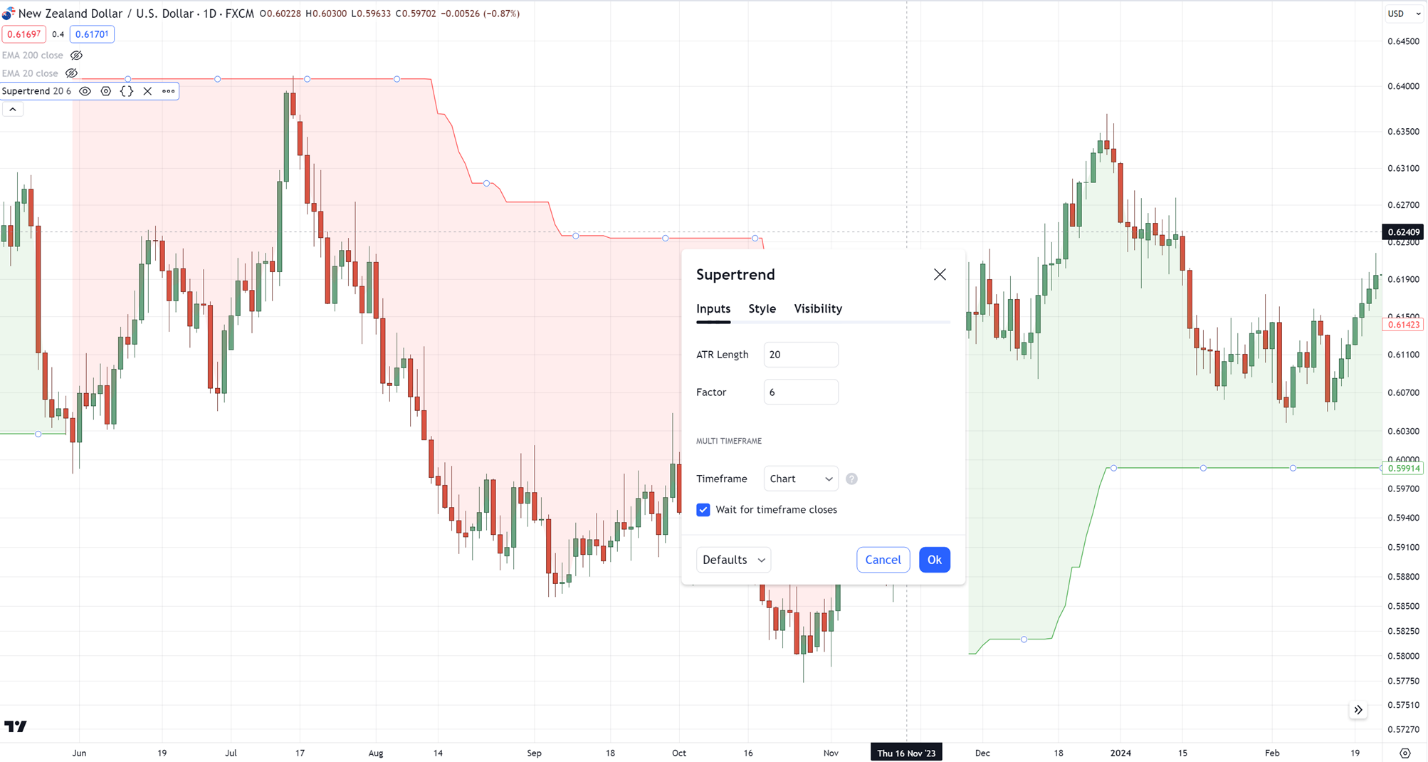
Of course, you don’t have to copy the exact settings!
But the principle is to choose the “relevant” period based on how you want to manage your trade.
(And this applies to any indicator you’ll use!)
So, going back to the question:
How does this indicator get its values?
Simply put, this indicator is just a visualization of the…
Average True Range Indicator
What the ATR indicator does is measure the volatility of the market for a given period.
For example…
If the ATR indicator value shows that the volatility over the past 20 days is 70 pips…
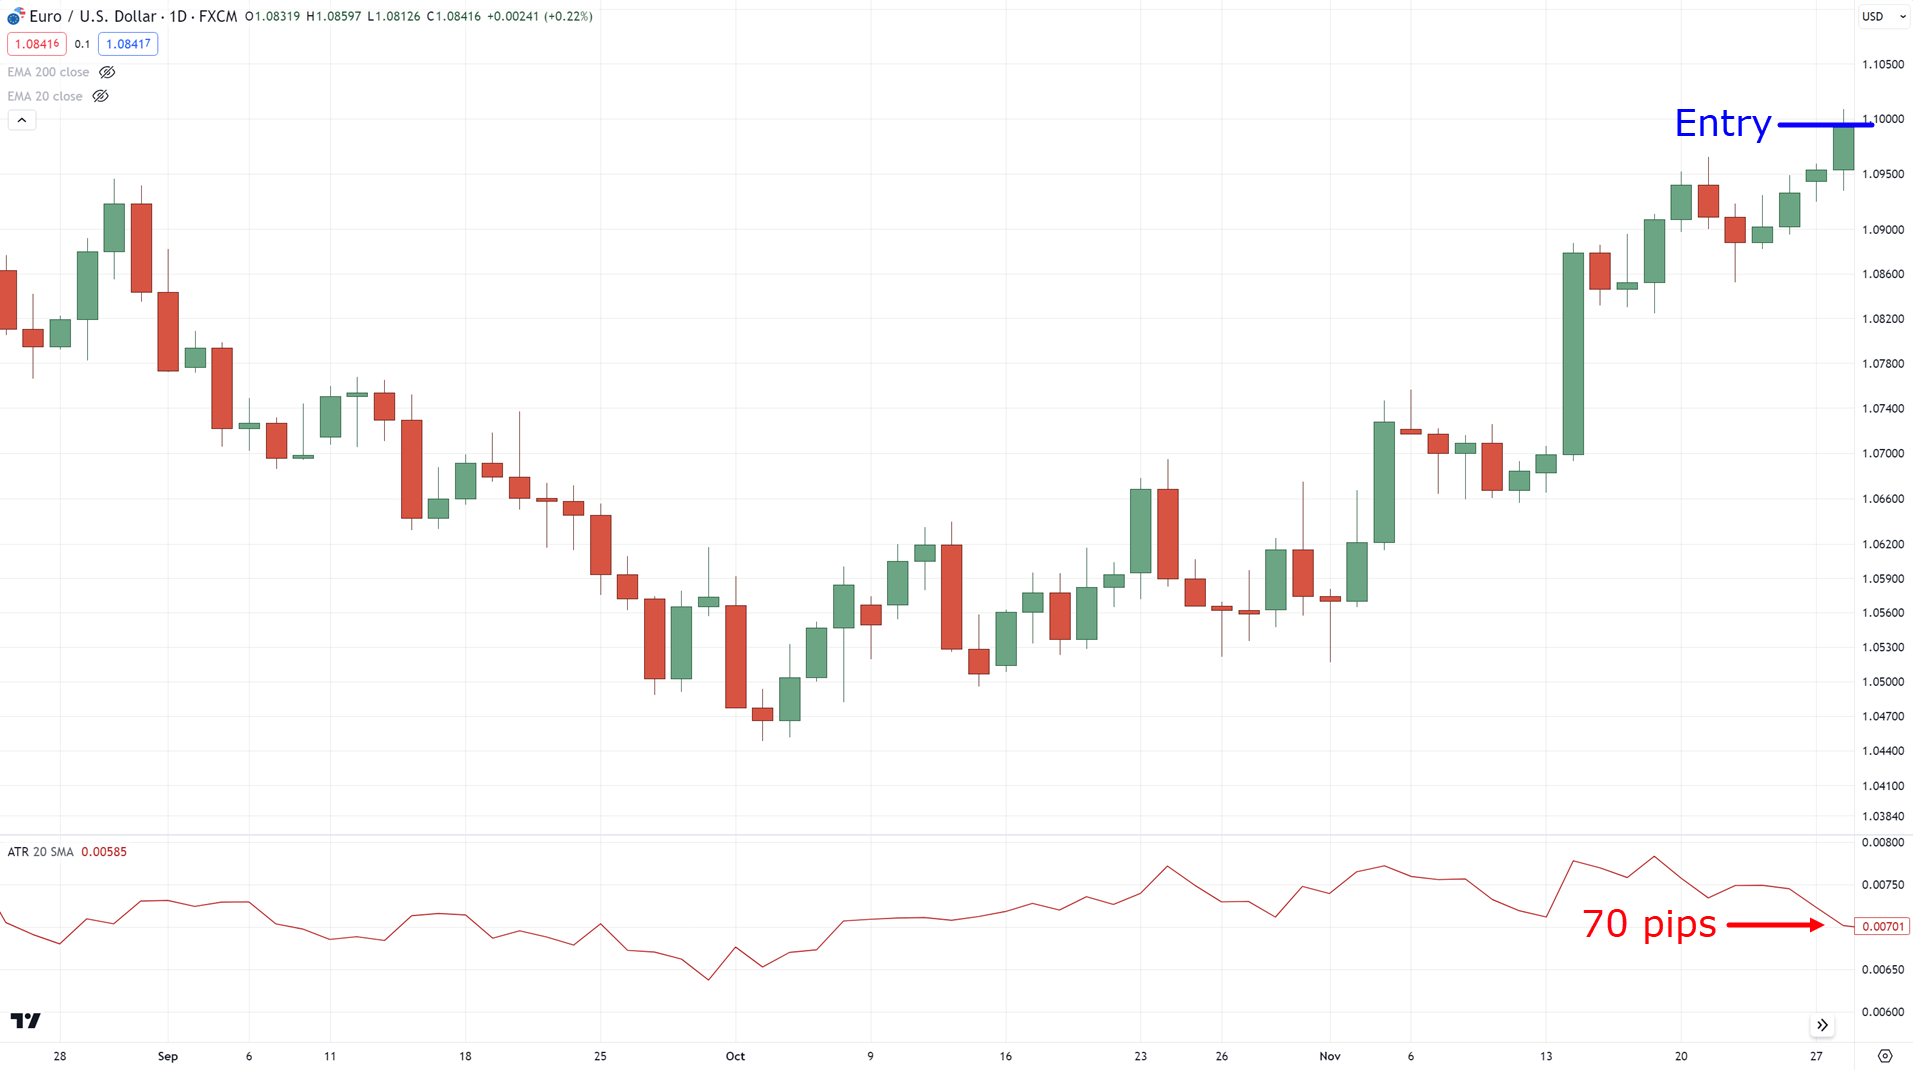
Then you want to stay out of that volatility by having a stop loss of more than 70 pips!…
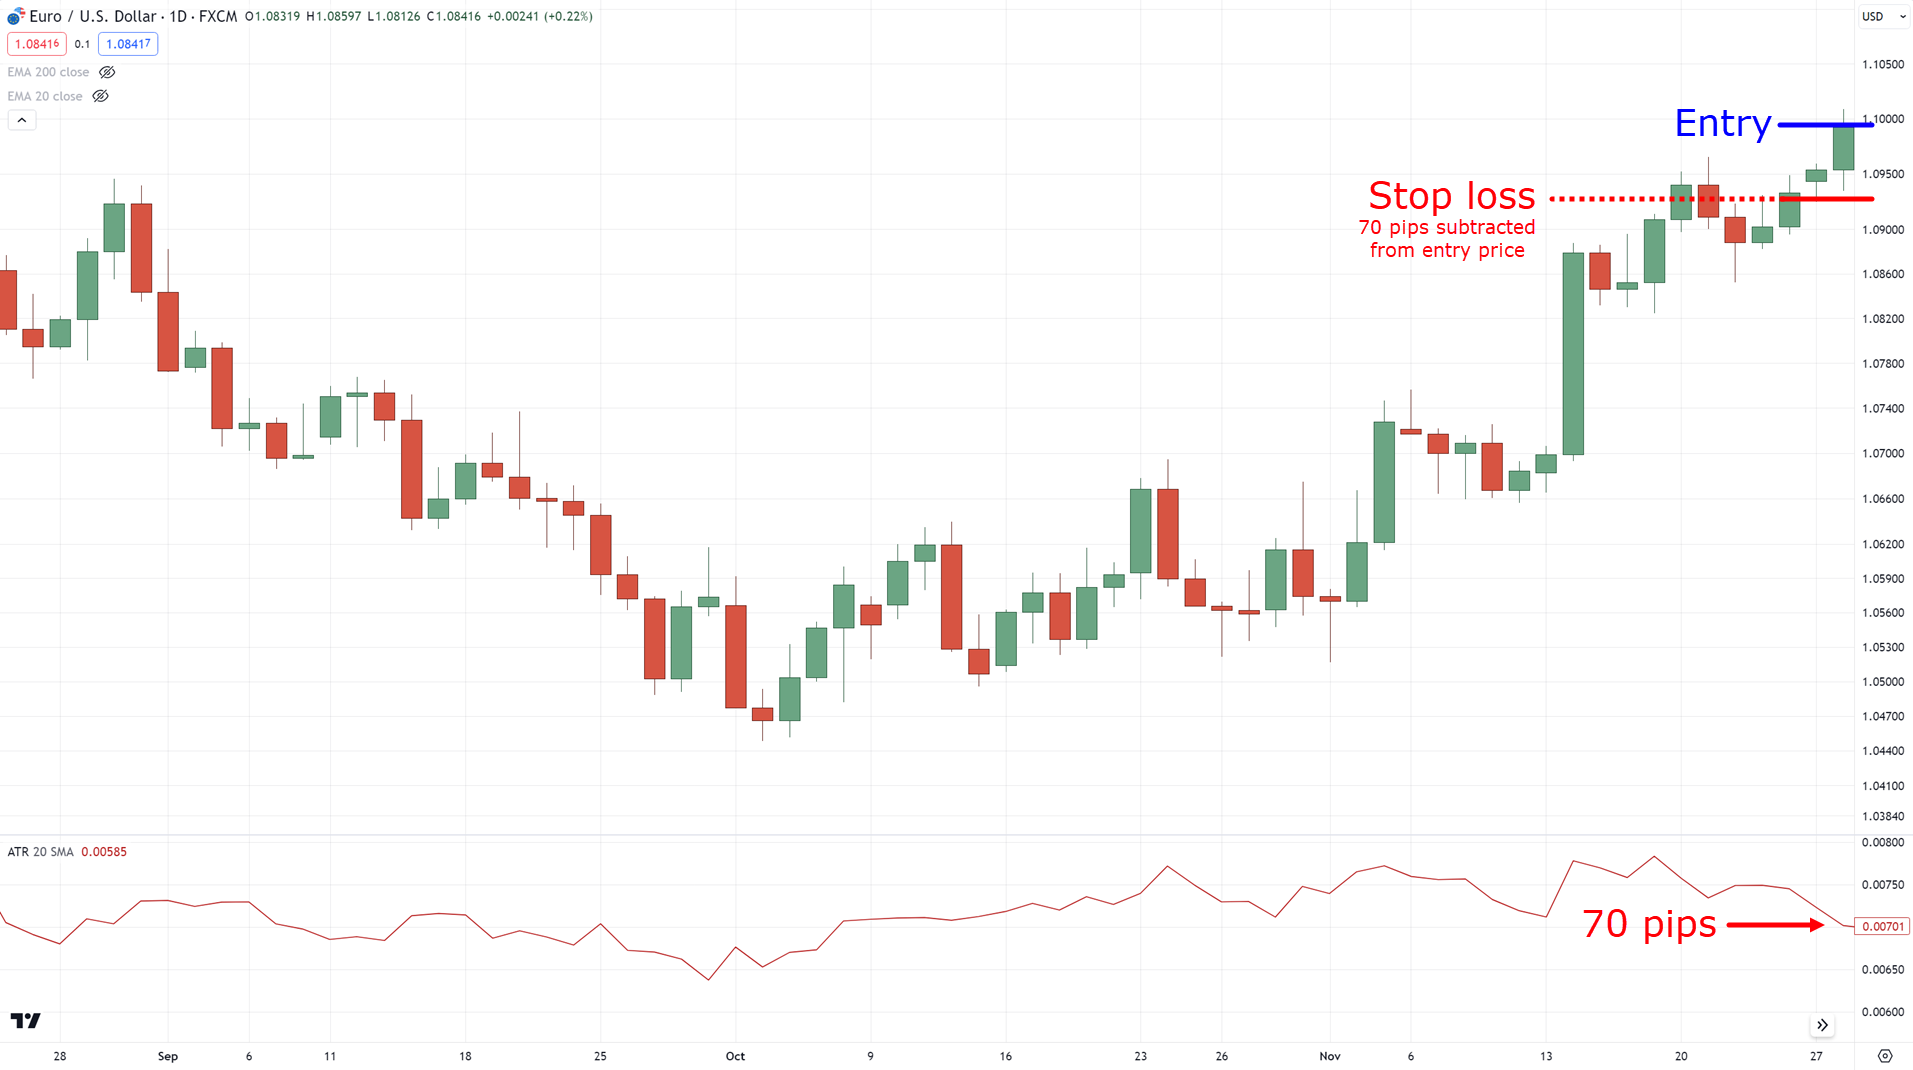
This is the same principle as how the super trend indicator is calculated.
However, it is tailored for trend followers.
But if you are a range trader…
Then you can consider utilizing the ATR indicator across different concepts!
Such as subtracting 1 ATR below the area of support…
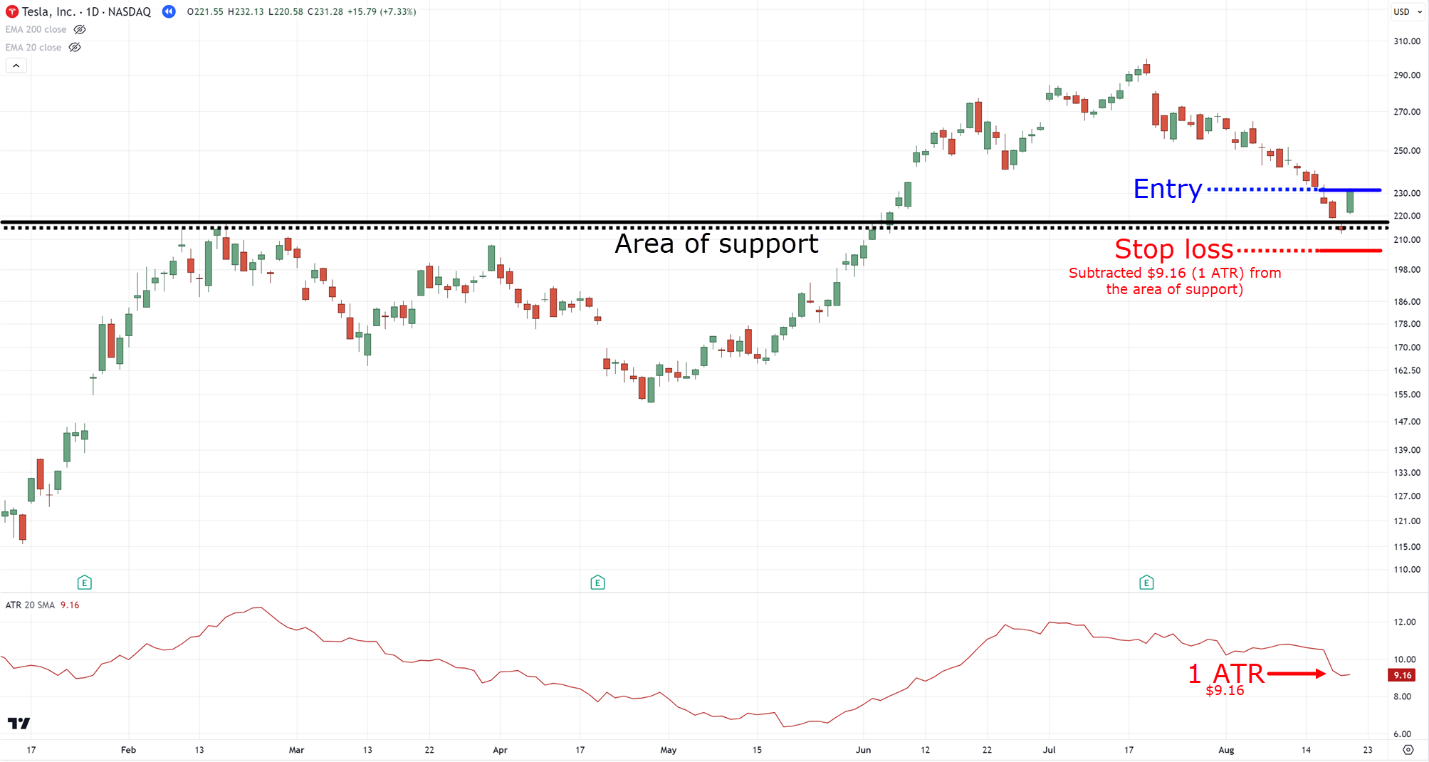
Or adding 1 ATR above the right shoulder of the pattern…
Is everything starting to fall into place?
Well, finally, we have the Donchian Channel indicator…
Donchian Channel
Now, compared to the previous indicators I shared with you…
This is probably the easiest to understand.
At the same time, it can both be used to base your entries and stop loss.
Let me explain…
The Donchian Channel simply represents the highs or lows on your chart.
For example, if you want to look for the highest highs over the last 50 days, the Donchian Channel’s got you covered!…
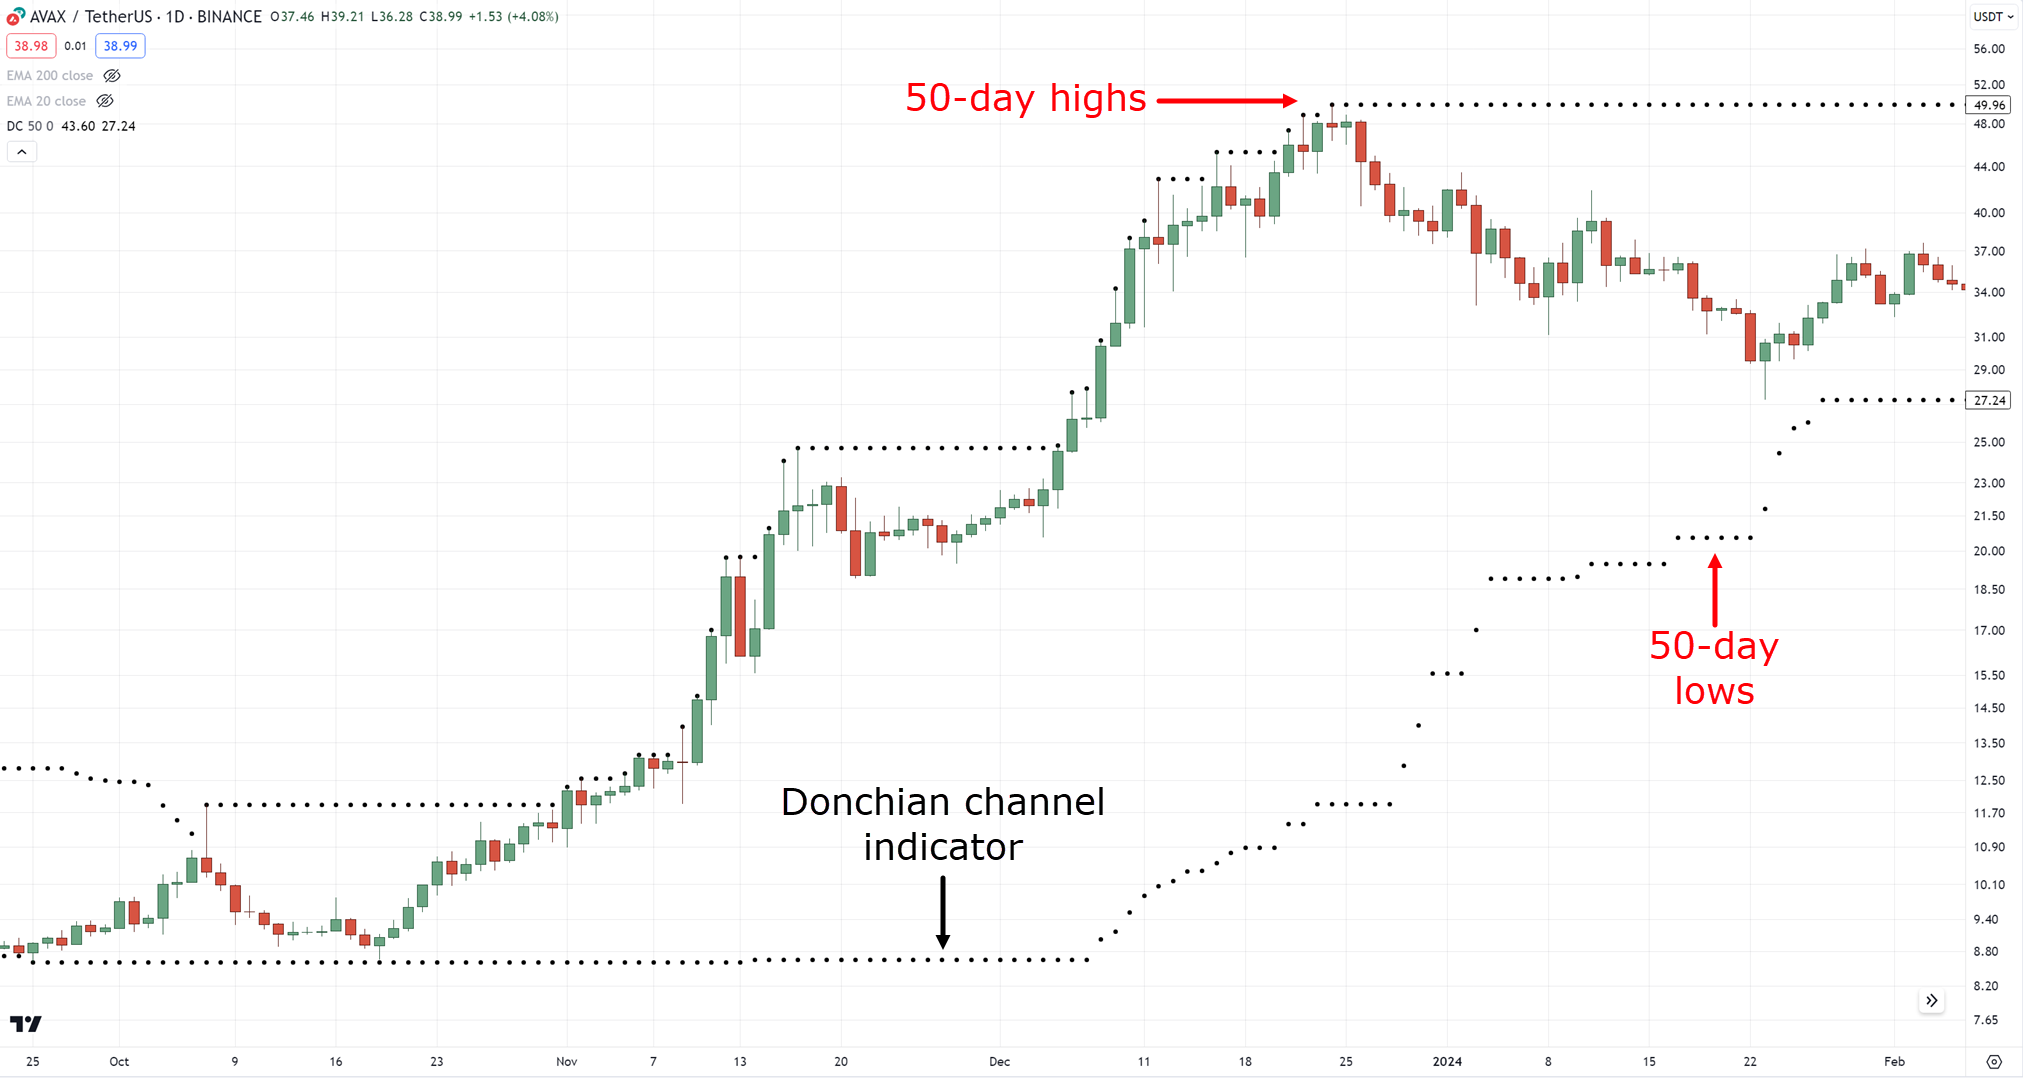
What’s wonderful about this indicator is that you can use it to enter and exit your trades.
In this case, you can consider entering the next candle open if it makes a 50-day high close…
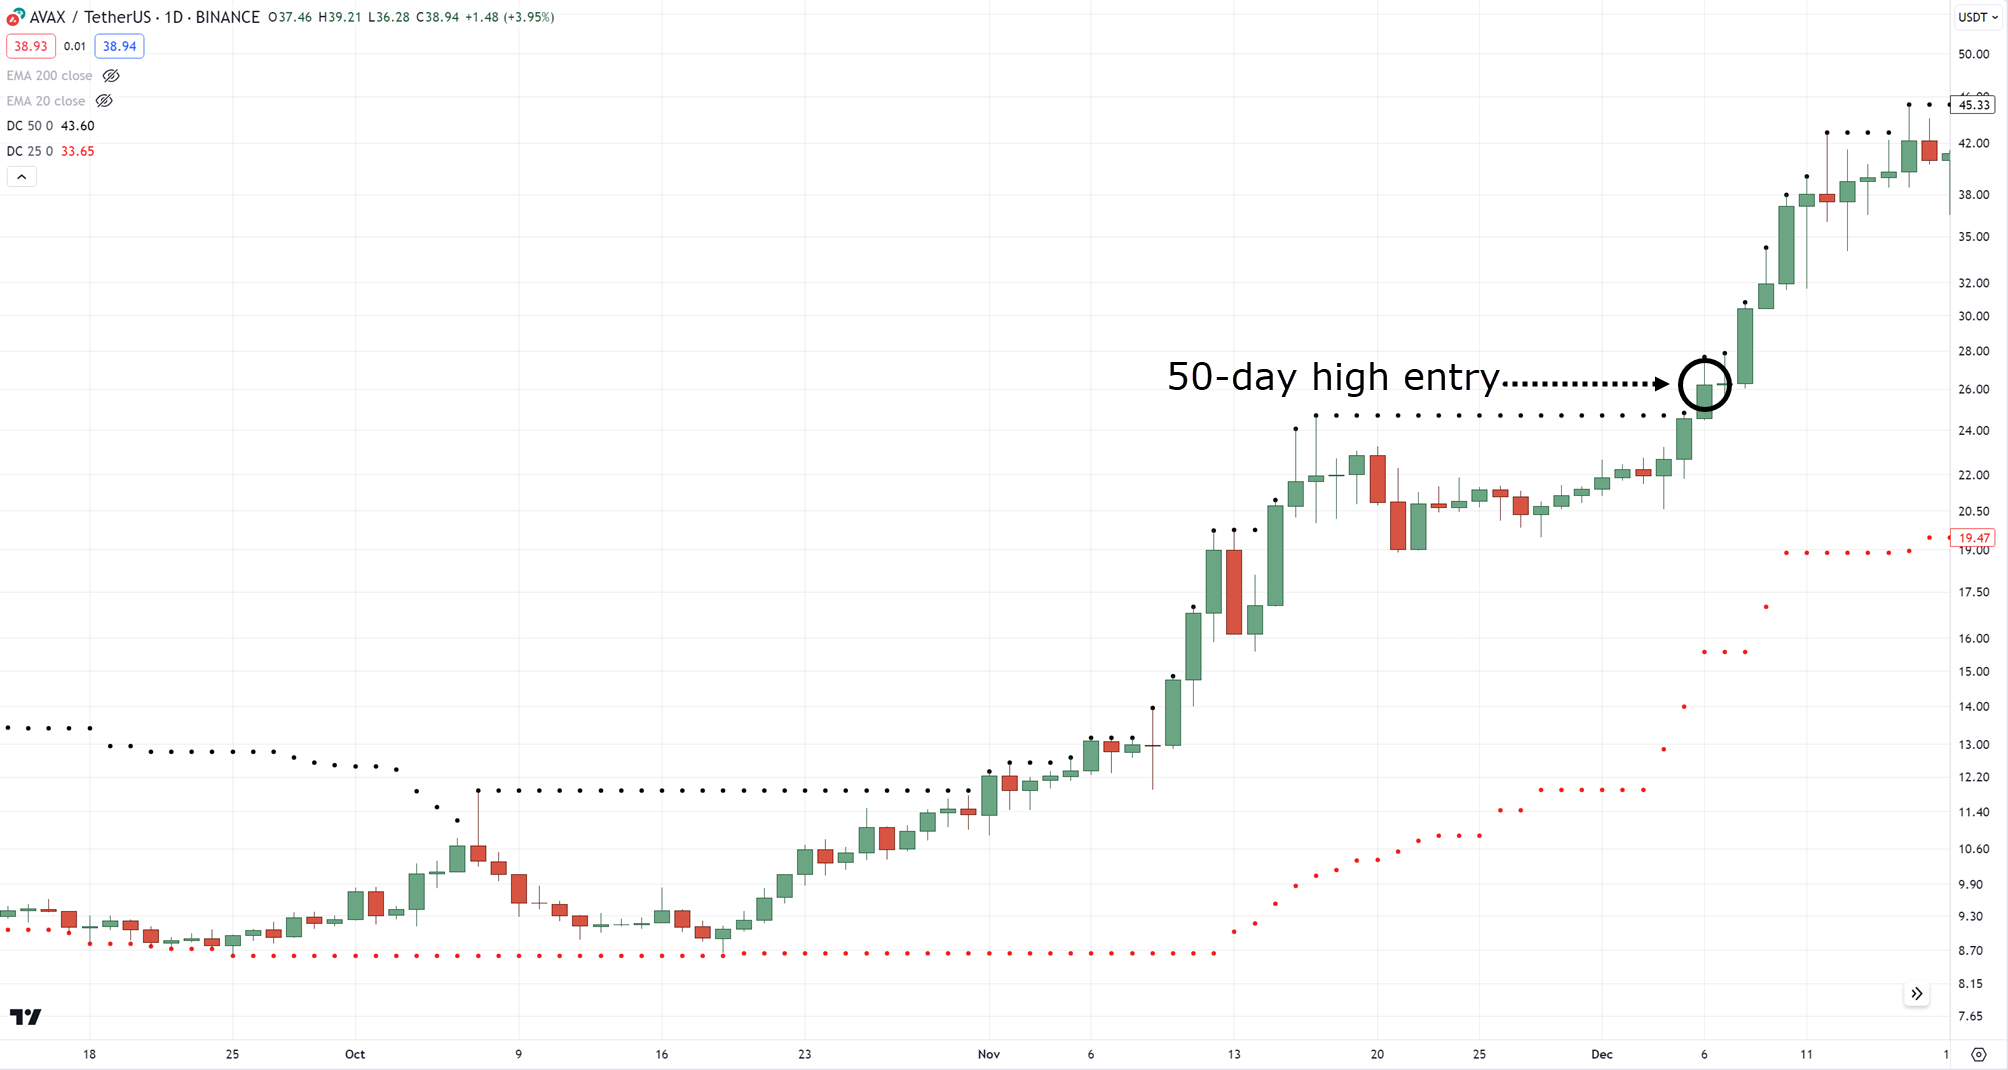
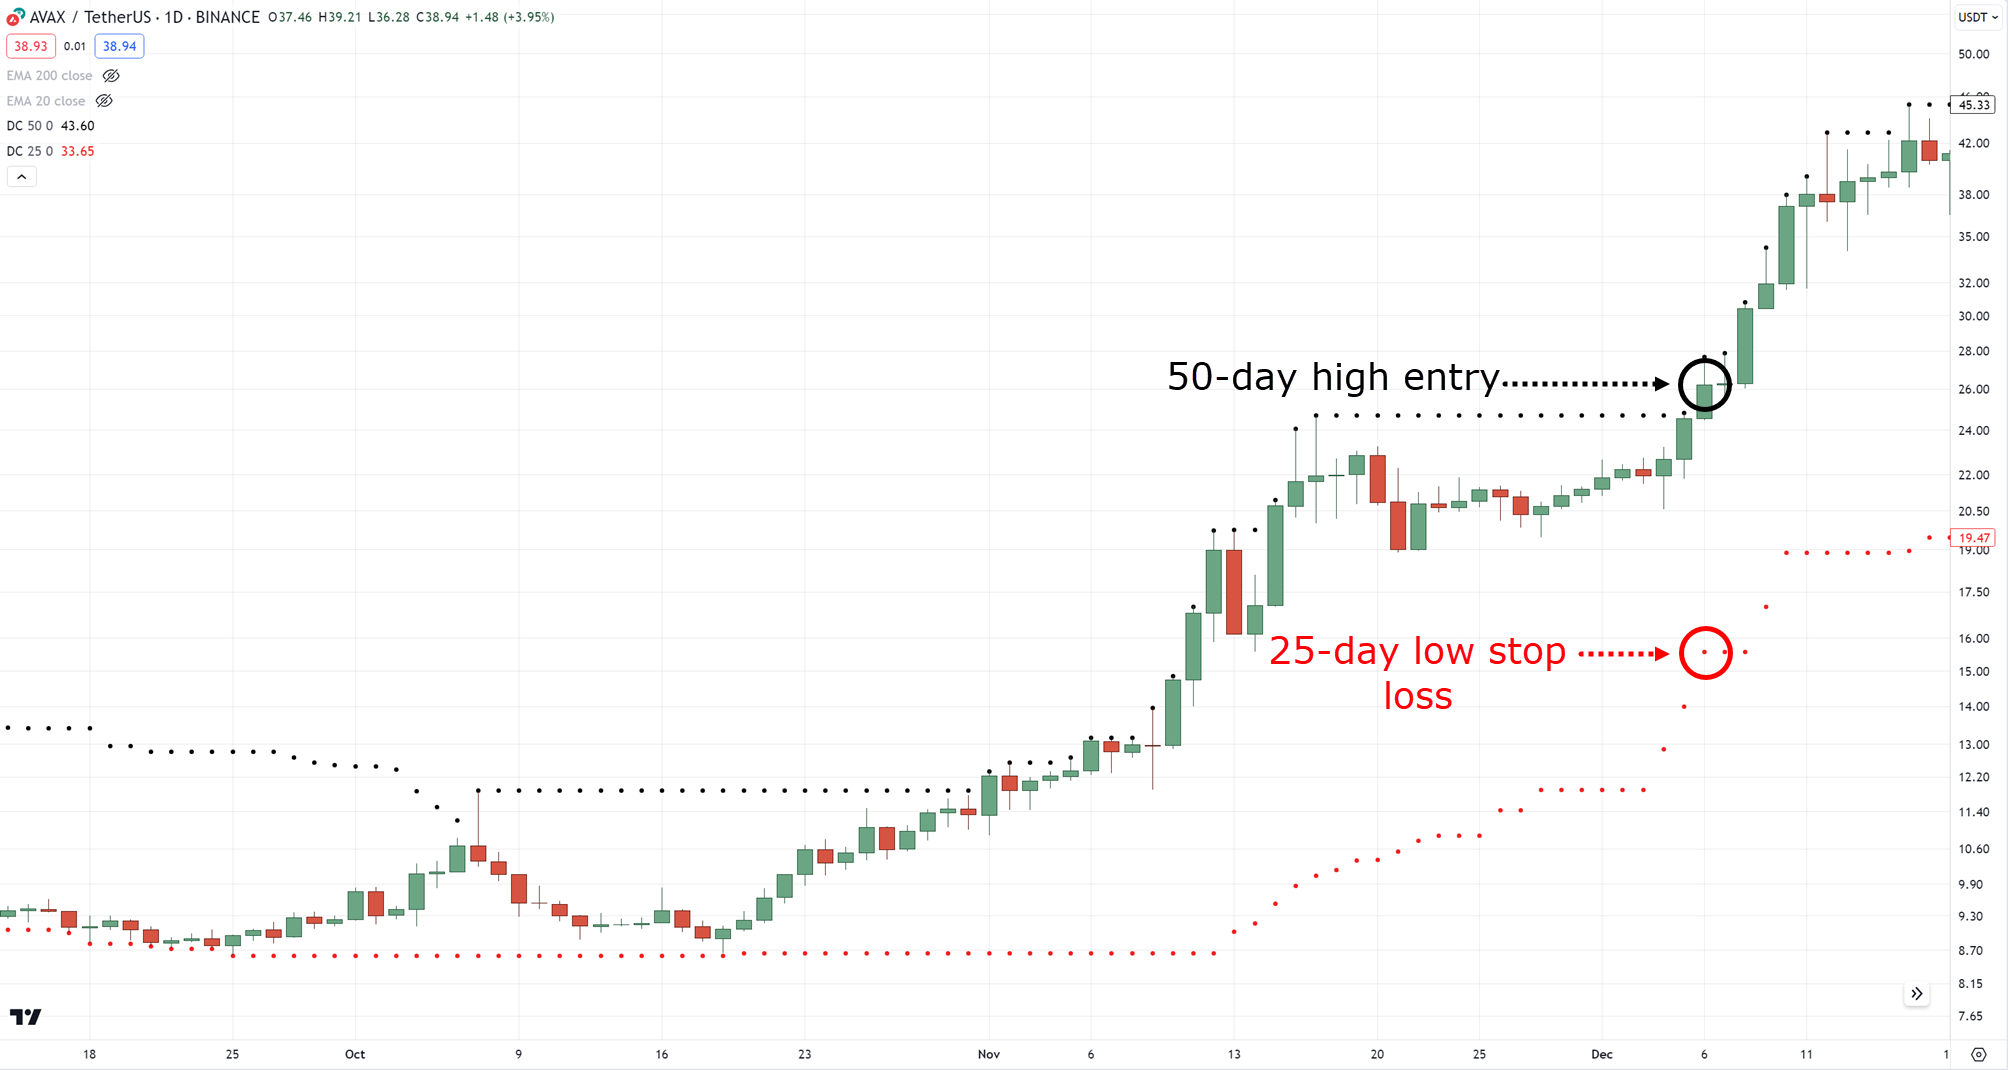
At the same time, place your initial stop loss at the 25-day low, which is half the period of your Donchian channel entry…
So that as the price moves in your favor, the Donchian Channel can also act as a trailing stop loss!…
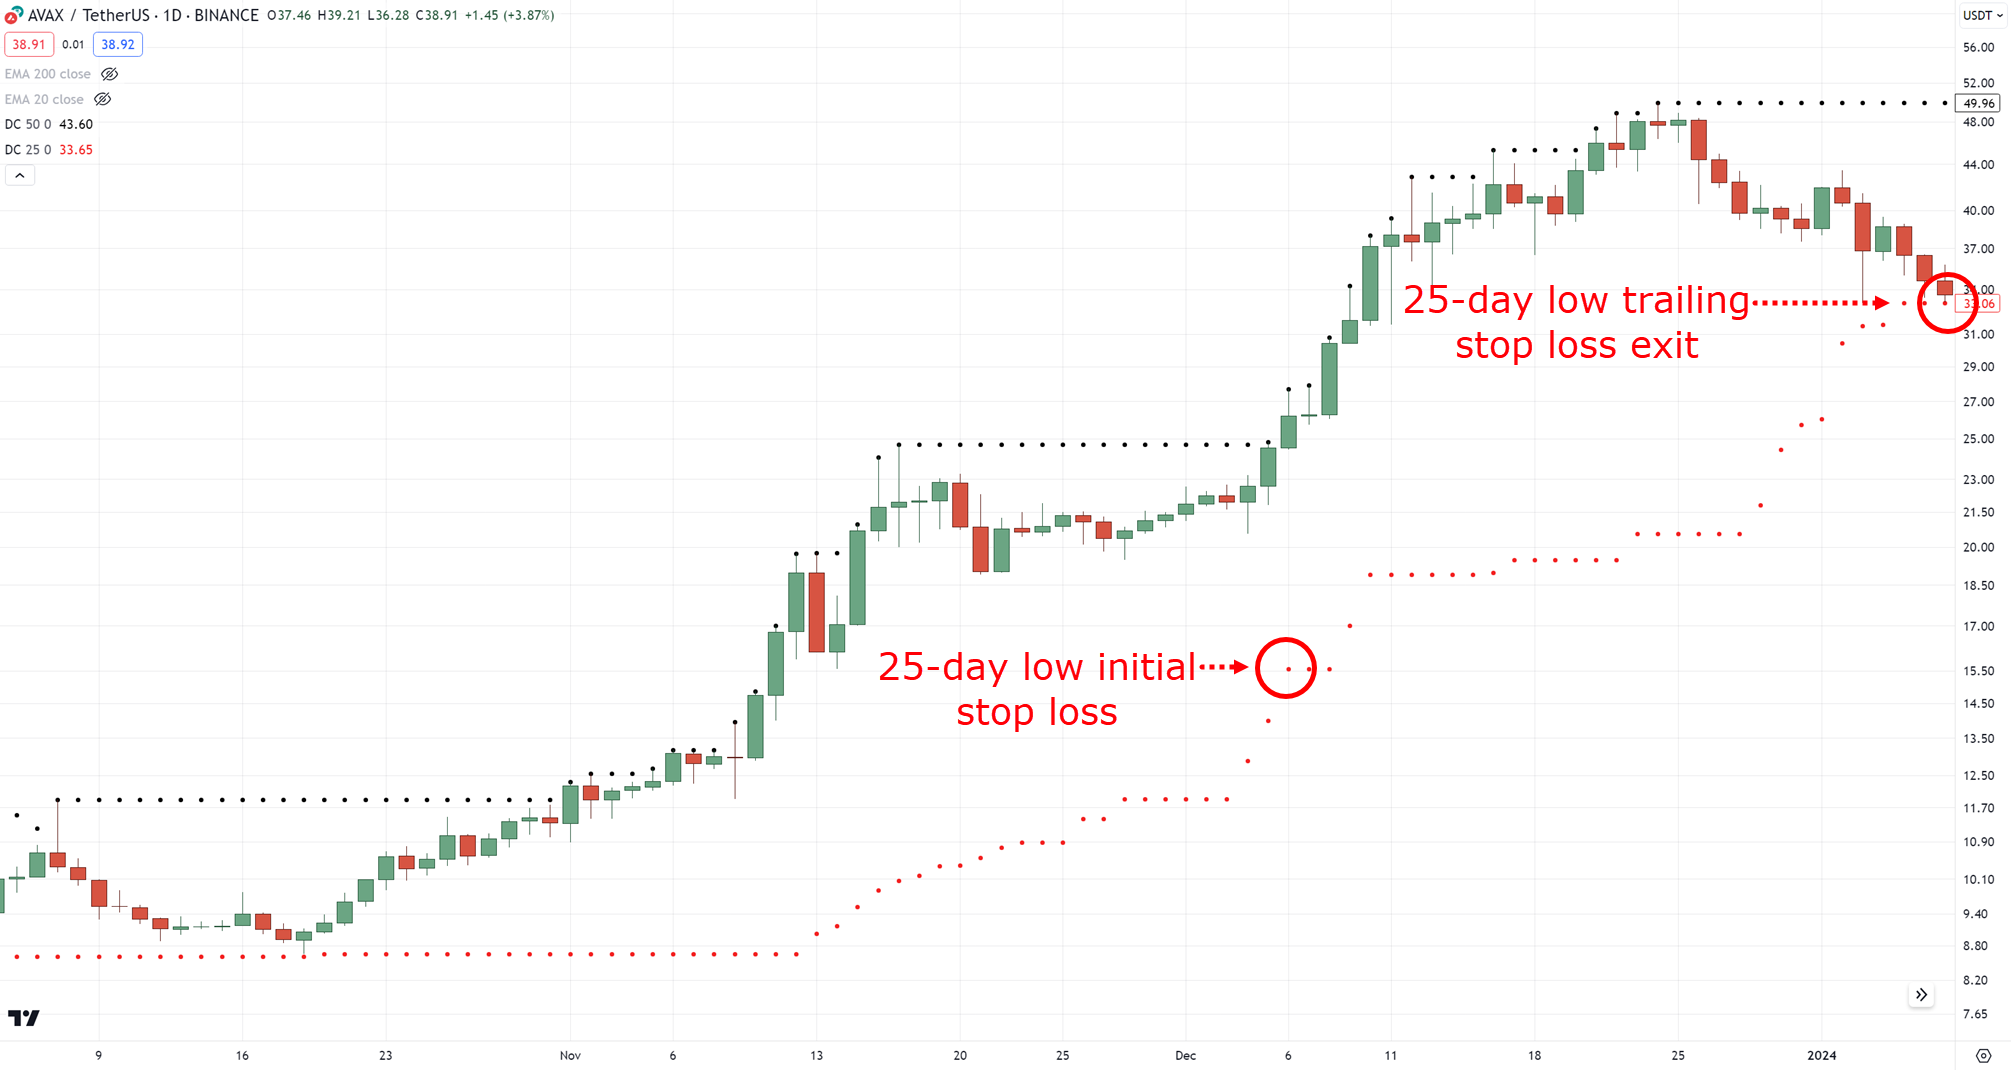
Pretty amazing, right?!
An all-in-one indicator that can enter, manage, and exit your trades!
Now…
This section is meant to “spark” your ideas as a trader.
To get some ideas on how you can instantly improve your current strategy.
However, if you want a deep dive into these indicators, you can check these out:
The Ultimate Guide To Supertrend Indicator
Donchian Channel Strategies That Work
The Complete Guide to ATR Indicator
So, now that you know the best stop loss strategy out there…
How should you NOT place your stop loss?
After all…
Confidence is built by consistently executing trades correctly…
…and having the discipline to know and avoid bad practices in trading, right?
It’s knowing both when to act, and when not to act that matters!
So with that said…
What NOT to do when using the Best Stop Loss Strategy
Some of these problems have already been solved in the earlier sections….
However, it’s always best that you keep them in mind.
So, the first thing NOT to do is to…
Stare at your screen when the price is near your stop loss
I know.
It hurts whenever the price hits your stop loss.
However, staring at your chart only puts you at a mental disadvantage!
It’ll only serve to make you more frustrated…
And what happens when you get frustrated?
That’s right!
You start taking more risks…
You might even start exiting trades too early!
Have you ever been through that before?
So, in this case, what’s the solution?
Simple – have a trading routine!
Understand when to check and when not to check your trades…
Of course, there’s more to it, so feel free to check it out here if you want to learn more.
Next…
Moving your stop loss or removing it altogether
There are a lot of cases where traders suddenly turn into “investors.”…
And just reading that, I’m sure many traders already come to mind!
Whenever they experience a huge loss, they don’t cut their losses!
Instead, they turn into “investors!”
And I’m sure you can’t deny…
This is only adding more fuel to the fire.
Why?
Because you always enter a trade with a specific trading idea, right?
And once the market invalidates that trading idea, you have two choices:
- Accept that you’re wrong, cut your losses, and move on to the next trade
- Keep the trade, and “wait” until you’re right
Of course, I don’t blame you if you go for the 2nd choice.
However, take note that this will set you back as a trader…
It will block you from learning new things as you keep your attachment to your trade.
(I know—I’ve waited 2 years before for a stock just to breakeven!)
But if you go for the first option…
This will allow you to easily learn from your losses and help you improve your decision-making in the next trade!
Again, what’s the solution?
Well, I’m sure there’s more to this than just a quick fix.
But always having a technical reason behind a trade (which I’ve taught you in the previous sections) as well as cultivating the right trading habits, will help you overcome this.
With that said, let’s do a quick recap of what you’ve learned today…
Conclusion
I’m sure you realize by now…
Knowing and executing the best stop loss strategy is different from actually following it with discipline.
By honoring your stop loss, it means accepting a loss or – maybe just accepting you’re wrong!
And oftentimes, new traders (or gamblers) let their egos get the best of them.
Nonetheless, here’s what you’ve learned today…
- Brokers and institutions don’t “hunt” your stop loss, however, avoiding high-impact news and placing the right stop loss depending on the market condition can help you stay on the trade longer
- Always put your stop loss at a technical level, such as placing it below support or above resistance, beyond your trend line, or when your chart pattern gets invalidated
- Indicators such as the super trend indicator, average true range, and the Donchian channel will help you systematically place your stop loss without second-guessing yourself
- Develop a trading routine on when and when not to check your charts so that you can consistently honor your stop loss and use it as a learning experience to enter your next trade
Well – there we are!
I hope that this trading guide has been insightful for you!
It’s time to apply some of these concepts and instantly improve your current trading plan.
So, over to you…
What are some of your stories when it comes to stop loss?
Have you experienced moving your stop loss or removing it altogether?
Let me hear your story below in the comments!


