What is it about some traders that let them spot the best trades in the stock market?
Is it some kind of insider knowledge we’re not allowed to have?
In fact, the truth is a lot simpler!
They’re using tools which help make price action much easier to understand.
And one of the most useful?
The Volume Weighted Moving Average (VWMA).
OK, you’re thinking you already know everything about moving averages, right?
But VWMA isn’t just any old standard moving average.
Volume Weighted Moving Average is way more responsive, reacting to trading volume and giving you deeper insight into where price action is really happening.
It can help you understand market dynamics more clearly, highlighting key turning points and trends.
Once you grasp how it works, Volume Weighted Moving Average can completely transform how you analyze markets.
In this article, I’ll cover everything you need to know about how it can take your trading strategies to the next level.
By the end, you’ll have learned:
- What makes VWMA stand out from other moving averages
- How to apply VWMA across various market conditions and volatilities
- How to use VWMA to identify key price levels and trends, with real chart examples to guide you
- Common mistakes traders make when using VWMA, like misreading deviations during low-volume scenarios
Ready to begin?
Let’s dive in!
Understanding VWMA
How is Volume Weighted Moving Average Calculated?
VWMA is calculated by weighting each price point with its trading volume across a period of time.
You get it by:
…adding the product of price and volume for each interval…
… and then dividing by the total volume over that period.
That’s it!
This gives you a moving average that reflects the average price of the asset over time but also shows you price points where trading activity was most concentrated.
It also means that higher-volume periods have a greater influence on the Volume Weighted Moving Average than lower-volume periods.
Alright, I know the obvious question is, why not just use a simple moving average?
While both tools are valuable, VWMA gives you a unique advantage because it includes volume in the calculation.
It’s this extra information which can offer you deeper insight into where everyone’s getting involved!
Let’s explore a little more about why Volume Weighted Moving Average is worth it.
How Does VWMA Differ from Normal Moving Averages?
While both the Volume Weighted Moving Average and traditional moving averages are used to analyze price trends, the way they work and the insights they give you differ a lot.
As mentioned, the main difference comes from VWMA including volume.
It gives more weight to price points with higher trading activity.
Traditional moving averages, such as the Simple Moving Average (SMA), calculate the average price over a set period without touching volume.
Can you see how more volume moves could give extra insight compared to a simple moving average?
Take a look at what VWMA is trying to show you…
What Does VWMA Represent?
Unlike a Simple Moving Average (SMA), which treats all price points equally, the VWMA ensures that price movements with heavier volumes show up more clearly on your radar.
In other words, Volume Weighted Moving Average lets you in on the price moves that truly matter.
A helpful way to think of it is as a measure of fair value for the time period you’re looking at.
The VWMA reveals where most of the trading took place, highlighting key price zones and providing a more precise understanding of market behavior.
Crucially, this means the VWMA can often reveal market sentiment, too.
Prices above the Volume Weighted Moving Average may reflect bullish momentum, suggesting a security is trading at a premium, while prices below the VWMA may indicate bearish sentiment and a potential discount.
This volume-adjusted viewpoint is valuable in trend analysis, too, helping you work out pivotal levels for decision-making.
I’ll show you how these work practically a bit later in this article.
For now, let’s look at how timeframes shape the Volume Weighted Moving Average.
Ability to Be Relevant on Different Timeframes
While Volume Weighted Moving Average is traditionally used for flexible trend analysis, it can be adapted for various timeframes.
For shorter timeframes, the VWMA captures the relationship between price and volume over minutes or hours, helping traders find more immediate trends and key levels of interest.
For longer timeframes, such as daily, weekly, or monthly periods, the VWMA can reveal broader trends by balancing the volume-weighted activity over extended periods.
What do I mean by that?
Well, the further you zoom out with VWMA, the more external factors can cause it to reflect significant but isolated movements.
And since they’re isolated, they might not always provide the most useful insight.
Let me give you an example.
Say a company announces a groundbreaking new product at the start of the year.
This announcement could lead to a sharp increase in both trading volume and stock price over the following week, right?
So, if you calculate the VWMA over a monthly or yearly timeframe that includes this event, it’s going to be heavily influenced by the high volume and elevated prices during that news period…
And I mean, while this reflects substantial activity, it might not exactly be fair value for the entire timeframe (e.g. a year)
It’s something to keep in mind when using Volume Weighted Moving Average for longer-term analysis…
Example of announcements on Volume Weighted Moving Average:
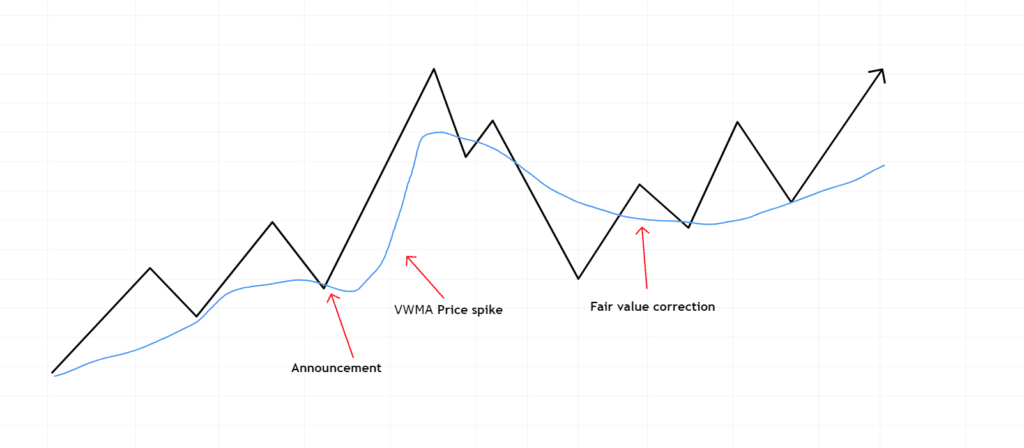
In this scenario, Volume Weighted Moving Average represents the average price during a period of volatility, but not necessarily during normal trading activity.
And now the major question…
With all the above considered, can you use VWMA in forex?
Relevance to Stock Trading vs. Forex
In stock trading, the Volume Weighted Moving Average is highly effective because it leverages precise volume data provided by centralized exchanges.
This reliability enables accurate VWMA calculations, offering you a clear picture of fair value and significant trading activity within the stock market.
I mean, the VWMA reflects real market dynamics – reality, right?
However, forex trading?
Well, it presents a different challenge!
Because the forex market is decentralized, it means there is no single exchange providing comprehensive volume data.
Instead, brokers often supply tick volume, which measures the number of price changes rather than the actual traded volume.
As a result, Volume Weighted Moving Average calculations in forex are a lot less reliable and may not accurately reflect what’s actually going on.
So, it’s fair to say under those conditions, the VWMA can lose its effectiveness and risks becoming more of a source of noise than a useful tool!
For this reason, forex traders may need to rely on other indicators or interpret VWMA data with an extra pinch of salt.
At any rate, let’s explore some real examples of how it can be used in practice!
VWMA Strategies
OK – the fun part!
Let’s look at how to actually use Volume Weighted Moving Average in your trading.
Begin by looking at trend-following systems…
Trend Following
VWMA can serve as a helpful guide for trend-following strategies, helping you confirm the strength and direction of a trend.
In an uptrend, prices consistently trading above the VWMA suggest bullish sentiment, indicating that buyers are dominating the market.
Makes sense, right?
Prices below the VWMA in a downtrend signal bearish conditions, reflecting strong selling pressure.
Put them together, and VWMA becomes a dynamic tool for identifying pullback opportunities.
In an uptrend, for instance, a temporary retracement to the VWMA can act as a potential entry point for a long trade, meaning you can align your positions with the broader trend.
However, it’s important to remember that VWMA is most effective when used in conjunction with other indicators.
Tools like momentum oscillators, trendlines, horizontal levels, or candlestick patterns can give extra confirmation of the trend and help you refine your entry points.
Let’s break this down with an example…
NVIDIA Daily Chart:
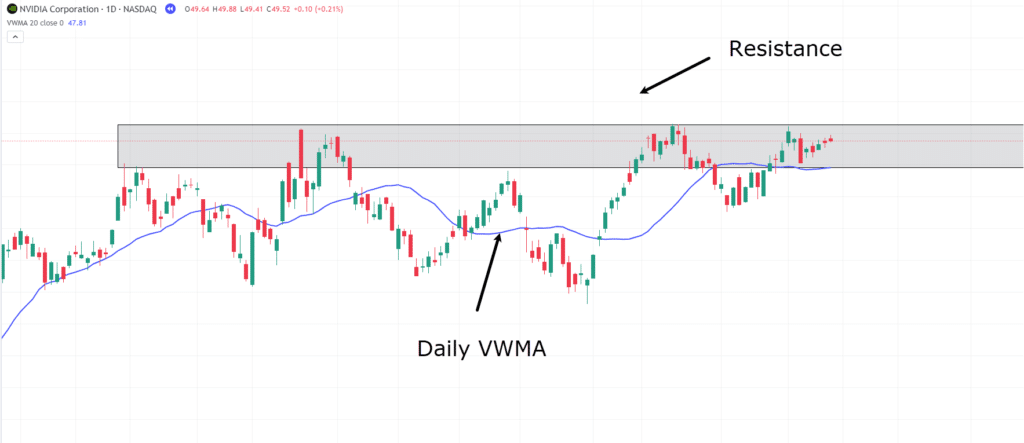
On this daily chart of NVIDIA, the price approaches a resistance zone where you anticipate the next breakout trend.
While the price often moves above the VWMA, entering too early without confirmation can get you caught up in market fluctuations as the price oscillates around the VWMA.
To avoid this, ensure Volume Weighted Moving Average is paired with other forms of technical analysis, such as a clear breakout pattern or a momentum indicator that confirms the breakout’s strength.
By using VWMA together like this, you can enhance your decision-making and reduce the risk of false signals.
NVIDIA Daily Breakout:
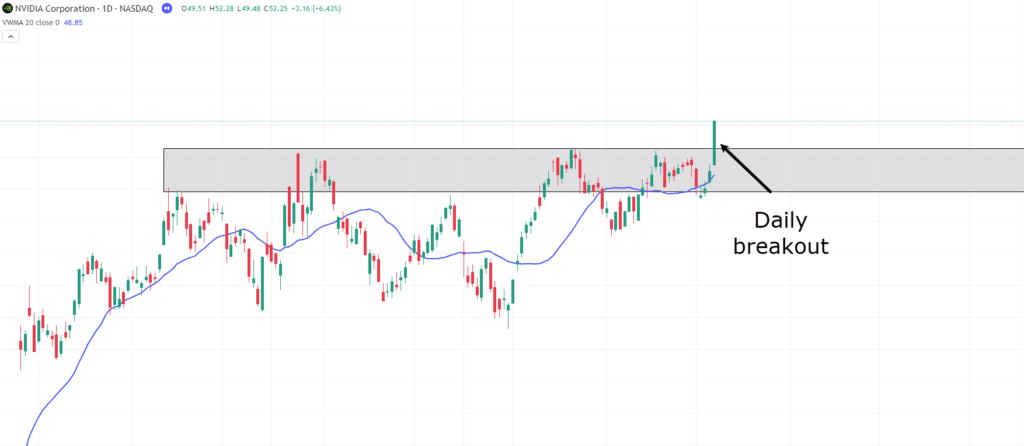
Let’s look at this chart and think about whether or not to take action.
Price has come up to a resistance zone for the 5th time…
…but every time it’s rejected the zone, it’s fallen slightly lower – but hasn’t gone into a reversal and started down trending.
This tells you that Price wants to stay here for some reason!
Now, on this 5th attempt to break the resistance, the price has broken through and closed above the resistance level with a strong bullish engulfing candle…
Price is acting above the daily VWMA!
So, it seems that a lot aligns with bullish sentiment.
Let’s take a long position…
NVIDIA Trend Following:
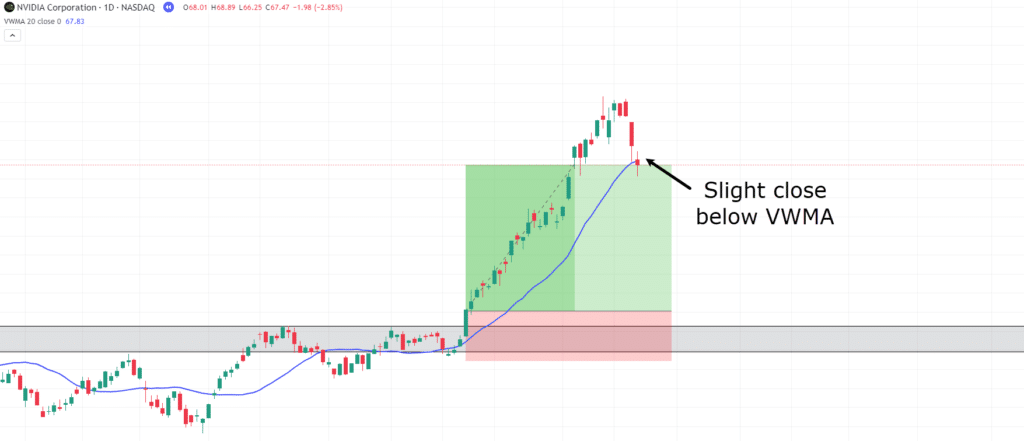
OK, now that the price has taken off from the breakout, something else has occurred:
Price has just slightly closed below the Volume Weighted Moving Average on the daily.
This presents a trading decision.
You can either:
– close early here expecting that the price might continue down or
– you can wait for the next candle to confirm the VWMA trend has truly finished.
My opinion?
Well, due to the hammer nature of this candle, and the indecision behind it, I’d prefer to hold this trade for another day and see what happens.
Let’s take a look…
NVIDIA Earnings Report:
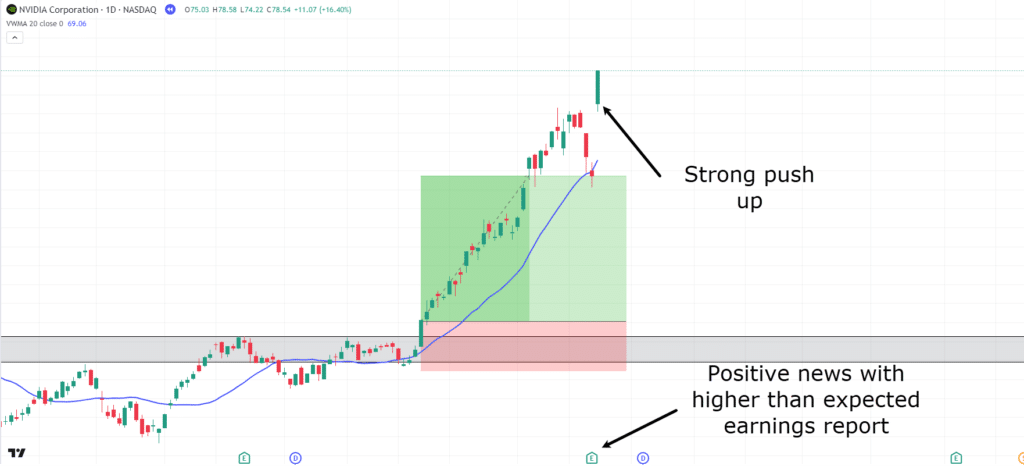
I mean, it’s no coincidence that the market got a little anxious close to the earnings report, bringing the price down toward the VWMA in anticipation of potentially poor earnings.
However, by waiting to see the actual earnings, you would have been rewarded!
Let’s see when this trend setup gives another exit trigger…
NVIDIA Double Top:
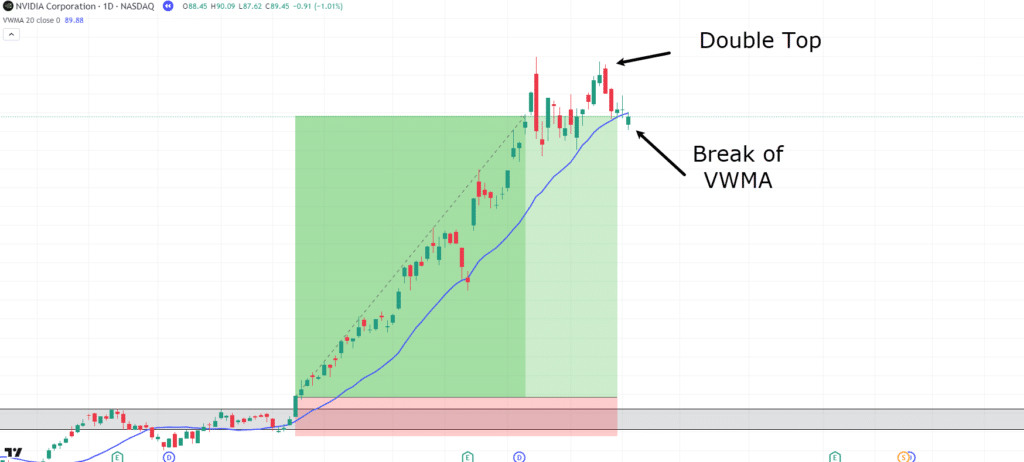
There are two things that stand out from this chart.
A double top has formed where its clear price is now starting to form a new resistance level and there is a new break of the daily Volume Weighted Moving Average.
Although the break isn’t significant, there are starting to be signs that the bulls are running out of steam…
This means this could either be an exit opportunity…
Or, it might be a time to wait for a clearer direction…
For argument’s sake, let’s wait to see some more confirmation…
NVIDIA Trade Exit:
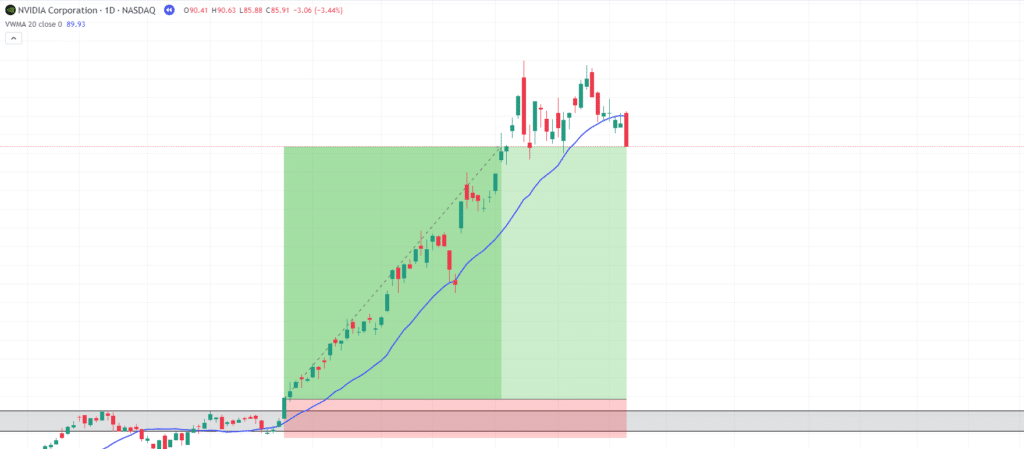
Our intuition was correct!
It’s time to exit this trade with the bearish engulfing candle.
OK so, can you see how at no point the trading decisions were black and white?
You used different analysis tools and your experience to tell you the right and wrong time to exit the trade.
Remember, just because there is a minor break of the VWMA – it doesn’t mean you HAVE to exit the trade.
Make sure to use the overall context of the market to make the best decision you can at the time.
There is absolutely nothing wrong with waiting for what tomorrow might bring!
Next, let’s look at a reversion to the mean strategy for you.
Reversion to the Mean
The Volume Weighted Moving Average can be an excellent tool for mean-reversion strategies, allowing you to find and earn on price deviations from the “fair value” line.
Importantly, when the price moves significantly above or below the VWMA, it often signals overbought or oversold conditions.
This means potential trading chances!
Price tends to gravitate back toward the Volume Weighted Moving Average, because it reflects the asset’s weighted average price based on volume.
For instance, imagine a scenario where a stock’s price surges well above its VWMA during a low-volume rally.
This divergence could signal that the rally lacks strength and participation, bringing a chance to short the stock, expecting the price to revert back to the VWMA.
But always remember – context is critical!
In trending markets, where momentum drives prices further away from the average, reversion to the mean strategies often fails.
Attempting to counter a strong uptrend or downtrend by betting on mean reversion could result in significant losses.
This is why reversion to the mean strategies works best in range-bound or consolidating markets, where price action is more contained.
Let’s dive into a real-life example to see it…
Tesla Daily Chart:
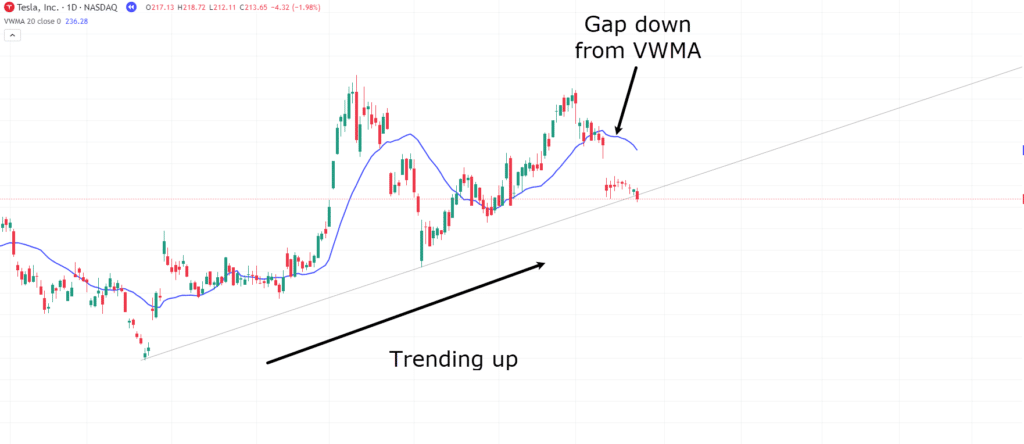
Here, you can see a unique scenario on the Tesla daily chart.
Price has gapped down from the Volume Weighted Moving Average towards the trendline.
In this case, Tesla is in a shorter-term uptrend while in a longer-term range, which means…
…an opportunity to capture a move using reversion to the mean!
For whatever reason, price has gapped down, but, as seen previously, price tends to hover around the VWMA…
Let’s take a look at how you could potentially set up this trade…
Tesla Trade Setup:
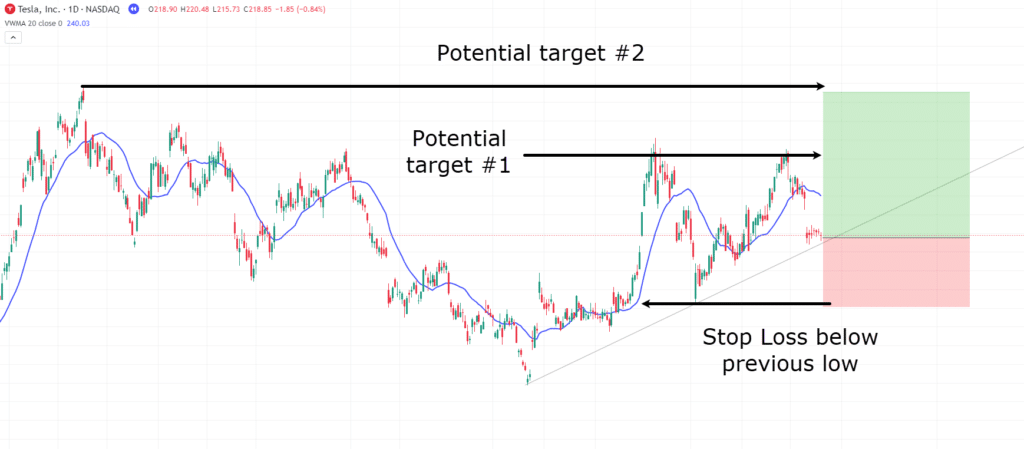
Your entry could be positioned at the trendline with a stop loss below the previous low.
It makes a great invalidation point as the trade doesn’t work if the price forms a new low (the price is no longer trending up)
As for taking profits, there are a few options, with the first reasonable target being the highest high.
The most recent highs also provide a valuable profit level, depending on how the price responds to the trendline and resistance levels…
Take Profit Options:
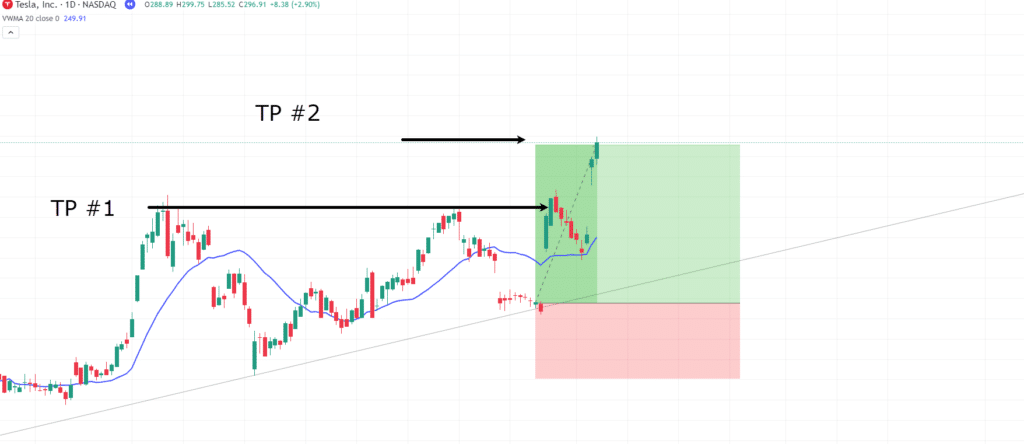
As you can see price was well and truly responded to the trendline and bumped up to the take profit 1.
Price then retraced back to the VWMA.
If you chose to take profits at TP1, the trade would be over, and you’d have taken profits before the retracement.
However, if you were targeting the TP2…
…the Volume Weighted Moving Average holding price as support was crucial!
Alright, I want to give you one final use for the VWMA that applies to this exact trade.
It involves VWMA as a support and resistance, meaning you get dynamic take profits!
VWMA as Dynamic Support and Resistance
Volume Weighted Moving Average can act as a dynamic level of support or resistance, giving you price levels to work with.
In an uptrend, VWMA often serves as a support level, where buyers step in to defend the trend.
In a downtrend, VWMA can act as resistance, where sellers are likely to maintain control.
Understanding this gives you a chance to set stop-losses or take-profit levels.
For instance, if a stock is trading above VWMA and approaches it during a pullback, a bounce of VWMA could signal a continuation of the trend…
…this means you’d get a chance to either add to your position or hold it!
However, if the price breaks below VWMA with strong volume, it may indicate a reversal, prompting you to exit or switch your bias.
Let’s take a look at the example…
Dynamic Take Profit:
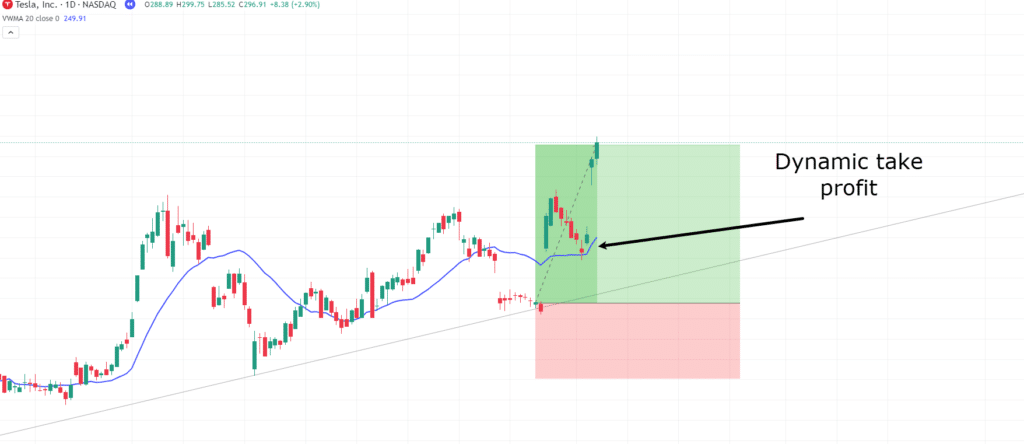
Using the same example as the last trade, instead of using a static take-profit, what if you viewed the VWMA more as a dynamic support level?
The rule would be, if the price fell below the VWMA – you take your profit. Got it?
Now, despite its volatile movement, you need to work out if it’s begun a new uptrend.
It’s at times like these you can use the VWMA as a trailing stop loss / take profit.
Let’s see what would occur if you used the Volume Weighted Moving Average as a trailing take profit….
Trailing Take Profit:
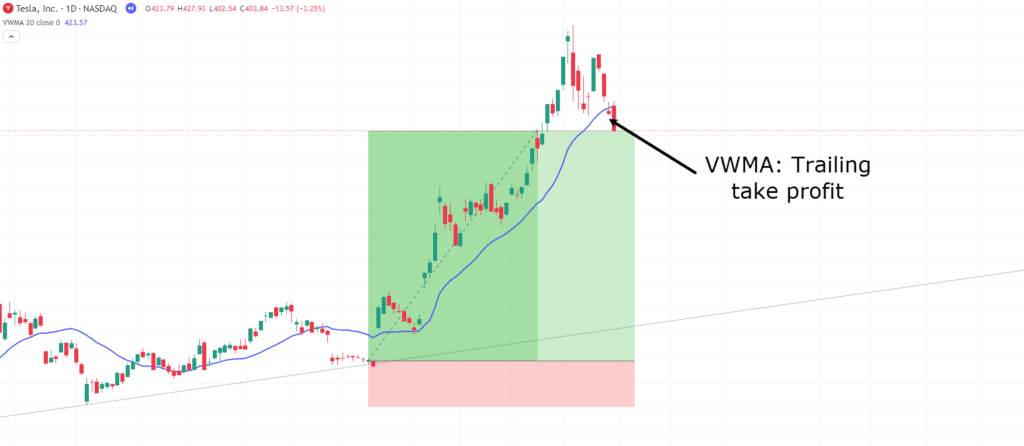
Wow – Quite the Move!
Can you see how useful the Volume Weighted Moving Average can be as a dynamic level?
Structure your trades off it? Check.
Help you work out the right time to exit or hold your position? Check again!
Bear in mind, though, that sometimes, waiting for VWMA to be broken – pending volatility – you might end up delaying an exit that actually ends up less profitable, compared with a static take profit over a longer period of time.
So, again – always look at as much of the picture as possible.
Speaking of which, let’s show an example of when VWMA might actually hinder your profit-taking…
Microsoft Daily Chart:
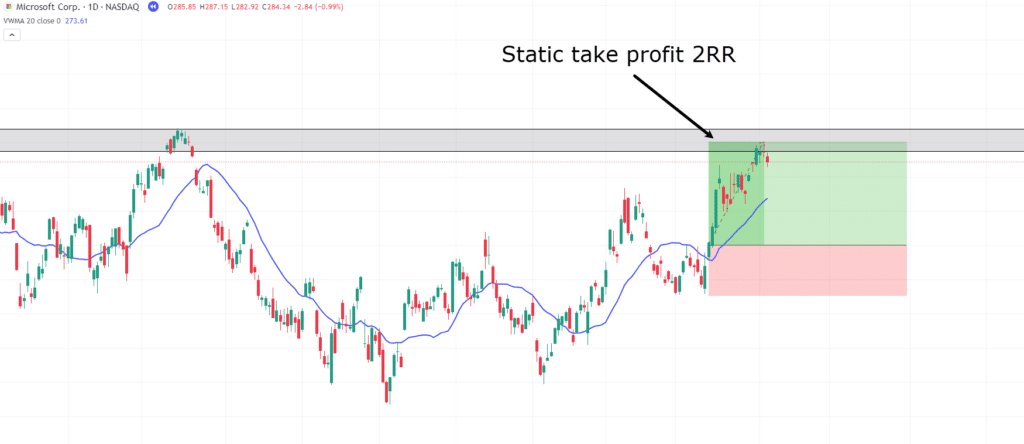
Say you are in this trade, and the price has come back to a reasonable resistance level.
You have the option to take profits and claim a 2RR trade in a short period of time.
However, if you were to use the Volume Weighted Moving Average dynamic trialing stop loss to take profit in this scenario, here’s what might happen…
Microsoft Dynamic Take Profit:
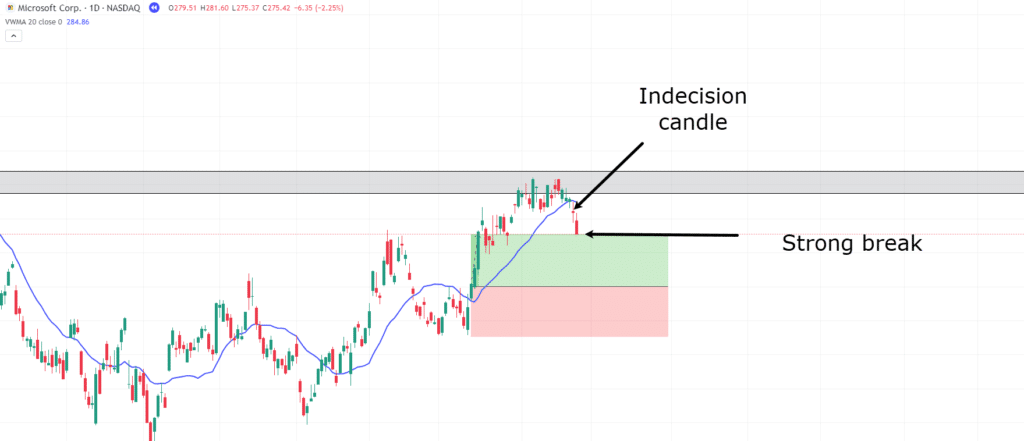
As the price closes below the Volume Weighted Moving Average with an indecision candle, you have the option to hold – in the hope that it’s a brief break and that price remains in an uptrend.
But then the next candle closes strongly below the VWMA, making it look like this resistance is simply too strong for the trend to continue.
In the end, you’ve waited an extra two to four days and halved your profit with a 1RR trade.
Frustrating!
But, this can happen and it’s why VWMA must always be considered in the context of the overall market and your trading goals.
Take a look at what happens next, though…
Microsoft Trend Continuation:
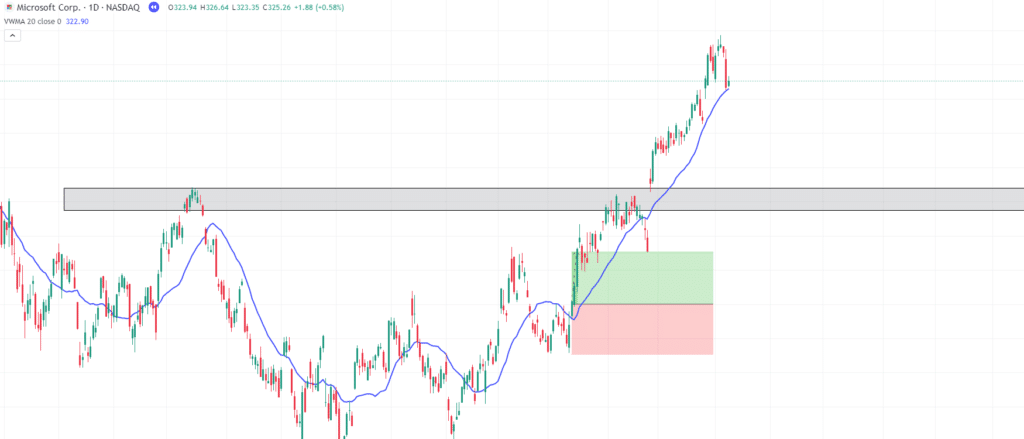
Price actually does continue its the direction of the trend, and the break below the VWMA was only brief.
What’s my point?
Well – hopefully, you can see Volume Weighted Moving Average is not the perfect solution to all your trading problems!
Sometimes, the market will respond differently to different market news, reports, and technical levels.
Taking profits early may seem like a failure but if there are profits to be taken, it’s often best to take them when they are available or if you don’t have a clear read on what the market is trying to do.
I mean, this trade could easily have ended up right back at the entry-level!
Remember – don’t get greedy.
Limitations and Mistakes to Avoid
Limitations and Mistakes to Avoid
As shown in the last example, while the Volume Weighted Moving Average (VWMA) is a versatile and insightful tool, it does have its limitations.
Failing to understand these challenges and avoiding common pitfalls can prevent you from getting useful results out of the VWMA.
Misinterpreting VWMA in Low-Volume Markets
Volume Weighted Moving Average’s reliability can falter in low-volume markets.
When trading activity is minimal, a few large trades or abrupt price movements can really mess up the VWMA’s significance.
In turn, this distortion often results in misleading signals, as the indicator becomes too heavily influenced by volume spikes.
You’ll often find it happening in thinly traded stocks or illiquid assets, for example.
In such cases, the VWMA might appear to signal critical price levels or trend shifts when, in reality, there isn’t that much market interest or activity to back it up.
To avoid falling into this trap, you need to enter low-volume situations with skepticism.
I like to ask myself whether the volume behind the move justifies the action, or whether it’s an outlier that’s throwing off the data.
As mentioned, let VWMA add to what you’re doing rather than try to live off it.
Always start with a clear plan of what you’re looking for in the market…
…then use Volume Weighted Moving Average to help confirm your hypothesis.
This shift in mindset can help you avoid chasing false signals and improve your overall trading consistency.
Now, let’s expand on this idea further!
Over-Reliance on VWMA
Although Volume Weighted Moving Average is a highly insightful and dynamic tool, over-relying on it can lead to poor trading decisions.
While it’s more responsive than traditional moving averages, it should never be used alone.
Instead, use it as part of a complete trading strategy, including trendlines, support and resistance levels, candlestick patterns, and other volume-based indicators.
A common mistake is thinking that every price interaction with VWMA will result in a reversal or bounce.
But this completely ignores how complex the market truly is!
Thinking back to the previous VWMA example – price cut below, then straight back above the VWMA, right?
Well, due to stock news, prices may keep cutting through VWMA like that – without respecting it as a support or resistance level…
It’s all about market context.
If you rely solely on Volume Weighted Moving Average signals without considering other factors, you risk entering trades based on false signals or getting whipsawed out by noise.
To mitigate this, use VWMA as one piece of the puzzle.
Lagging Nature of VWMA
Like all moving averages, Volume Weighted Moving Average is a lagging indicator, as it relies on historical data to calculate its values.
This lag can make it less effective in fast-moving markets or during sharp price reversals, where real-time sentiment and momentum can shift rapidly.
In volatile conditions, relying solely on VWMA to predict future price movements can lead to missteps, so use it as a benchmark rather than a predictive tool in these cases.
For example, in trending markets, VWMA can confirm the direction of the trend or highlight key pullback zones.
However, in highly volatile or choppy conditions, its lagging nature may render it less reliable for timing precise entries or exits.
Think of a company announcing really bad sales for its quarterly report.
VWMA can’t factor that news in until the price has already reacted to it.
Differentiating Short-Term and Long-Term Uses
One of the most common mistakes traders make is failing to distinguish between Volume Weighted Moving Average’s short-term and long-term applications.
Although VWMA can be calculated over any timeframe, the way it is interpreted depends significantly on the period being analyzed.
For example, using intraday VWMA is particularly useful for identifying trading activity and volume shifts within a single session.
On the other hand, calculating VWMA over multiple days or weeks can give insight into broader market trends and key levels of trading activity over a longer horizon.
But keep them separate.
These longer-term VWMA calculations won’t mean as much when applied to short-term trading strategies and vice versa.
Confusing these applications can lead to inaccurate conclusions about market direction or critical price zones.
So, if your trading style involves quick scalps or intraday trades, using a multi-day VWMA might not align with your goals!
Similarly, if you’re swing trading or investing, relying on a single-session Volume Weighted Moving Average could miss the bigger picture.
As such, it’s crucial to clearly understand what your goals are before applying VWMA.
By selecting VWMA settings that match your approach, you ensure that the indicator gives you the best insights for your decisions.
Just like a compass, VWMA is fantastic for identifying directions, but it can’t show the entire map.
Successful navigation of the markets requires combining it with other indicators, market context, and a well-rounded trading plan.
Conclusion
The Volume Weighted Moving Average (VWMA) is a powerful tool that can seriously enhance your market analysis and trading decisions!
By getting trading volume into the equation, VWMA gives you a more responsive and accurate picture of price movements.
It can help you identify key trends and price levels with greater accuracy, too.
When used along with other technical indicators, VWMA can provide an edge, allowing you to make more informed, higher-probability trades while avoiding common pitfalls.
However, like any other tool, it’s best used with a solid trading strategy and disciplined execution!
In this article, you’ve learned:
- What makes VWMA unique, and how it differs from other moving averages
- How to apply VWMA in various market conditions and with different volatilities
- How to use VWMA to capture trends and execute reversion to the mean trades through real-life examples
- Common mistakes traders make when interpreting VWMA and how you can avoid them
Never forget that VWMA is just one piece of the puzzle, but mastering it can be a game-changer for your trading approach.
Now, if you’re ready to dive deeper into VWMA, I encourage you to experiment with it in your own trading!
Try it in different market conditions and on different timeframes.
And, if you’ve already used Volume Weighted Moving Average, tell me about your experience with it!
Share your thoughts and questions in the comments below!