Today we are fortunate to present a guest post written by Maria Grazia Attinasi, Lucas Boeckelmann, Rinalds Gerinovics, and Baptiste Meunier (all ECB). This column reflects the opinions of the authors and not necessarily those of the European Central Bank.
The US administration has recently moved to fully reinstate a 25% tariff on imports of steel and to increase to 25% the tariff on imports of aluminium, both measures will be effective from 12 March 2025. Tariffs on steel (25%) and aluminium (10%) were first imposed during the first Trump Presidency, but exemptions were granted to several countries. The new provisions aim to terminate all approved exemptions, while extending the scope of the tariffs to derivative products made of steel and aluminium. Using the Baqaee and Farhi (2024) model and a novel methodology to disentangle specific goods in input-output tables (Conteduca et al., 2025), this column assesses the long-term impact of such tariffs on the US economy and its main trading partners.
We find large trade displacement effects at the sectoral level with US imports of tariffed products declining by 33% while Canadian and Mexican exports of the tariffed products would drop by 30% and 28% respectively. Importantly, simulations show that while tariffs succeed in protecting US steel and aluminium production, this comes at the cost of lower production and higher input costs in other US industries, notably those located downstream in the value chain (e.g., automotive sector). We also find that tariff protection comes at the expense of lower consumer welfare in the US, albeit to a limited extent.
In a further escalation of trade protectionism, the US administration announced 25% tariffs on US imports of steel and aluminium on 10 February. In 2018, during Trump’s first presidency, a 25% tariff on U.S. imports of steel and a 10% tariff on aluminium were adopted on national security grounds. Subsequently, several countries (including Canada, Mexico, the European Union, the United Kingdom, Japan, Korea, and Ukraine) negotiated exemptions from those tariffs, which de facto reduced their impact. Since returning to office, President Trump signed new proclamations which foresee the reinstatement of the full 25% tariff rate on steel, and an increase of tariffs on aluminium from 10% to 25%. To this end, all approved exemptions are terminated, meaning that US allied countries which benefitted from such exemptions will likely to be the most affected by new US tariffs. In addition, the scope of the tariff has been expanded to include derivative products made of steel and aluminium (Table 1).[1]
The general equilibrium effects of US tariffs are quantified using the Baqaee and Farhi (2024) model, and a novel methodology to obtain more granular input-output tables (Conteduca et al., 2025). By featuring sectoral interlinkages, the Baqaee-Farhi model accounts for the propagation of tariffs in an inter-connected world economy and for substitution effects via international trade. In a nutshell, US tariffs on imported goods act as an import price shock that incentivises US producers and consumers to substitute away from tariffed goods, thereby generating a negative demand shock in the tariffed country and a concomitant positive demand shock for US producers. This re‐allocates production across countries, affecting trade along the way and leading to further adjustments in global production networks. Multi-country multi-sector models like Baqaee and Farhi (2024) are calibrated on input-output (IO) tables that describe supply and use relationships across countries and sectors. But standard IO tables are provided at a relatively high level of sectoral aggregation: for example, aluminium cooking ware – subject to new tariffs on derivative products – would be included in a broader manufacturing sector, making it challenging to simulate tariffs on this specific good.[2] To overcome this limitation, Conteduca et al. (2025) use product-level bilateral trade data to expand the granularity of standard IO tables. We apply this methodology to build a tailored IO table which separate products of steel and aluminium from non-tariffed goods.
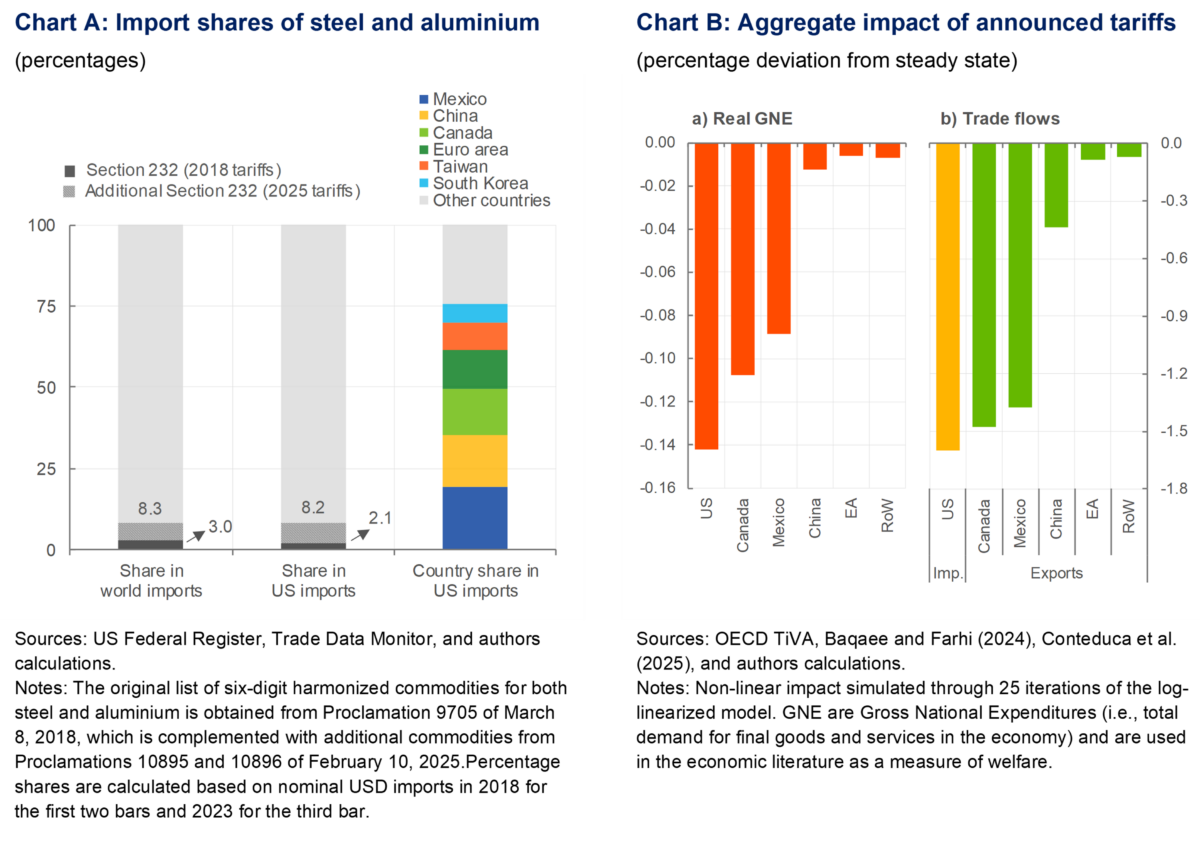
Imports of steel and aluminium account for a significant share of imports both for the world aggregate as well as the US. The recent measures quadrupled the share of US imports subject to tariffs. According to nominal customs trade data (Chart A), the share of tariffed products goes from 2.1% (under the 2018 provisions and before exemptions were granted) to 8.2% (including the list of derivative products subject to tariffs). According to data from the American Iron and Steel Institute, in 2024 about 78% of total US imports of steel consisted of finished steel imports, with the latter accounting for 23% of the total US steel market. Mexico is the primary external supplier of steel and aluminium (19%) followed by China (16%) and Canada (14%). As of 2023, exports by China still account for a substantial share (16%) of US imports, after having declined by about 12 percentage points since 2017 (i.e., before the start of the first trade war). The downstream sectors more reliant on imports of steel and aluminium are electrical equipment, machinery, and the automotive industry which on average source about 4% of their production inputs from these sectoral imports, either directly or indirectly.
General equilibrium effects of higher tariffs on steel and aluminium point to large trade displacement effects and a small reduction in consumer welfare for the US. Model simulations (Chart B) show that the efficiency costs of higher tariffs for the US are relatively small (around 0.1%) when measured in terms of real Gross National Expenditures (a metric of welfare in the economy)– as higher consumer prices lower the level of aggregate demand – and negligible losses in other countries. At the aggregate level, global trade flows are affected by a modest 0.5% but the impact is unevenly distributed across countries depending on their exposure to the U.S. market for steel and aluminium. US total imports would decline by around 1.6% with total exports from Canada, Mexico the most affected, by 1.5% and 1.4%, respectively. At the same time, euro area total exports would decrease by only about 0.1% while those of China would lose 0.4%. At the sectoral level though, trade displacements are more substantial: U.S. imports of the tariffed products declining by 33% while Canadian and Mexican exports of the tariffed products would drop by 30% and 28%, respectively. In contrast, export losses for the euro area and China, in these sectors would be more contained, at around 4% and 6% respectively.
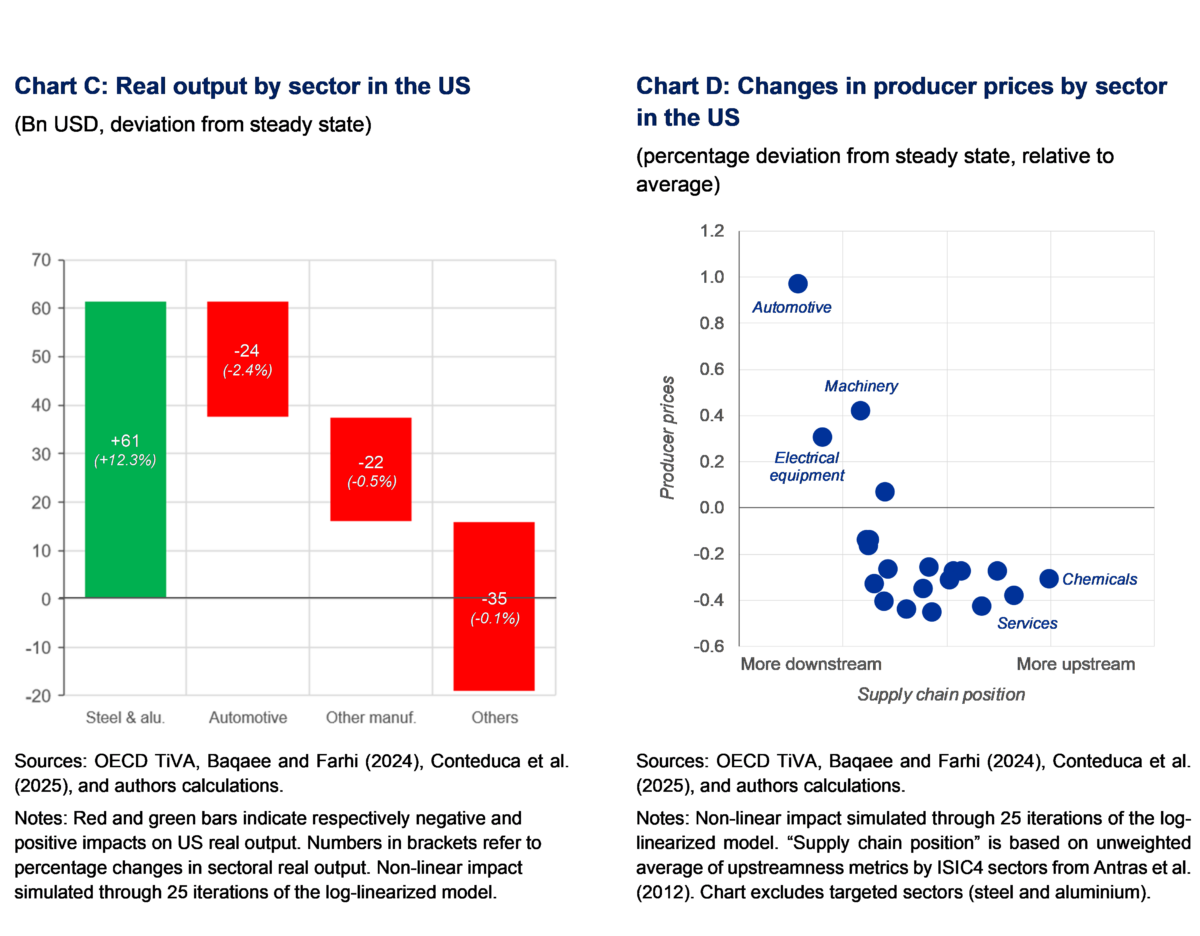
Tariff protection in the steel and aluminium sector would come at the cost of lower production in other sectors, and higher producer prices notably in more downstream sectors. The increase in the price of imported steel and aluminium would redirect demand towards domestic production on account of expenditure switching, increasing the real output of the US steel and aluminium industry by 12% compared with the current situation (chart C).[3] This, however, comes at the cost of reduced production in downstream sectors due to higher inputs costs. Simulations show that sectors that rely more on steel and aluminium would be most affected, notably the automotive sector (-2.4% of real output). Overall, this results in negligible aggregate net losses in US real output (0.05%) which suggests that tariffs translate into significant sectoral reallocation with efficiency losses for the economy. This is corroborated by the simulated changes in relative sectoral producer prices (Chart D), which increase the most for the sectors which are more downstream in the production chain and use steel and aluminium as inputs of production (e.g., automotive industry, electrical equipment, machinery). By contrast, most upstream sectors (e.g., chemicals) or those with a low reliance on steel and aluminium (e.g., services) would face an increase in producer prices below average. These model simulations are also in line with the empirical investigation of Cox (2023) finding persistent negative impacts from steel and aluminium tariffs on downstream industries.
This stylised analysis shows that higher tariffs come at a cost for the economy imposing them. While the analysis in this column does not look at broader macroeconomic effects of tariffs, its sectoral focus allows to evaluate the distributional impact of targeted tariffs. While tariffs may succeed in reshoring production in the targeted sectors, they are no free lunch, as they entail broader costs for other sectors and the consumers. Such costs would be larger if such policies lead to a global spiral of tariffs. To safeguard the unprecedented gains in global growth and welfare achieved over the past decades, it is crucial that legitimate concerns over security and supply chain resilience do not trigger a spiral of protectionism—one that would erode the multilateral, rules-based trading system and ultimately harm all nations.
[1] In model simulations, we take the simplifying assumption that tariffs on derivative products increase from 0% to 25% on all countries. This is however an upper bound given that: 1) initial tariff rates might differ from 0%, and 2) in the case of derivative products (products classified outside of Chapters 73 and 76 of the US Harmonized Tariff Schedule) the 25% duty would apply only to the steel or aluminium content value of the product.
[2] Standard IO tables are generally provided at the 2-digit level, which does not allow for: 1) simulating tariffs targeting only specific goods, 2) accounting for substitution effects between specific goods in the Baqaee-Farhi model, and 3) computing impacts for specific product groups. The Conteduca et al. (2025) approach relies on bilateral nominal trade data at HS6-product-level (BACI; Gaulier and Zignago, 2010) to obtain the share of tariffed goods in an aggregated sector. This share is then applied proportionally to using sectors of the corresponding country. For domestic supply, the share is the trade-weighted average of bilateral shares with trading partners.
[3] Nominal impacts in Bn USD refer to the base year 2018, since effects are computed by using the Baqaee and Farhi (2024) model to simulate the changes (in real terms) implied by targeted tariffs on IO tables for the year 2018.
This post written by Maria Grazia Attinasi, Lucas Boeckelmann, Rinalds Gerinovics, and Baptiste Meunier.