EJ Antoni concludes we’re in a recession, and elsewhere, have been since 2022. On the other hand, he argues (rightly) that we shouldn’t take a face value GDPNow’s reading for Q1.
What’s Dr. Antoni’s basis for judging the US economy has been in recession since 2022? In basically irreproducible results (see this paper), he and Peter St Onge claim that US GDP properly deflated has been falling since 2022.
Figure 1: BEA GDP (black), GDP incorporating PCE using Case-Shiller House Price Index – national times mortgage rate factor index, using BEA weight of 30% (green), GDPNow as of 3/18 (light blue square), Antoni-St.Onge estimate for 2024Q2 (red square), all in bn.Ch.2017$ SAAR. NBER defined peak-to-trough recession dates shaded gray. Source: BEA, S&P Dow Jones, Fannie Mae via FRED, NBER, and author’s calculations.
I should note that elsewhere, Dr. Antoni has dated the recession to July or August 2024.
Recently, Dr. Antoni has taken to touting the industrial production surge as evidence of a coming resurgence — so my prediction is that he will soon call an end to the recession of 2022-2024. I’ll just note that industrial production is not one of the key indicators followed by the NBER Business Cycle Dating Committee (employment and personal income ex-transfers). For context, here’s a graph of the latest readings on those, along with industrial production and manufacturing and trade industry sales.
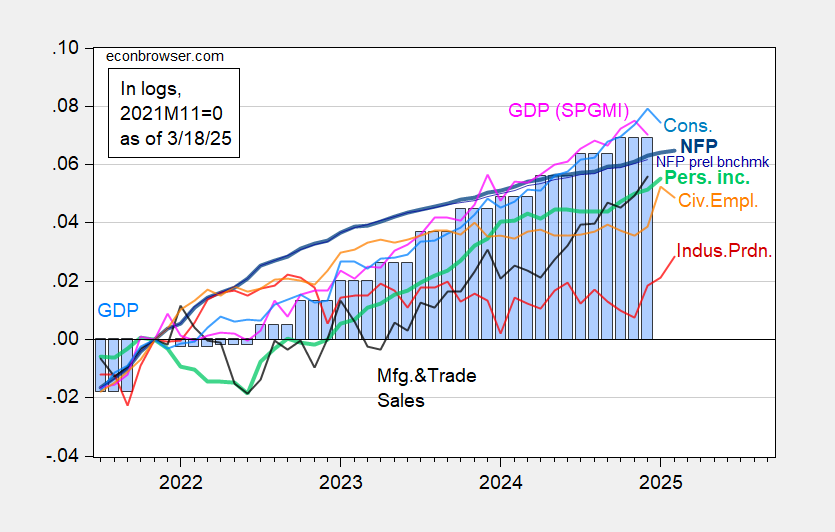
Figure 2: Nonfarm Payroll incl benchmark revision employment from CES (bold blue), implied NFP from preliminary benchmark through December (thin blue), civilian employment as reported (orange), industrial production (red), personal income excluding current transfers in Ch.2017$ (bold light green), manufacturing and trade sales in Ch.2017$ (black), consumption in Ch.2017$ (light blue), and monthly GDP in Ch.2017$ (pink), GDP (blue bars), all log normalized to 2021M11=0. Source: BLS via FRED, Federal Reserve, BEA 2024Q4 advance release, S&P Global Market Insights (nee Macroeconomic Advisers, IHS Markit) (3/3/2025 release), and author’s calculations.
Interestingly, Dr. Antoni has made no mention of sentiment indices, even though in June he remarked on the MIchigan sentiment. For context, here are the latest readings on expectations.
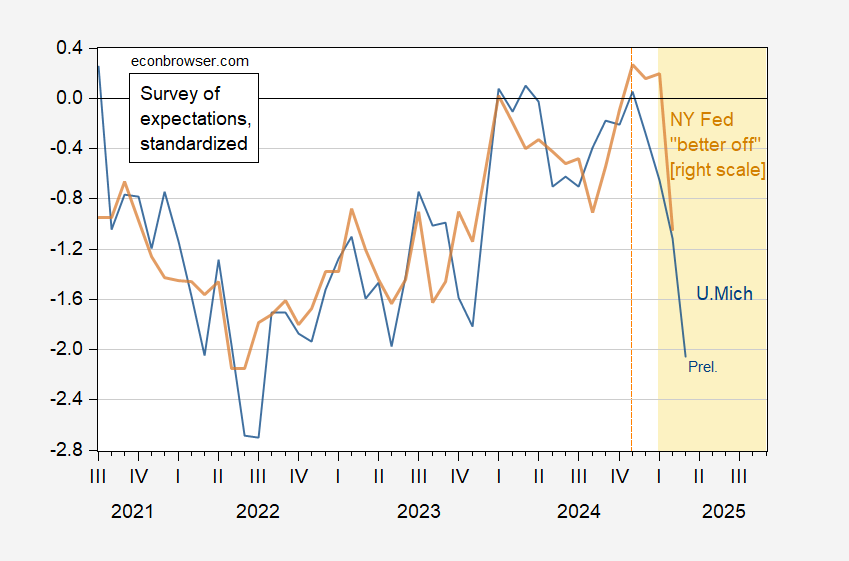
Figure 3: U.Michigan expectations index (blue), and NY “better off” aggregate (tan), both demeaned and standardized (2013M06-2025M02). Source: U.Michigan, NY Fed, and author’s calculations.