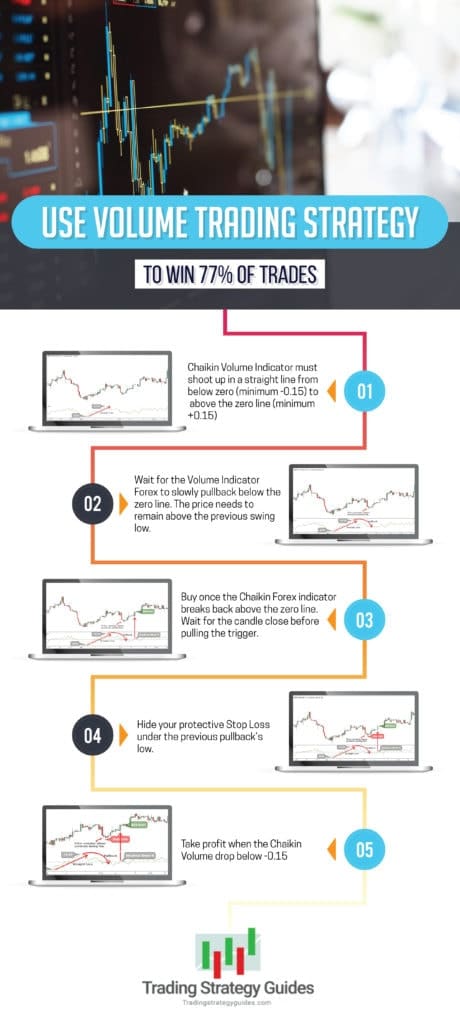
Everything You ever wanted to know about our volume strategy for trading.
Looking for the best volume trading strategy? In this article, we teach everything you need to know about volume plus teach a great strategy as well.
If you want to skip the training about volume and go straight to the strategy click the table of contents.
With more than 30 years of trading experience combined, our team at Trading Strategy Guides has put together this step-by-step trading guide.
You can take advantage of analyzing the strength of a trend based on volume activity.
The Forex market, like any other market, needs volume to move from one price level to another.
The Forex market is the largest and the most liquid market in the world, with 6 trillion dollars worth of transactions performed on a daily basis. If you can master volume analysis, a lot of new trading opportunities can emerge. Using a volume trading strategy Forex traders can improve their win rates and become more consistent traders.
When we have a lot of activity and volume in the market, as a consequence, it produces volatility and big moves in the market. That’s really what most traders need in order to make a profit trading the Forex market or any other market be it stocks, bonds, or even cryptocurrencies.
While you can still make money even in tight range markets, most trading strategies need that extra volume and volatility to work.
What is Trading Volume?
In stocks the volume is the total number of shares that has changed hands.
In forex Volume is the total amount of money that has changed hands in the forex market.
However, In the Forex market, we don’t have a centralized exchange of total volume because we’re trading over the counter. If we look at any trading platform like TradingView, they have a volume attached to their chart. But, since we don’t have a centralized exchange that volume is coming from the feed that TradingView uses.
Each retail Forex broker will have its own aggregate trading volume.
Another thing that most traders don’t realize about forex volume is that, it is tick volume not true volume.
What is Open Interest?
Open Interest is a measure of how many total positions, short or long, are currently held in a market. Are there a lot of positions currently held, or relatively few? – i.e., how much overall current interest is thereby traders in trading this market.
Many people see this as a contrarian indicator because if more traders are buying those could be retail traders but the banks would be selling.
You can find open interest in forex by looking at the community outlook page on myfxbook.
What is Tick Volume?
Tick Volume is the total number of transactions that has taken place not the dollar amount. The difference is important because if there are many trades happening but the dollar amount of those trades is small, then we will not get the follow through in price we were expecting.
Trading Volume In Forex For Beginners
Volume and open interest are momentum indicators – that is, rather than helping you directly determine the direction of a market, they are designed to help you gauge the strength or weakness of a market move.
Therefore, they are secondary indicators of future market direction. I would never recommend using volume and/or open interest numbers as your sole reason for entering a trade.
These are strictly secondary indicators or trade “filters”, and should only and always be utilized as such.
Factors like volume are useful to confirm your market analysis, but should never form the foundational basis for that analysis. I’ve seen markets go through dramatic, extended price changes with barely a blip of change in either volume or open interest.
And I’ve also seen significant changes in volume and open interest that signaled absolutely nothing – in other words, a market that was stuck in a relatively small trading range, basically going nowhere fast.
In short, volume and open interest can be notoriously unreliable market indicators, especially in short-term trading. However, they can still be utilized to confirm an existing hypothesis that one has about the near-term or even long-term direction of a market. Our volume trading strategy will help you to understand how to do that.
One particular situation in which they can be helpful is when a market has been in a trend, up or down, for quite some time. You have doubts as to whether it will continue its current direction, or begin to fail at current price levels and reverse direction.
In such an instance, a significant drop in volume and open interest can serve as an early warning indicator that a market has just about “run its course”.
Likewise, if volume and open interest remain relatively steady, or even increase, while the market pauses and catches its breath, odds are better that the market will resume its existing trend once it gets moving again.
Volume and open interest are nearly always mentioned together for a very good reason. Whenever using them as market indicators, they are more reliable when both indicators are in agreement with each other. The basic combinations of volume and open interest are as follows:
More reliable indications
– Volume AND open interest both increasing favors higher prices or current trend continuation.
– Volume AND open interest both decreasing favors lower prices or upcoming trend reversal.
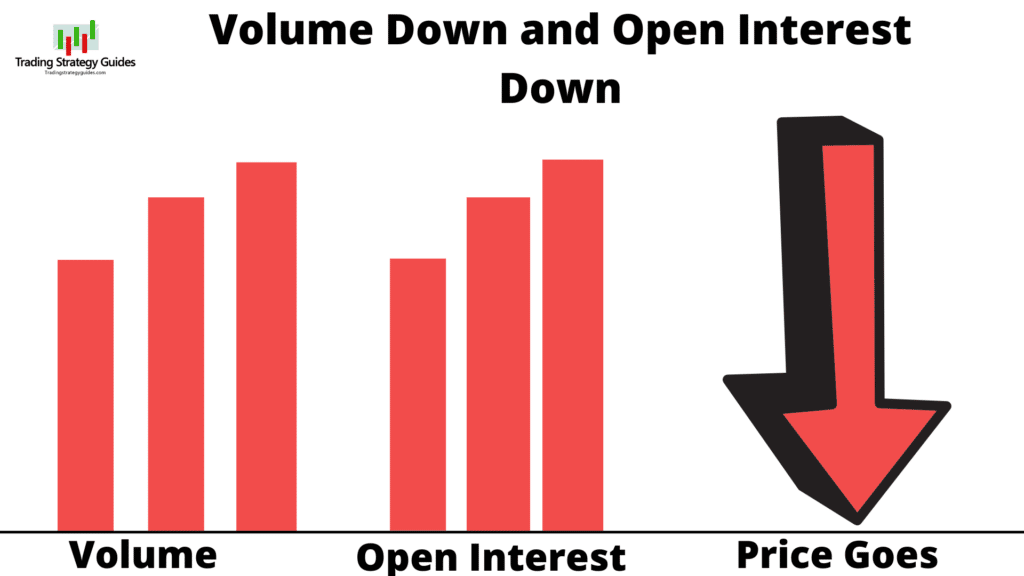
Less reliable indications
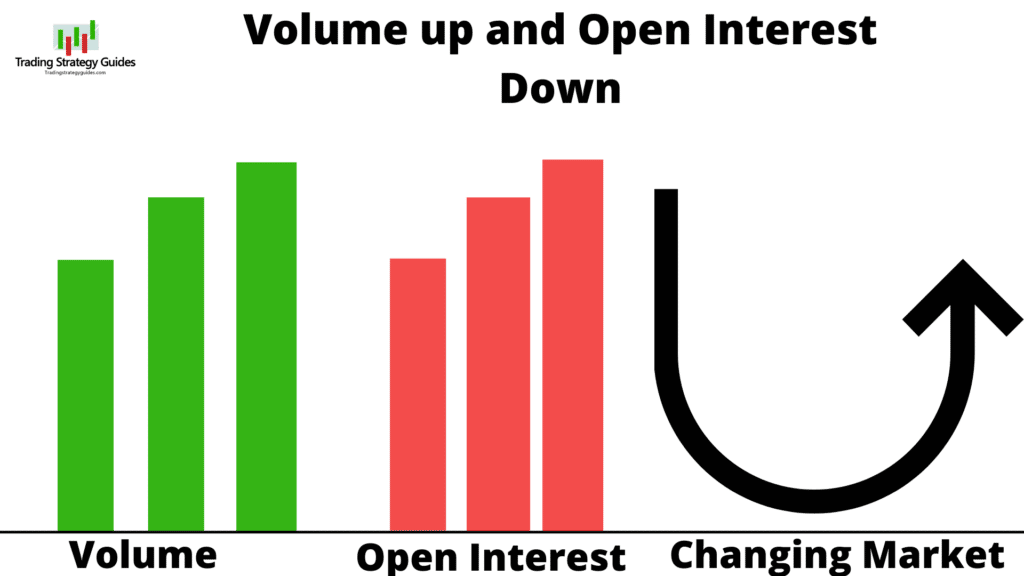
– Volume up, but open interest down, signals a changing market.
– Volume down, but open interest up usually signals a market gathering momentum to move higher. It’s good to keep in mind that if such a push upward fails, then the market is likely to reverse sharply to the downside as all of those newly opened interests get stopped out or dive for cover.
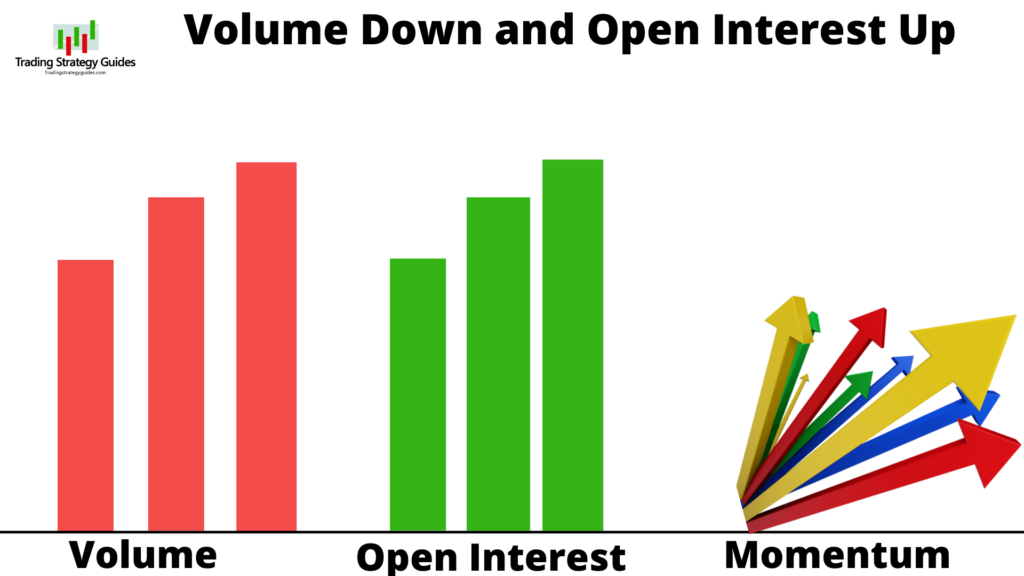
Volume and open interest numbers tend to diverge when a market’s direction is uncertain, or when there simply is no overall or long term direction (that is, when the market is simply a “trading range market“).
By the way, there’s nothing wrong with a trading range market, as long as you can accurately identify the trading range.
Volume as a Reversal Indicator
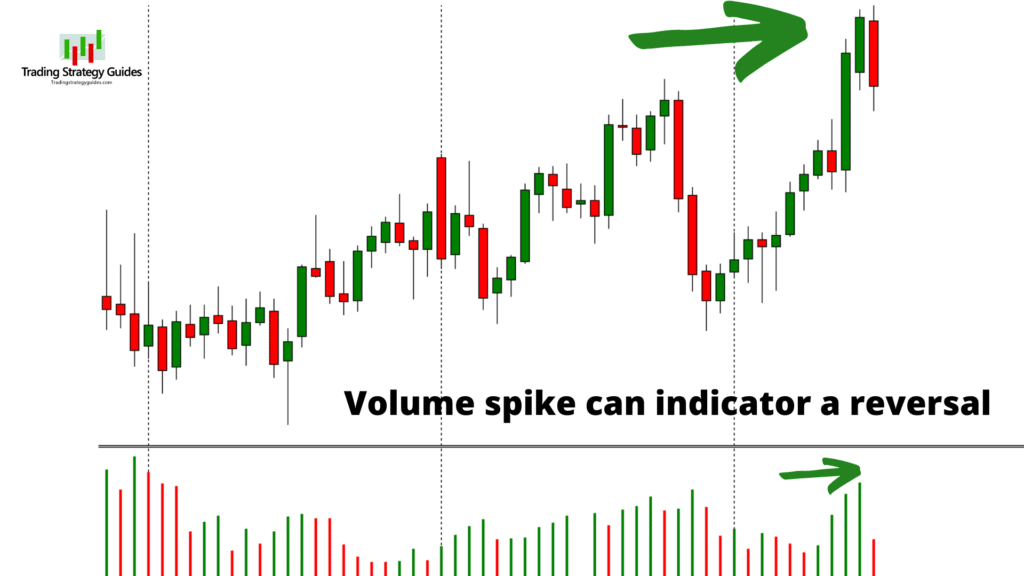
There is often a dramatic increase in volume at market tops or bottoms. It’s basically the market blowing out or exhausting, its remaining interest in price at that level. Therefore, volume can be a useful indicator to help detect market reversals, and significant changes in direction, up or down. Just keep an eye out for that.
VOLUME MEASUREMENT
The Forex market is a decentralized market, which means that there is no formula for volume or method of keeping track of the number of contracts and contract sizes, such as in the stock market. The Forex market measures volume by counting the tick movements. The logic behind this is straightforward:
a) Price moves up and down in ticks.
b) The Forex market cannot measure how many contracts are sold, but it can measure how many ticks price moves up or down in any given time frame.
c) It can still be measured by measuring how many ticks price moves up and down.
d) Therefore, irrespective of how many transactions have been completed to make the price move, the net effect will be measured.
It is the equivalent of focusing on the next result instead of analyzing the process. The volume measurement in the Forex market is looking at how much price moves within a certain period and it does not care how many or few buying and selling transactions are in fact needed to make that price move 1 tick. All it knows is how many ticks it moved, regardless of the fact if 100 trades were involved or 10,000.
The volume in the Forex market is segmented, which is the reason why we need to use our best volume indicator.
How to Use Volume
Price action is always our primary focus and we should never forget that!! Write it down on a piece of paper, if need be, with a thick yellow mark: price is the number 1 measurement! Almost everything is derived from price and calculated based on price, so using price action as the primary source for decisions is only logical.
Using volume to define trading decisions makes sense if it is used as a confirmation. Here are its primary advantages:
1) CONFIRM TREND STRENGTH: Volume can confirm the trend direction as traders want to see increased volume in the direction of the trend and decreased levels of volume when the currency pair is correcting in the opposite direction of the trend.
- For an uptrend, this means increased volume when the price is moving up and decreased volume when the price is moving down.
- For a downtrend, this means increased volume when the price is moving down and decreased volume when the price is moving up.
2) IDENTIFY TREND WEAKNESS:
If price is reaching new levels of extremes (higher highs or lower lows), but volume is not confirming and supporting those new price levels, then this could provide first warning signals that the trend is weakening (retracement can be expected) or ending (reversal potential, or sideways / range movement). Read more information on how to interpret divergence.
3) BREAKOUT CONFIRMATION:
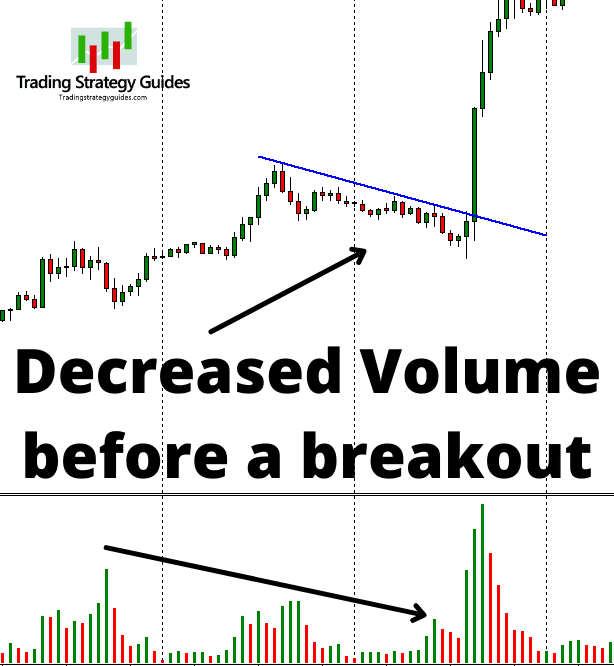
During a consolidation, volume measurements typically are low. If volume picks up upon the break of that consolidation pattern (wedge, triangle, flag, etc), then the volume is confirming a higher chance of a sustainable breakout. Read more on trading breakouts here.
ACCUMULATION/DISTRIBUTION
Accumulation is a phase when buyers are controlling the market. If the volume is increased when the market is correcting in a downtrend, then this typically means that more buyers are stepping into the market and a reversal could occur. Usually, these are confirmed when:
a) Volume increases compared to the day before but closing prices are higher
b) Price hardly moves down, even though volume has increased
Distribution is a phase when sellers are controlling the market. If the volume is increased when the market is correcting in an uptrend, then this typically means that more sellers are stepping into the market and a reversal could occur. Usually, these are confirmed when:
a) Volume increases compared to the day before but closing prices are lower
b) Price hardly moves up, even though volume has increased
There is an indicator that measures this accumulation/distribution balance and is called Accumulation/Distribution (AD). It is calculated as follows:
AD = ((Close – Open) / (High – Low)) * Volume
If the indicator is falling then it indicates the distribution (selling) of the currency. If the indicator is rising then it indicates accumulation (buying) of the currency.
METHODS TO CALCULATE VOLUME
Below is a list of indicators a Forex trader can choose from.
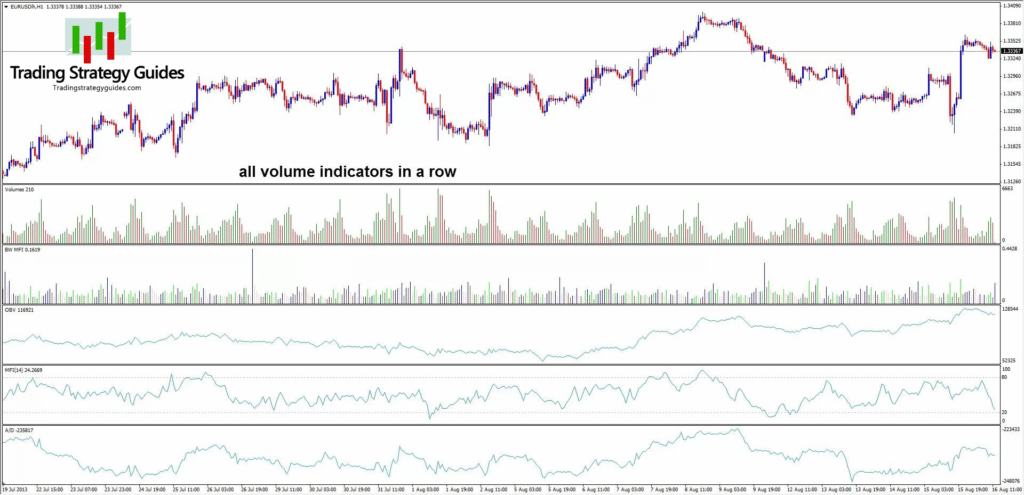
VOLUME:
The most logical place to start is the volume indicator. This tool calculates the number of ticks in which a currency moves up and down. It is often used in other calculations as well. For instance, the AD methodology mentioned in the paragraph above includes volume as part of its basic parameters. Volume indicator trading can really help a trader to reduce the noise in the markets and get better trade signals with their strategy.
ON BALANCE VOLUME (OBV):
The tool was developed by Joe Granville and is used to detect whether the volume is bearish or bullish-oriented. OBV marks the particular volume of the day as bearish or bullish depending on whether the day has been bearish or bullish. It then adds/detracts that volume to the running open total. The total then indicates the overall sentiment of the market.
MONEY FLOW INDEX:
The money flow index shows the money flow and is calculated in a few steps. I recommend going to this link to read the steps yourself.
MARKET FACILITATION INDEX (MFI):
The MFI is created by trader Bill Williams and is based on volume as well. The MFI is calculated by:
MFI = (high – low) / volume
The formula is very simple, yet provides various interpretations in combination with volume. There are 4 different combinations based on MFI and volume. The color codes have the following meaning:
COLOR MFI / VOLUME MEANING B.WILLIAMS DESCRIPTION
1) Green MFI UP / VOLUME UP TREND CONT GREEN
2) Brown MFI DOWN / VOLUME DOWN TREND END FADE
3) Blue MFI UP / VOLUME DOWN SPIKES FAKE
4) Pink MFI DOWN / VOLUME UP START SQUAT
Green indicates a strong trend continuation mode. Brown indicates a potential area of the trend ending. Blue occurs in environments when a market spikes into 1 direction, often causing confusion about the trend direction. Pink indicates the beginning of a trend continuation or reversal. These are the volume tools you can use in the Forex market.
Remember, the volume is important for the analysis of stocks and futures. Volume, open interest, and price action are the key components in trading decisions.
What is the Best Volume Indicator?
The best volume indicator to apply to a volume trading strategy in the Forex market is the Chaikin Money Flow indicator (CMF).
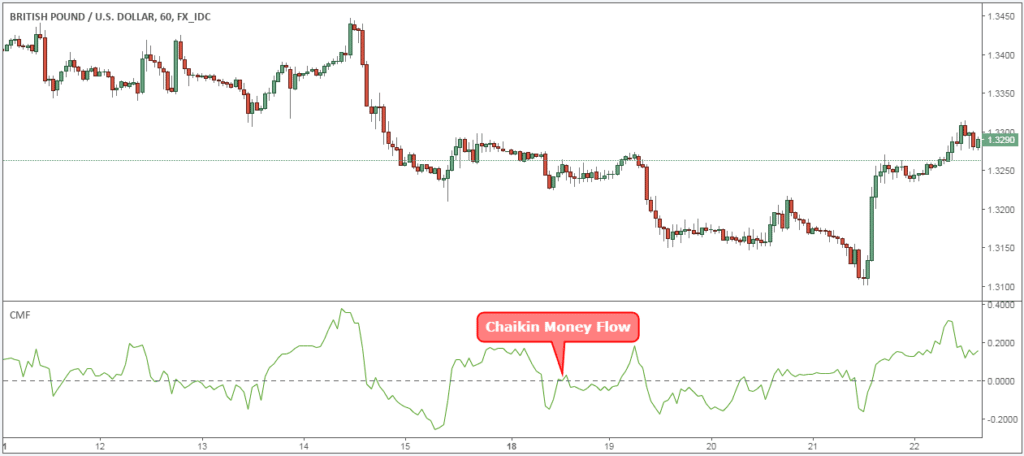
The Chaikin Money Flow indicator was developed by trading guru Marc Chaikin, who was coached by the most successful institutional investors in the world.
The reason the Chaikin Money Flow is the best volume indicator for a volume trading strategy is that it measures institutional accumulation-distribution.
Typically, on a rally, the Chaikin volume indicator should be above the zero line. Conversely, on sell-offs, the Chaikin volume indicator should be below the zero line.
What is the Difference between Chaikin Money Flow and Standard Volume
The difference between the Chaikin Money Flow and the standard volume is the math underlying each indicator. Secondly, the trading volume analysis is quite different as well as how the trading signals are interpreted.
On the one hand, volume simply measures how much a given currency pair has traded over any given period of time. Volume is used to measure the strength and weakness of a trend. As a general rule, a strong trend should be accompanied by rising volume. At the same time, a sharp rise in volume can also signal the potential end of a trend.
Now…
How is The Chaikin Money Flow Calculated?
The Chaikin Money Flow uses exponential moving averages in its calculations.
The math behind this volume trading strategy indicator is a bit complex, but it’s not required to really know all the ins and outs to use the CMF indicator successfully.
CMF = 21-day Average of the Daily Money Flow / 21-day Average of the Volume
Where:
- Money Flow Volume = Money Flow Multiplier x Volume for the Period
- Money Flow Multiplier = ((Close value – Low value) – (High value – Close value)) / (High value – Low value)
Basically, the indicator uses two exponentially weighted moving averages (EMAs) of the accumulation/distribution line. The accumulation/distribution line is similar to the one used by the MACD indicator.
Next…
Let’s see how to use the CMF indicator with the best settings.
See below:
What are the Best Settings for Chaikin Money Flow
The default setting for the best volume indicator is 21 periods.
While you can tweak the indicator settings and you can try different configurations, you need to keep in mind 3 things:
- A large period number will not give you more accurate trade signals.
- Higher settings will make the volume indicator less sensitive to short-term changes in the price.
- On the other hand, lower settings will make the CMF indicator extremely sensitive to short-term price changes and subsequently more prone to give false signals.
See the trading volume chart below:
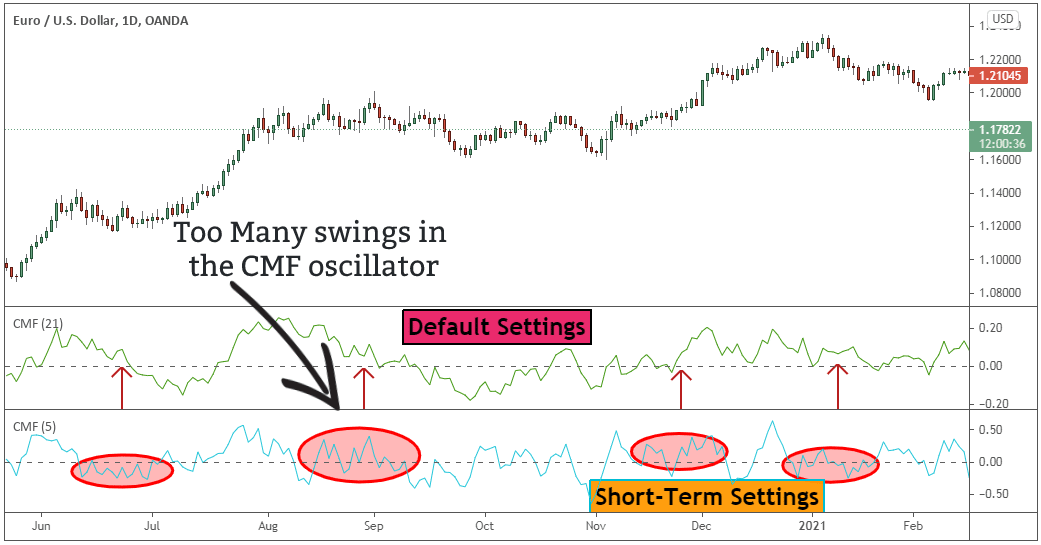
This makes CMF the best volume indicator for day trading.
Moving on…
Let’s examine the advantage of using a volume indicator.
See below:
Why you should Use the Chaikin Money Flow
The main advantage of the Chaikin Money Flow indicator is that the indicator can assess the buying pressure vs the selling pressure of your favorite currency pair (stock, ETF, cryptocurrency, futures market, etc.). Since we don’t have an aggregated volume in the foreign exchange market, this indicator is coming to the rescue.
With the CMF volume indicator, we can measure the amount of money coming into the market and its impact on the actual price.
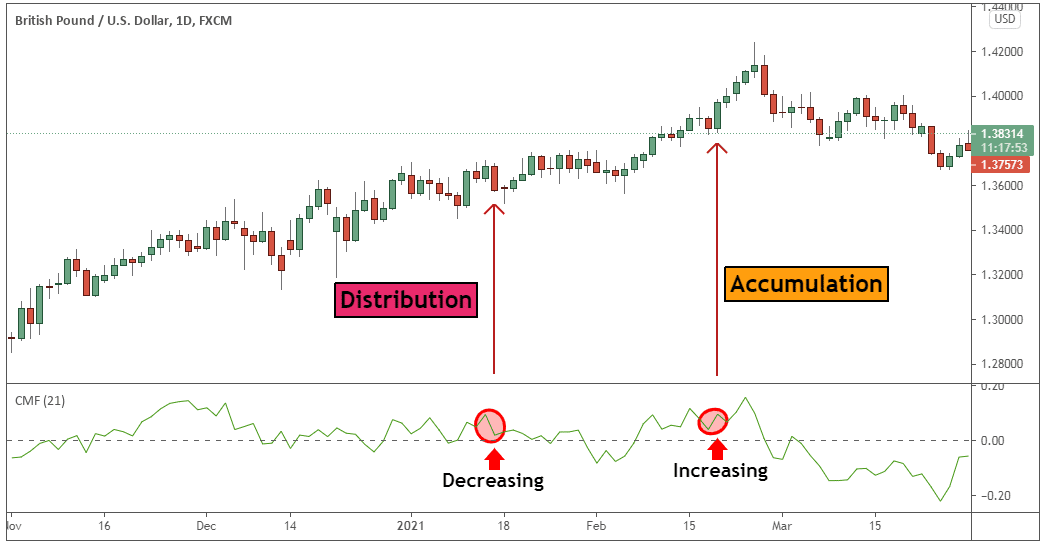
When the candle closes near the top of its price range on increase CMF volume, it’s a signal that smart money is accumulating. On the other hand, if the candle closes near the bottom of its price range on decreased CMF volume, it’s a signal that distribution is taking place.
Moving on…
Let’s see how 5 different ways you can use volume in trading:
How to Use Volume in Trading for Better Results
The CMF volume indicator can be used to confirm the strength of the trend, the accuracy of a breakout, trend reversals, false breakouts and so much more. Gaining an understanding of the different applications of the volume indicator in trading can help you improve your results.
Without further ado, here are a couple of ways to use price-volume analysis.
See below:
How to Use Volume for Trend Strength Confirmation
Here is how to use the CMF trading volume analysis indicator to determine the strength or weakness of a trend:
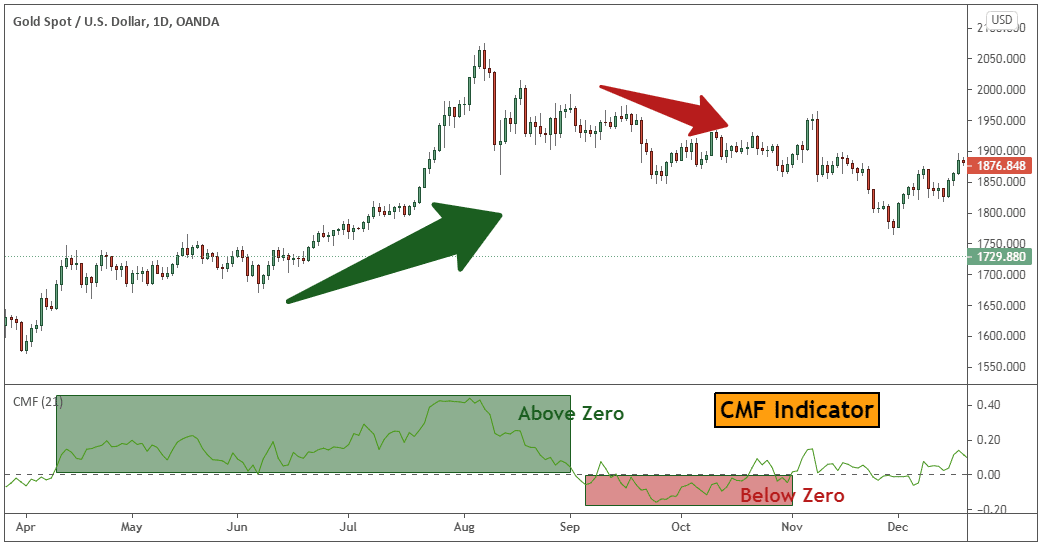
- When the CMF volume readings are above the zero level, it reveals a buying pressure and the fact that we’re in an uptrend. The higher the volume reading is the stronger the trend is.
- When the CMF volume readings are below the zero level, it reveals selling pressure and the fact that we’re in an uptrend. The lower the volume reading is the weaker the trend is.
How to Use Volume to Confirm Breakouts
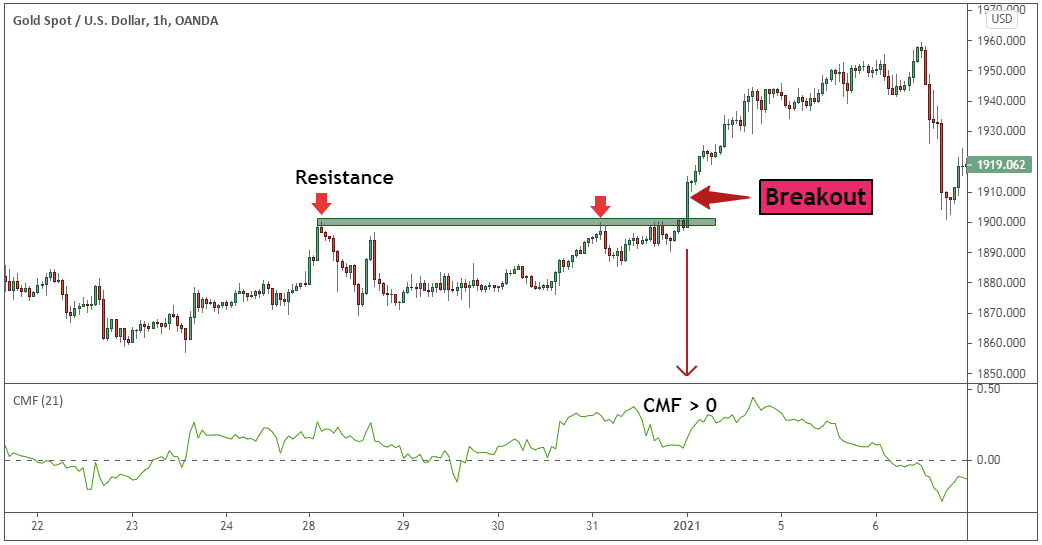
The Chaikin Money Flow indicator can also be used to confirm the strength of a breakout. If the CMF volume reading is above zero when we break a resistance that is viewed as buying pressure. In this case, the breakout has higher chances of success.
Conversely, if the CMF volume reading is below zero when we break a support level that is viewed as selling pressure. In this case, the breakout has higher chances of success.
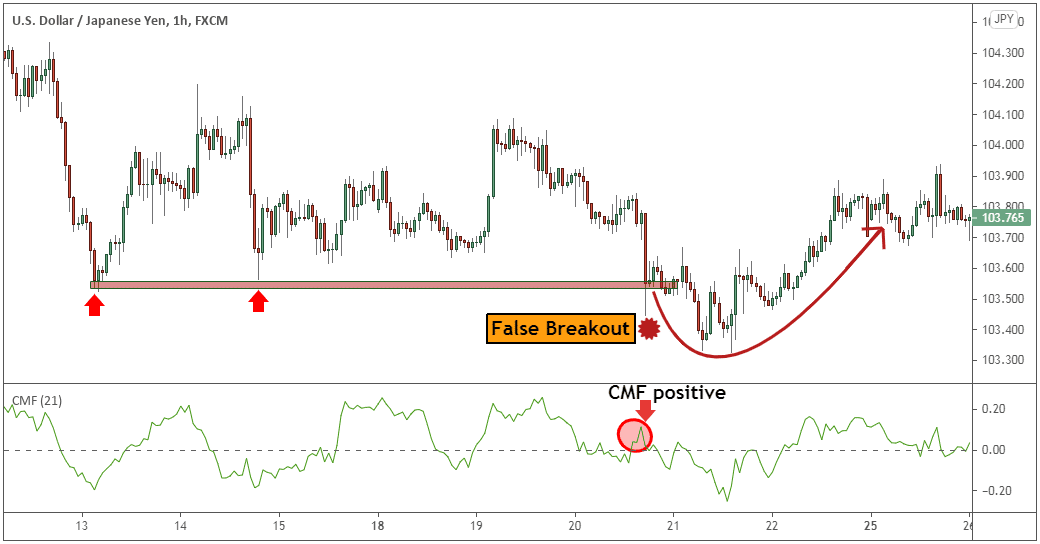
How to Use Volume to Confirm False Breakouts
We can also use the CMF volume readings to spot false breakout signals. If we break above resistance but we have negative readings on the CMF indicator that is a potential false breakout.
Conversely, if we break below a support level but we have positive readings on the CMF indicator that is a potential false signal.
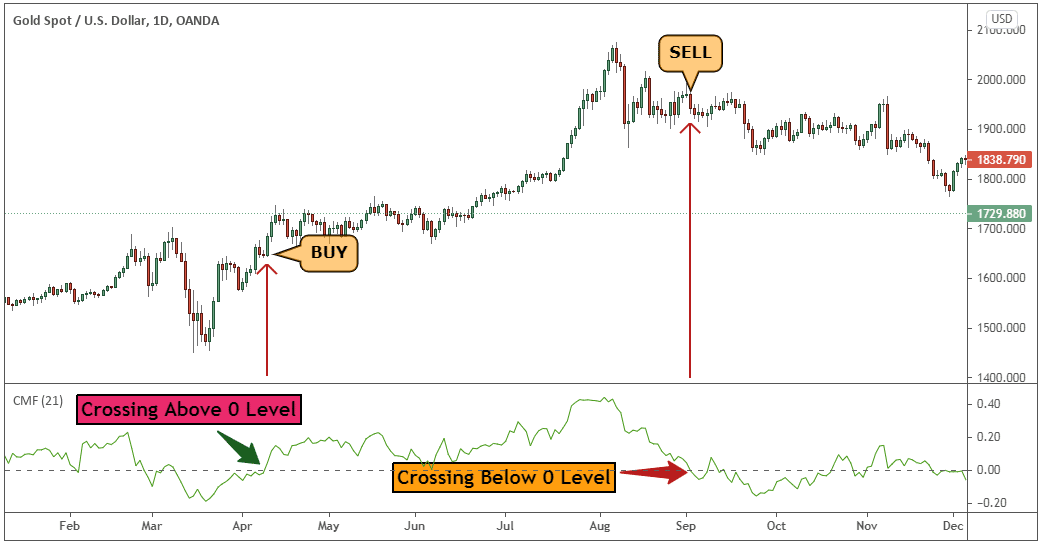
How to Use Volume for Buy and Sell Signals
The crossing of the zero level can be used to generate buy and sell signals.
Put it simply, when the CMF volume forex indicator crosses above zero, it’s seen as a buy signal. Conversely, when the CMF volume indicator crosses below zero, it’s seen as a sell signal.
Note* It should be avoided to use this type of trading signals in ranging markets.
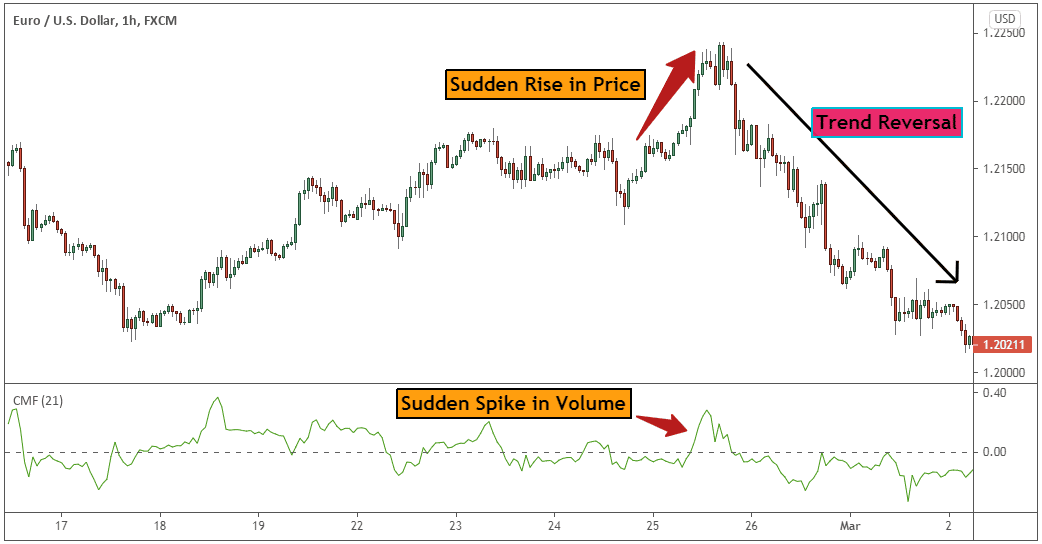
How to trade Volume Spikes
Usually, in both rising and falling markets during the last stage of the trend, we can see spikes in volume and volatility. These are often sharp price moves that are accompanied by sharp increase/decrease in trading volume.
When you see this type of action, it’s a warning sign of a potential trend reversal.
Next…
Let’s go over an effective volume trading strategy with buy and sell signals, stop loss and take profit levels to trade in both bull and bear markets.
See below:
See With Your Own Eyes: The Volume Trading Strategy From Trading Strategy Guides That Frequently Wins 77% of Trades.
This volume trading strategy uses two very powerful techniques that you won’t see written anywhere else. These are trade secrets that you wish you had been taught. The percentage of volume trading strategy that is advertised is achievable with a great deal of discipline. Understanding volume trading will help you to get the most value out of this volume trading strategy.
The Chaikin indicator will dramatically improve your timing and teach you how to trade defensively. Having a good defense when trading is absolutely critical to keep the profits that you’ve earned.
Before we go any further, we always recommend taking a piece of paper and a pen and take notes of the rules of this entry method. You can also read a million USD forex strategy.
In this article, we’re going to look at the buy-side.
What is The Importance of Buying Volume and Selling Volume
This volume trading strategy requires you to pay careful attention to the forces of supply in demand.
Volume traders will look for instances of increased buying or selling orders. They also pay attention to current price trends and potential price movements.
Generally, increased trading volume will lean heavily towards buy orders. These positive volume trends will prompt traders to open a new position.
On the other hand, if the cash flow and trading volumes decrease– we see a “bearish divergence”, meaning that it will likely be an appropriate time to sell.
You also need to pay attention to the relative volume—regardless of the raw number of transactions occurring in a trading period. Ask yourself how is the prospective asset performing relative to what was expected?
By learning how to use the Chaikin money flow and other relevant indicators, you will easily be able to identify whether the buyer or the seller is currently “in control.”
With practice, volume trading strategies can yield wins for your portfolio 77% of the time!
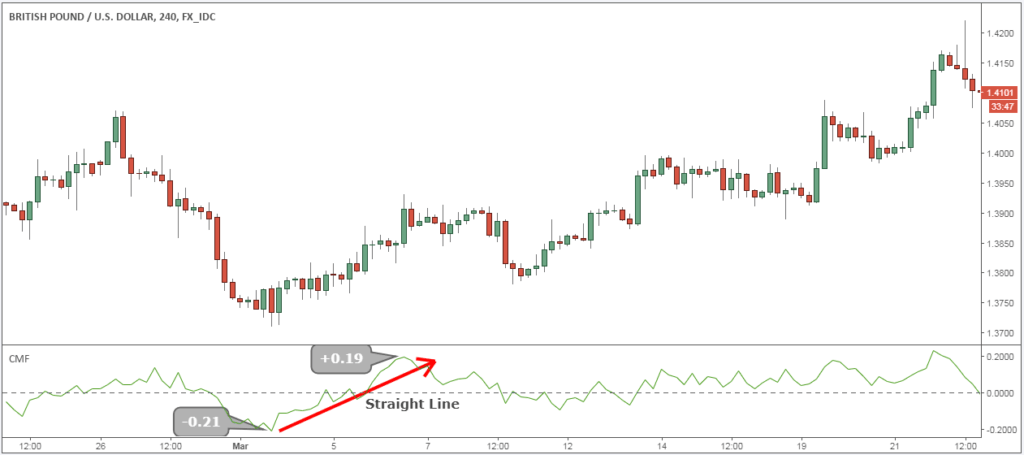
Step #1: Chaikin Volume Indicator must shoot up in a straight line from below zero (minimum -0.15) to above the zero line (minimum +0.15).
When the Volume goes from negative to positive in a strong fashion way it has the potential to signal strong institutional buying power. That’s our base heavy lifting signal!
Basically, we let the market reveal its intentions to us.
When big money steps into the market, they leave a mark as their orders are so big that it’s impossible to hide. When the volume indicator Forex goes straight from below zero to above the zero line and beyond, it shows accumulation by smart money.
We’re firm believers that you get the maximum bang for your buck when you trade side by side with smart money. Chances are that institutions have more money and more resources at their disposal. Odds can be stacked against you, so if you want to change that, just follow the smart money.
There is one more condition that needs to be satisfied to confirm a trade entry.
See below:
Step #2: Wait for the Volume Indicator Forex to slowly pull back below the zero line. The price needs to remain above the previous swing low.
Once we spot the elephant in the room, aka the institutional players, we start to look for the first sign of market weakness. Here is how to identify the right swing to boost your profit.
We’re going to let the Chaikin Money Flow indicator slowly drop below the zero line. The keyword here is “slowly”. We don’t want to see the volume dropping fast because this will invalidate the accumulation noted previously.
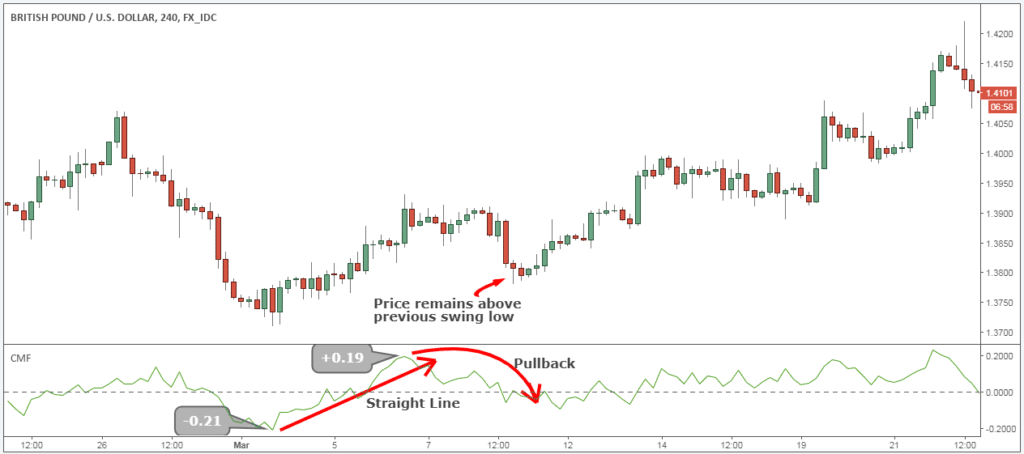
Second, as the volume decreases and drops below the zero level, we want to make sure the price remains above the previous swing low. This will confirm the smart money accumulation.
The Trading Strategy Guides volume trading strategy satisfies all the required trading conditions, which means that we can move forward and outline what is the trigger condition for our entry strategy.
See below:
Step #3: Buy once the Chaikin Forex indicator breaks back above the zero line. Wait for the candle to close before pulling the trigger.
Now that we have observed real institutional money coming into the market, we wait for them to step back in and drive the market back up.
When the Chaikin indicator breaks back above zero, it signals an imminent rally as the smart money is trying to markup the price again.
We would need to wait for the candle close to confirm the Chaikin break above the zero line. Once everything aligns, we’re free to open our long position. Here is an example of a master candle setup.
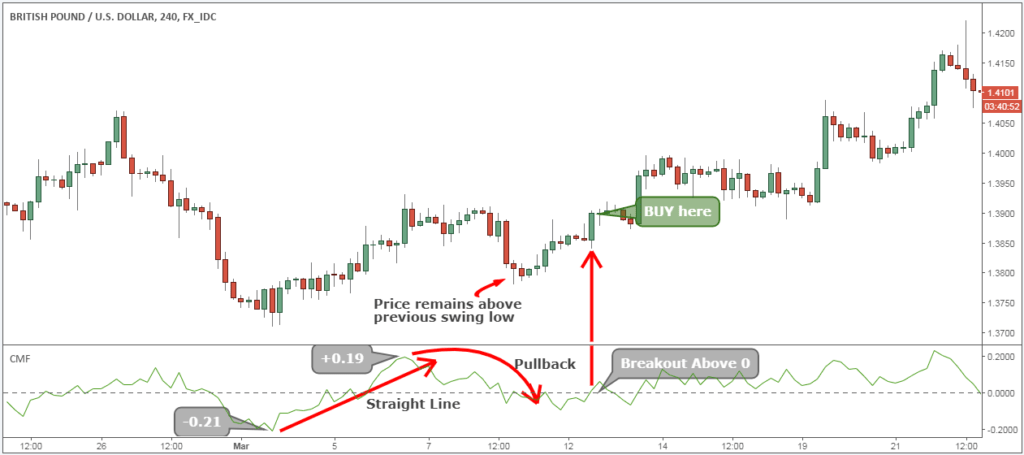
*Note: The trigger candle needs to have the closing price in the upper 25%.
This brings us to the next important step. We need to establish the Chaikin trading strategy which is finding where to place our protective stop loss.
See below:
Step #4: Hide your protective Stop Loss under the previous pullback low
Using a stop loss is crucial if you want to have an idea of how much you’re about to lose on your trade. Never underestimate the power of placing a stop loss as it can be lifesaving.
Simply hide your protective stop loss under the previous pullback’s low. Never use a mental stop loss when volume trading, and always commit an SL right the moment you open your trades.
Trading with a tight stop loss can give you the opportunity to not just have a better risk to reward ratio, but also to trade a bigger lot size.
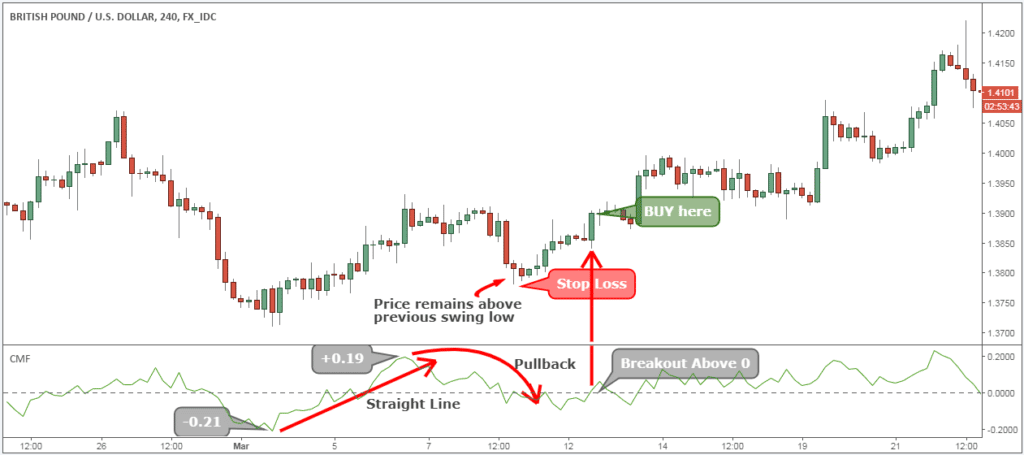
Last but not least, we also need to learn how to maximize the profits with the Chaikin trading strategy.
See below:
Step #5: Take profit when the Chaikin Volume drops below -0.15
Once the Chaikin volume drops back below -0.15, it indicates that the sellers are stepping in and we want to take profits. We don’t want to risk giving back some of the profits gained so we liquidate our position at the first sign of the smart money stepping in on the other side of the market.
We always can get back into the market later if the smart money buyers show up again.
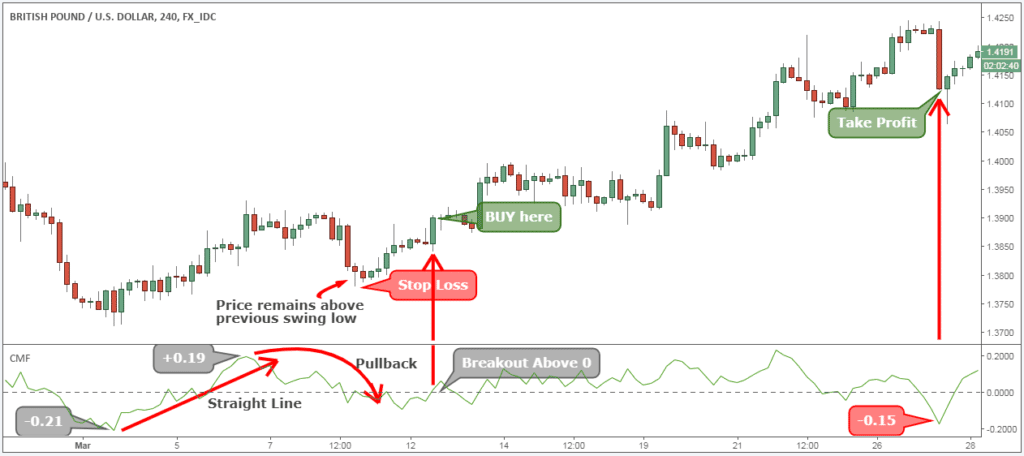
**Note: The above was an example of a BUY trade using the best volume indicator. Use the same rules for a SELL trade – but in reverse. In the figure below, you can see an actual SELL trade example.
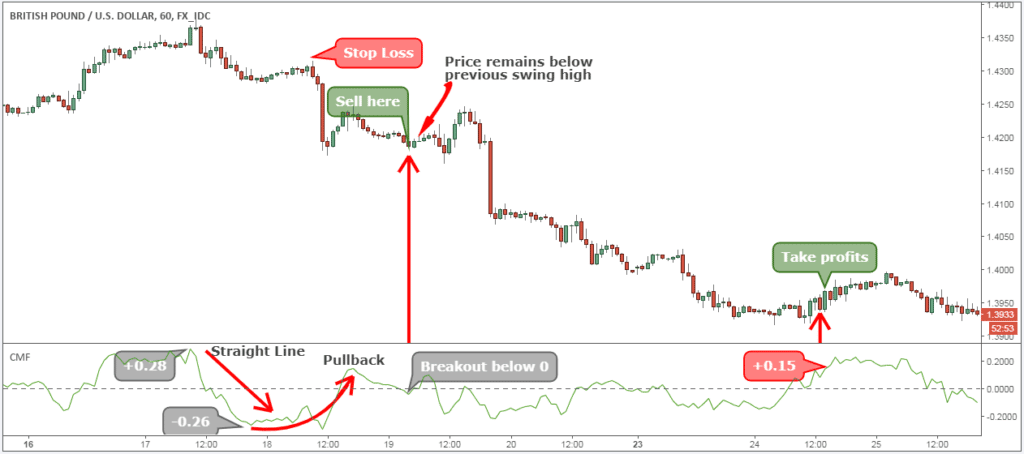
Conclusion – Best Volume Indicator
The Volume Trading Strategy will continue to work in the future because it’s based on how the markets move up and down. Any market moves from an accumulation (distribution) or base to a breakout and so forth. This is how the markets have been moving for over 100 years.
Smart money always seeks to mask its trading activities, but its footprints are still visible. We can read those marks by using volume indicator trading. Here is another strategy on how to apply technical analysis step by step.
Make sure you follow our favorite volume trading strategy for trading step-by-step guide to properly read the Forex trading volume. The Chaikin indicator will add additional value to your trading because you now have a window into the volume activity the same way you have when you trade stocks.
Thank you for reading!
Please leave a comment below if you have any questions about the best volume trading strategy!
Also, please give this strategy a 5 star if you enjoyed it!
Please Share this volume trading strategy PDF Below and keep it for your own personal use! Thanks Traders!
