In this guide, you’ll learn how to place a trade using the ascending triangle pattern. This is a breakout trading strategy that has the advantage of highlighting breakouts in advance. All you need to do is to learn the right trading technique and you’ll be able to recognize in real-time the anatomy of trading breakouts.
The cool thing about this chart pattern is that it can be used on a 5-minute chart, 1-hour chart, or whatever is our preferred time frame. No matter what your trading style is, whether it’s scalping, day trading, or swing trading. It’s the theory behind the supply-demand imbalances that make the price chart pattern work.
If you consider yourself a beginner in trading you may want to check out our guide to understand everything about financial markets.
Let’s understand how ascending triangle patterns form and how we can trade them.
See below:
What is Ascending Triangle Pattern
The ascending triangle formation is a continuation pattern and as the name suggests it has the shape of a triangle. The ascending triangle is also known as the bullish triangle because it leads to a bullish breakout.
The triangle chart pattern is generally considered a bullish pattern.
Note*: the reverse of an ascending triangle is the descending triangle also known as the bearish triangle.
How the ascending triangle looks like:
The first element of this price pattern is an upward-sloping trendline followed by a flat top.
This shows that the market has tried multiple times to break the resistance top but it couldn’t. Hence, we have developed a resistance line.
The second element of the ascending triangle is a slanting or a rising trendline moving upwards. This is what makes the pattern bullish.
See the chart below:
Remember that all continuation patterns like the bullish flag, rectangle pattern, and many others that you can find through our Trading Strategy Guides website, need to have a context of a trend.
Ascending Triangle vs Descending Triangle
In the case of the bullish ascending triangle, we need to have a previous uptrend to support the breakout. The easiest way to remember it is:
- Ascending triangles develop within bullish trends.
- Descending triangles develop within bearish trends.
Now that we’ve learned how the ascending formation looks, we want to share with you two things that we have learned from trading the bullish triangle.
The first little trick that we’ve learned is that on a price chart, the triangle pattern will rarely have a perfect shape.
Often you’ll see the ascending wedge pattern which will break the resistance line but have no real momentum behind the breakout. Other times, the pattern will develop spiky bars that will lead to false breakouts.
What you need to do is to wait for the triangle pattern to break out and close above our resistance line. Only then start buying on the next candle opening.
If you try to buy every swing high you can get stuck in a whipsaw when you’re trading this pattern.
Now, you might be wondering:
“Is ascending triangle bullish or bearish?”
Well, the short answer is bullish; however, the long answer is that it can be both.
Let me explain:
Normally, the ascending triangle is a bullish pattern because it’s most common to appear within an uptrend. However, there are some instances where the ascending triangle can act as a bearish pattern.
Those instances usually happen when the ascending triangle develops within a downtrend.
Let’s see a short study of when the ascending triangle happens during a bearish trend.
See below:
Ascending Triangle Pattern in Downtrend
So far we have seen how to trade ascending triangle within an uptrend but when the ascending triangle pattern develops within a downtrend we have two possible trade scenarios:
- A continuation of the downtrend
- Or, it can signal an imminent market reversal
If the flat resistance line is broken, the ascending triangle pattern can signal an upcoming trend reversal. In this case, we can expect a change in the trend, from bearish to bullish.
Here is an example:
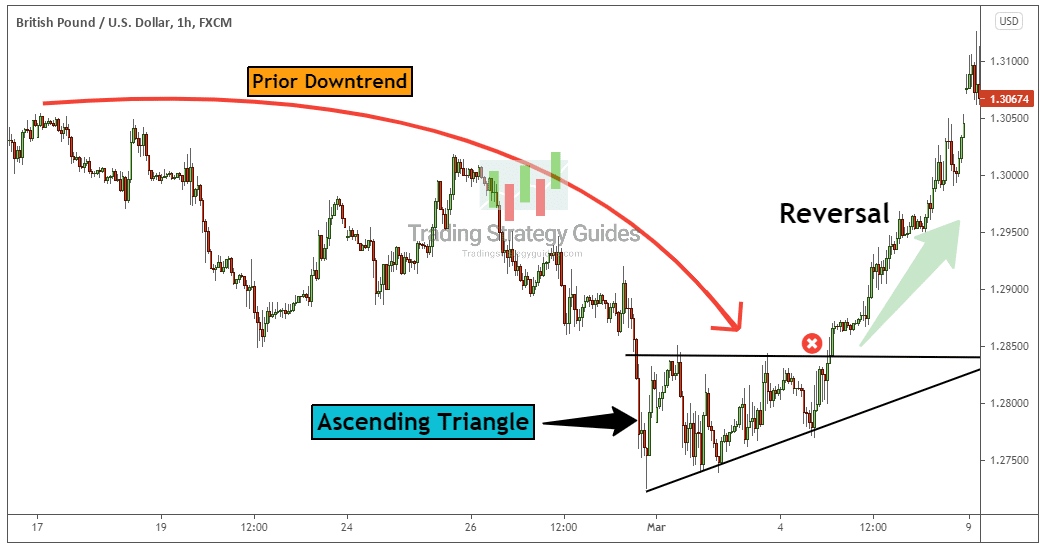
Unlike in an uptrend, when the ascending triangle pattern develops within a downtrend it’s more likely to signal a reversal than a continuation.
In this case, we apply the same trading rules (entry and exit) as we would with the ascending triangle pattern within an uptrend.
Now…
The ascending triangle also can play out as a continuation pattern.
Let me explain:
The top of the ascending triangle pattern can hold because the prevailing trend is downward. So, in a downtrend, the resistance level has a bigger chance to hold while the support level gets broken.
To act as a continuation pattern within a downtrend, the upward-sloping trendline of the ascending triangle must be broken.
A short trade is triggered once we break below the upward-sloping trendline.
See an example below:
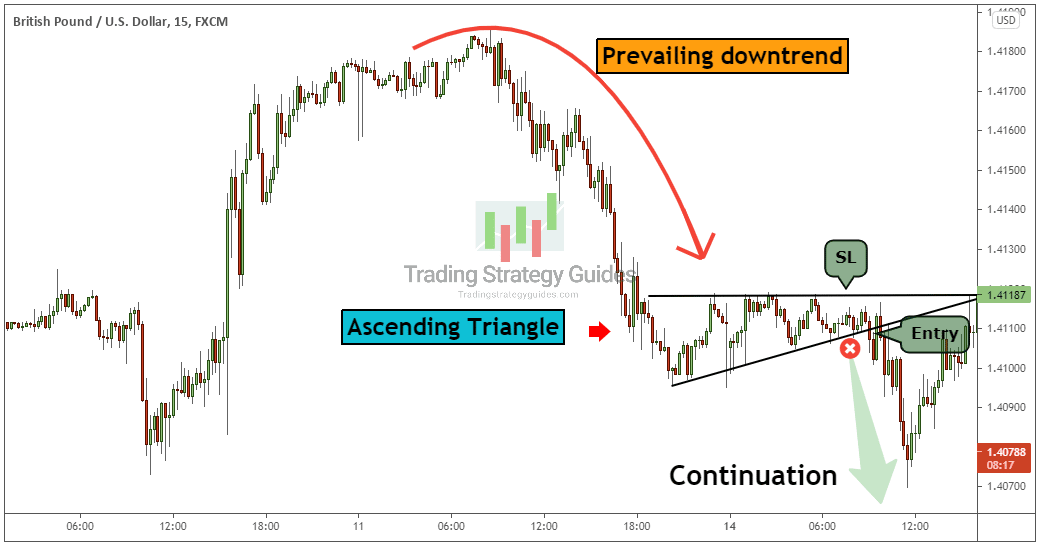
One advantage of this type of continuation play is that you’ve got to use a very tight stop loss. Naturally, the stop loss goes above the flat resistance line.
Next, we’ll jump to a simple breakout trading strategy that will teach you how to identify and trade the ascending triangle formation.
How to trade Ascending Triangle Pattern
Now, let’s go through some stuff that will make the triangle pattern easier to be understood.
You need to think in terms of what’s going on behind the scene. We don’t like just to look at the price, but also at what the market participants are doing.
When the price is moving up, it starts to develop the classical higher lows. For whatever reason may be buyers become a little bit more aggressive with each new successive higher low. Or, we can say that the sellers aren’t too aggressive when the market turns down inside the ascending triangle chart pattern.
Whichever side of the coin it is, that is what it’s causing the triangle price formation to develop.
When we reach the climax point of the triangle where the price has nowhere to go, that’s the moment when we should anticipate a breakout.
Once the triangle breakout happens we need to see a pick-up in volume that will result in a nice long trade.
The location of the pattern is also important!
If the triangle pattern is inside of a big trading range, then the solid resistance level might not be that significant. However, if the ascending triangle price formation develops in the middle of a bullish trend, that would add more weight to the pattern.
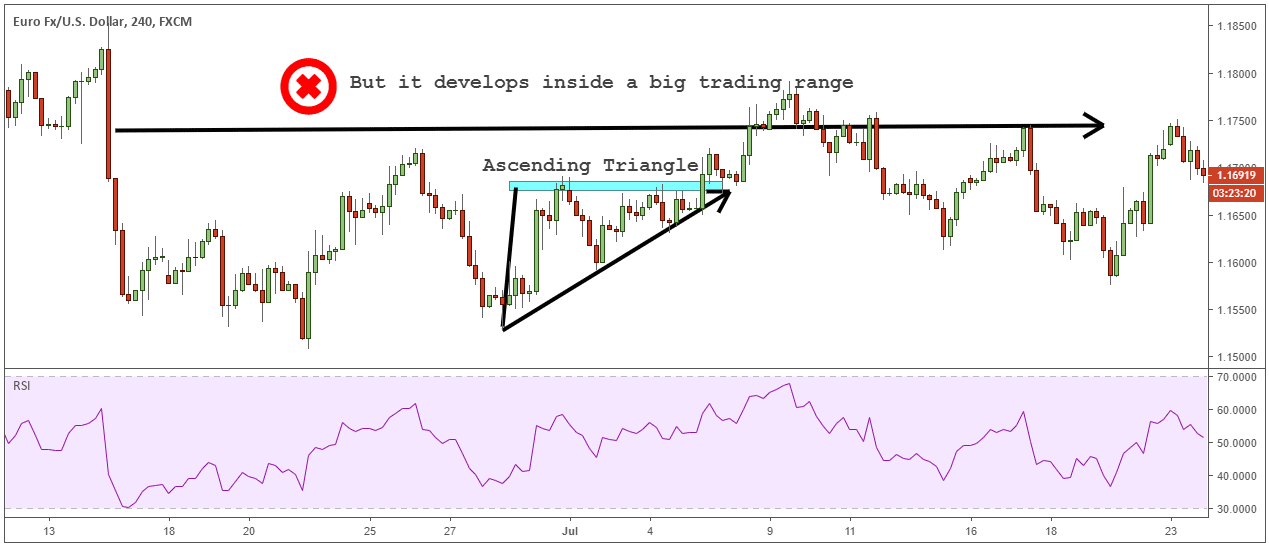
When the ascending triangle develops within a trend then we’re going to be interested in buying the breakout.
The ascending triangle trading strategy is an easy method to capture breakouts inside a trend. To confirm the breakout, we’re going to use the RSI tool which is a momentum-based indicator.
Since the price usually contracts inside the ascending triangle pattern, at one point either the bulls or the bears must win. With the RSI indicator in our trading arsenal, we can determine in advance who is going to win this battle.
How does it work?
Let’s get it step-by-step:
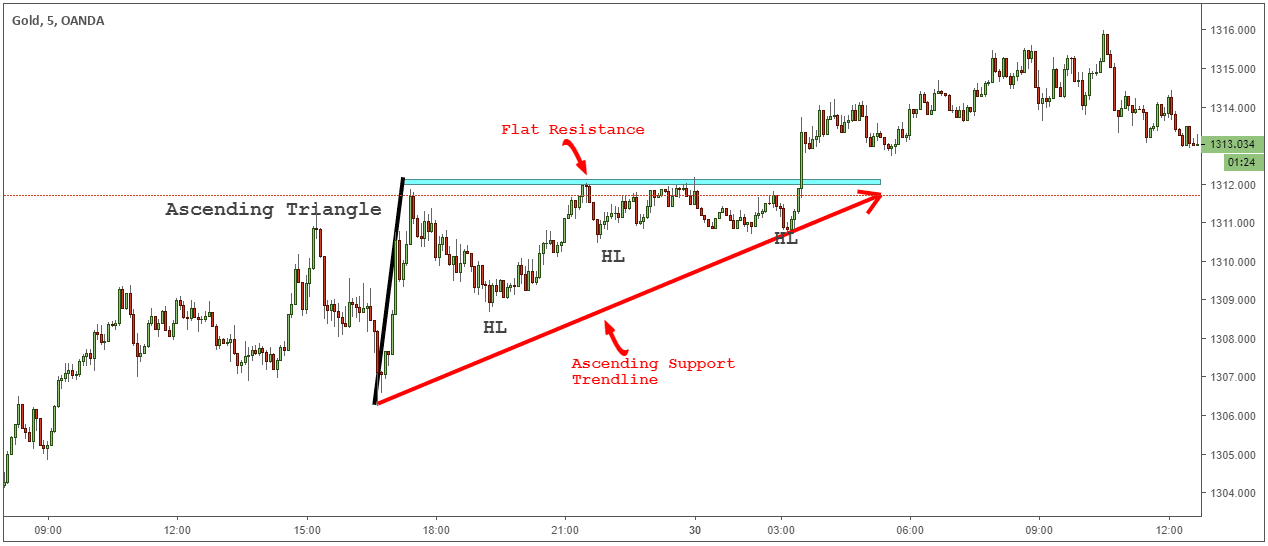
Step #1: The Ascending Triangle must Have a Flat Resistance and a Rising Support Trendline
The two elements of a good ascending triangle pattern are:
- A flat resistance that it’s hit multiple times. The more a resistance line is tested, the more likely it will eventually fail to hold at the resistance level.
- The second element is a rising support trendline that connects the successive higher lows inside the ascending triangle formation.
See the ascending triangle chart below:
Next, we’re going to make use of the RSI technical indicator.
See below:
Step #2: Apply the RSI 20-periods on your Chart
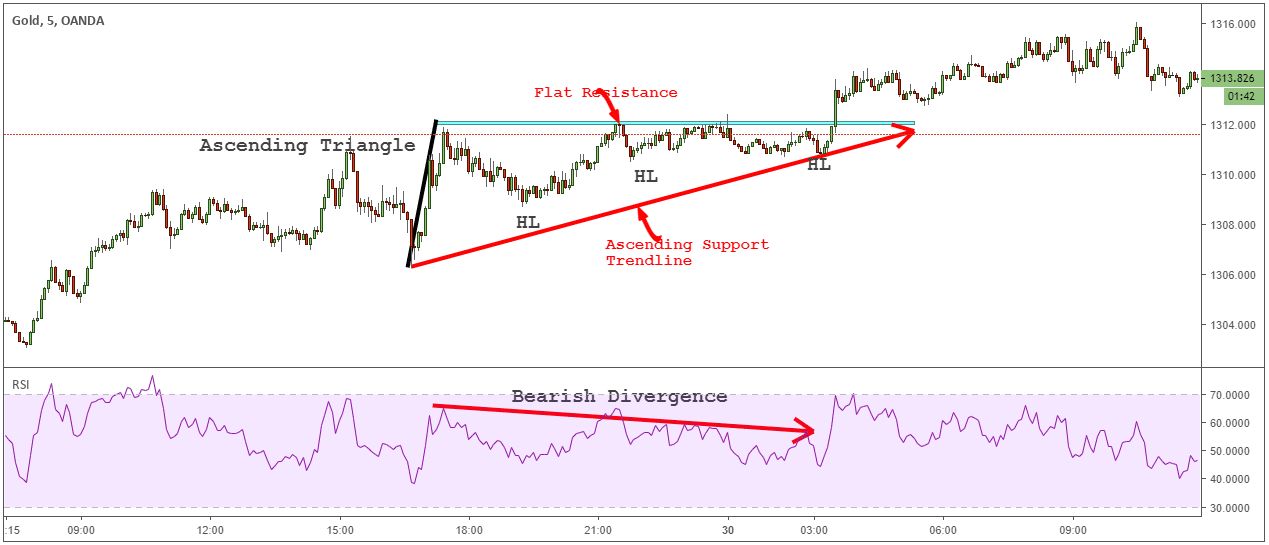
Normally, the price action consolidates inside the ascending triangle formation. This means that there is an ongoing battle between the bulls and the bears. Assessing who is going to win this battle can be done by looking at the RSI readings.
Before the breakout comes we can look at the action inside the consolidation to decide if it’s worth taking the breakout or if it’s better to just wait for another trade.
What we want to see is momentum decreasing after each successive retest of the flat resistance level. We look to see a bearish divergence developing on the RSI indicator.
See the ascending triangle chart below:
Now, before buying the breakout we need to check one more thing.
See below:
Step #3: Check if, before the Ascending Triangle Pattern, we have a bullish trend
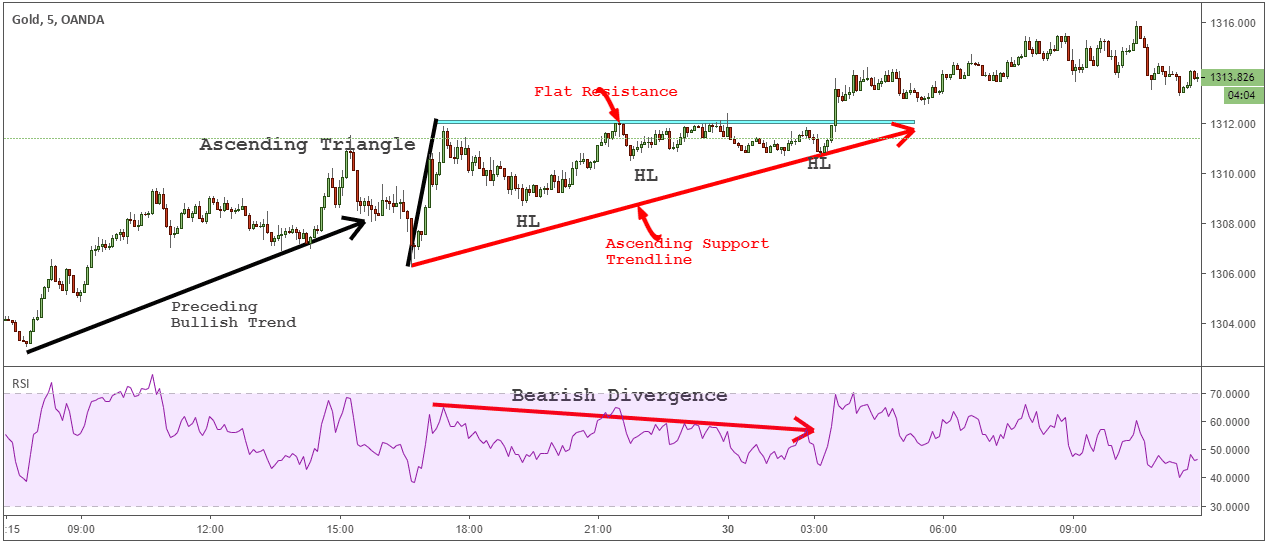
As a continuation pattern, naturally we need a preceding trend. In the case of the ascending triangle, which is a bullish pattern, we need to have a prior uptrend.
If we have a prior uptrend, it suggests that the breakout has a higher probability to happen on the upside.
See the ascending triangle chart below:
The last step is to define our entry trigger point and measure our profit targets.
See below:
Step #4: Buy as soon as we break above the flat resistance level
With continuation patterns, the best strategy is to buy straight away with the breakout. If we wait too much we end up leaving some of the available profits on the table.
We already have so many confluence factors that confirm the breakout that it’s useless to wait for more confirmation. After all, we want to anticipate the breakout and be ahead of the crowd.
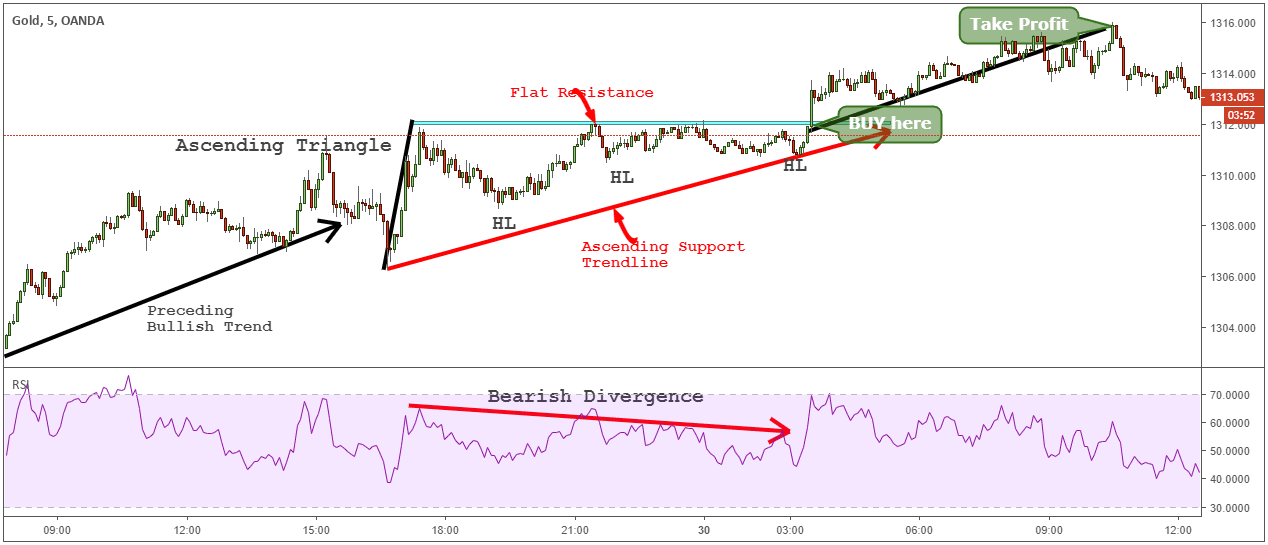
For the take-profit strategy, we’re going to use our favorite measuring technique. This is a dynamic strategy that it’s based on the actual price rather than a random number.
To find the profit target, simply take the high and the low of the ascending triangle formation and add that measurement to the breakout level. This will give you the ideal target for this continuation pattern.
FAQ – Ascending Triangle Pattern
Is ascending triangle bullish?
Yes, the ascending triangle is a bullish chart pattern that develops during an uptrend and signals an upside breakout. The bullishness of this pattern comes from the squeeze between the ascending trendline and horizontal resistance line which ultimately will force the break out of the pattern.
Is ascending triangles good?
The ascending triangle is a good chart pattern as long as it develops within an uptrend. As a continuation pattern, you have the advantage of trading in the direction of the prevailing trend. Additional benefits include a clear entry point and profit target.
What does an ascending triangle indicate?
The ascending triangle indicates a period of consolidation where the supply and demand forces are apparently at equilibrium. As the price gets squeezed toward the flat upper resistance, the bulls get stronger.
Can ascending triangle be bearish?
Yes, in some instances a breakout of the ascending trendline can produce a bearish signal. However, generally, the ascending triangle is a bullish price formation that occurs within an uptrend. If it develops within a downtrend it can be considered a bearish continuation pattern.
When should I buy ascending triangle?
It would help if you bought the breakout of the horizontal resistance trendline. For a more conservative entry, you can also wait for a break and close above the resistance before you enter the market. This will protect you in case of a false breakout.
Conclusion – Ascending Triangle Formation
The ascending triangle formation is a very powerful chart pattern that exploits the supply and demand imbalances in the market. You can time your trades with this simple pattern and ride the trend if you missed the start of the trend.
Many technical analysts trade the breakout without first taking the time to understand what goes behind the scene. With the ascending triangle, we can have a perfect head start, and see the trading opportunity before it happens. So, being able to recognize the ascending triangle pattern can be a valuable tool that you can use to identify profitable trades.
Thank you for reading!
Don’t forget to read this article on symmetrical triangle trading.
Feel free to leave any comments below, we do read them all and will respond.


