Learn the divergence trading strategy before you try picking a trend reversal. Throughout this trading guide, you’ll learn the basic skills to find mismatches between the price action and the best divergence indicator. As a bonus, you’ll get the 5 rules of trading divergence and convergence in any market.
We have discussed the advantages of using the Awesome Oscillator in your trading. We explained how you can use the tool with your divergence trading strategy. One of the advantages of the indicator is its usage in determining divergence and convergence. However, considering the importance of divergence and convergence, the topic deserves to be expanded into a full-scale article. We will fully explain the power of divergence.
Before we dive into the divergence trading strategy, let us first explain what the terms mean.
Divergence Trading Strategy: What are Divergence and Convergence?
The definition of convergence is to come together. For example, the lines converge at this point.
To diverge means to move or draw apart. When a currency pair is converging, it means that price and momentum are in sync with each other. The price is also moving at a sustainable pace. When a currency pair is diverging, it means that price and momentum are not in sync with each other.
The action is moving at a less stable/sustainable pace and the likelihood of a correction or reversal increases. The divergence-convergence analysis measures the power a currency has at one point in time with another point in time. Then it compares the two with each other. The analyst can then judge whether the currency is showing signs of strength or weakness.
Why are Divergence and Convergence Trading Important?
The convergence and divergence tool is a very powerful method. The main benefit of this analysis comes from the fact that it is not lagging. Similar to price action, the convergence, and divergence analysis is a very useful support in predicting future price behavior based on current values.
This is the opposite of lagging indicators. By definition, they are always following price action in their development.
Divergence is an event that is associated with increased levels of volatility. An asset’s value can only diverge so much before it experiences a major price swing and adjusts back to what the market believes it “should” be worth. Increased volatility creates more profitable trading opportunities over the course of a given trading period.
By paying attention to instances of strong convergence and strong divergence, you can capture unique trading opportunities that you may not have noticed before.
Price action always gives the most up to date information. The interpretation of price is an art and not an easy task. Adding a method to support one’s strategy, and an analysis that has more predictive value could be very useful.
What Do Divergence and Convergence Look Like on a Chart?
Using the Moving Average Convergence Divergence Indicator (MACD) is a good place for you to begin your analysis. Like the Awesome Oscillator mentioned above, the MACD focuses on using averages from multiple different time periods.
Unlike the AO, the MACD uses closing prices and also uses exponential moving averages. These averages have been adjusted in order to emphasize the importance of more recent trends. The time frames used by the MACD indicator include 9 periods, 12 periods, and 26 periods.
At its core, divergence trading has one key and vital rule. If the price makes a higher high, the oscillator should also be making a higher high. If the price makes a lower low, the oscillator should also be making a lower low.
This statement could be printed out and taped above your computer. In cases this does not happen, something “fishy” is happening. The analyst may look for more clues to determine the currency pair’s behavior and diagnosis.
Divergence-convergence can only be evaluated when the price has either formed:
- A higher high than the previous high
- A lower low than the previous low
- Double top
- Double bottom
The MACD and Awesome Oscillator (AO) are the best indicators to measure such a move. The RSI, the relative strength index, is another method.
I myself prefer using the AO. A proper divergence is only present when the histograms indicating momentum have retraced back to the zero line. Two subsequent lows or highs where the histograms have not returned to the zero line are not proper divergences. These are sometimes called bad divergences. Often enough if a trader would zoom in on the 1-time frame a proper divergence would become noticeable there.
How to use Regular Divergence – Convergence
When running a convergence divergence analysis, it is important to pay attention to how price turning points are relatively changing over time. As time goes on, are the high points for these prices increasing or decreasing? What about the low points? Understanding the important relationship that exists between these turning points can help you become a much more effective trader.
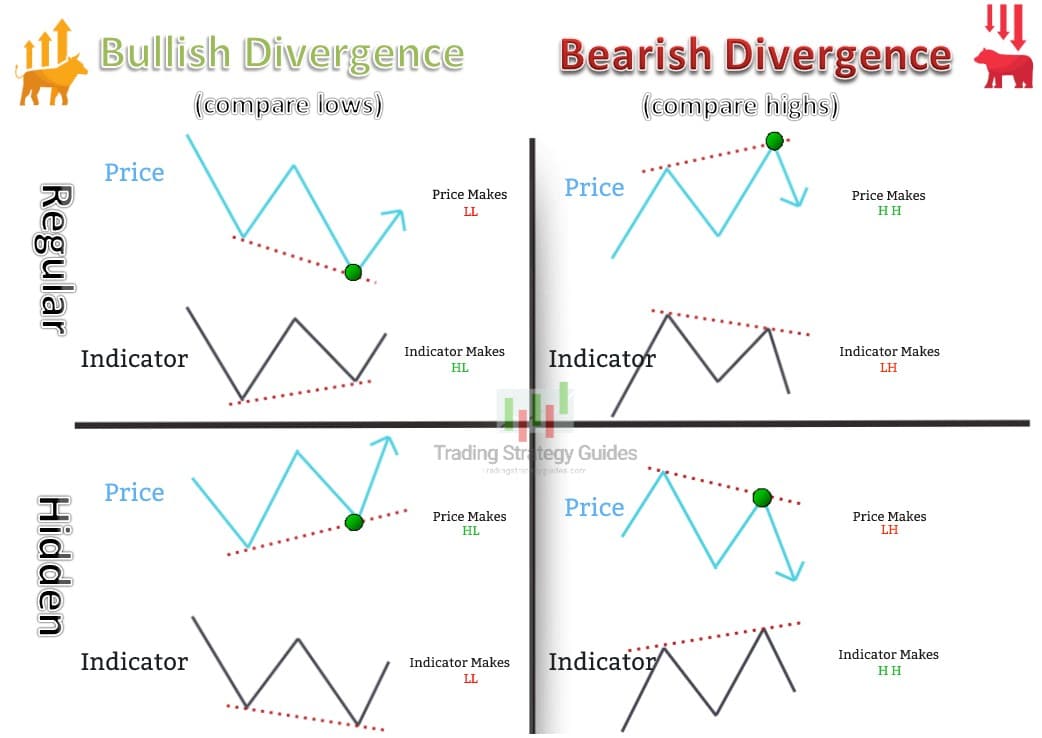
A regular divergence is used as a possible sign of a trend pause or trend reversal. A regular bullish divergence occurs when the price is making lower lows (LL). But the oscillator is making higher lows (HL). Usually, this happens at the end of a downtrend. Price and momentum are expected to move in line with each other. If the price makes a new low, but the oscillator fails to make such a new low itself, it is likely that the price will retrace or reverse.
The opposite is true for regular bearish divergence. This happens when the price is making a higher high (HH), but the oscillator makes a lower high (LH). This type of divergence can be found in an uptrend. When such divergence occurs, the price will most likely retrace or reverse.
Divergence and convergence can be used in multiple manners:
- When the currency is converging, the likelihood of trend continuation is high. The trend reversal is unlikely (this guideline is somewhat less reliable on lower time frames).
- When the currency is diverging, the likelihood of trend continuation is decreasing. This means the trend reversal is possible.
- When the currency has double or triple divergence, the likelihood of trend continuation is unlikely. A trend reversal is a decent probability.
The oscillators indicate to us that momentum is possibly shifting. Even though the price has made a new peak or bottom, the chances of the momentum being sustained and continued are decreasing. Regular divergence is useful for cautiously predicting the end of a trend.
Only in some cases will the currency pair totally reverse for a trend in the opposite direction. May I emphasize the word cautious in the previous sentence? It is a tricky trading element to master. It is always beneficial to add other methods of confirming a trend is potentially ending. Also read about Trader’s Tech and Installing MT4 EAs with Indicators.
Other Methods of Confirming Divergence
One method of analyzing divergence from a different perspective is by using trend lines and trend channels. Once divergence occurs in the market, the single-line trend lines can identify when a trend is ending. It may signal the end of a trend. Waiting for that break could be one way of trading divergence. Similar trend lines can also be used on the momentum indicators themselves (f.e. using the same spots in time as on price action). The momentum trend lines will be useful in identifying and spotting reversals and trend breaks.
Another important point is by managing expectations with regard to divergence. There is a substantial difference between the pip size of a reversal and a retracement. Be careful to reckon and plan on both in your trading plan. One way of distinguishing between the two is by looking at the time frame. If a trader is observing a 15 min or 1-hour divergence, the divergence will most likely create a pause or retrace within a bigger trend continuation.
If a higher time frame has divergence, the likelihood of a trend reversal is higher. Basically the higher the time frame, the more powerful as you can see in this example of the EURUSD. Also, the likelihood of a trend reversal increases if double or even triple divergence is spotted. In Elliott Waves’ terms, this is explained by the divergence between Wave 3 and 5 of a bigger Wave 3. And then the divergence between bigger Wave 3 and 5.
A trader can also decrease the risk of divergence trading by only trading divergences when they occur in multiple time frames. The likelihood of a bounce increases when more time frames show diverging movements between price and momentum.
While regular divergence is especially useful for cautiously predicting the end of a trend, hidden divergence can be a good indication of trend continuation. Hidden bullish divergence takes place when the price is making a higher low (HL). But the oscillator is showing a lower low (LL). In an uptrend, hidden divergence happens when the price makes a higher low but the oscillator makes a lower low.
A hidden bearish divergence occurs when the price makes a lower high (LH). But the oscillator is making a higher high (HH). In a downtrend, hidden divergence happens when the price makes a lower high but the oscillator makes a higher high.
Now…
Do you want to start trading divergence and convergence, but you have no idea where to start?
Don’t worry, we’ve got your back!
Learn them, and make sure you use them next time you try trading divergence convergence.
Ignore them and watch how hard trading can be all of a sudden.
How to Trade The Divergence Trading Strategy
– The 5 Golden Rules
Before you start trading divergence trading strategy make sure you go through these 5 golden trading rules:
- Divergence can only show up in 4 different price scenarios
- For bearish divergence, the swing high prices typically correspond to an indicator’s high point
- For bullish divergence, the swing low prices typically correspond to an indicator’s low point
- The slope – or the angle of the line connecting the highs and lows tells us how strong the divergence actually is
- Never chase divergence if the price action played out
Let’s go through each of these divergence trading strategy rules one by one.
Here’s how it works:
Divergence Trading Strategy Rule #1: It only exists in 4 different price scenarios
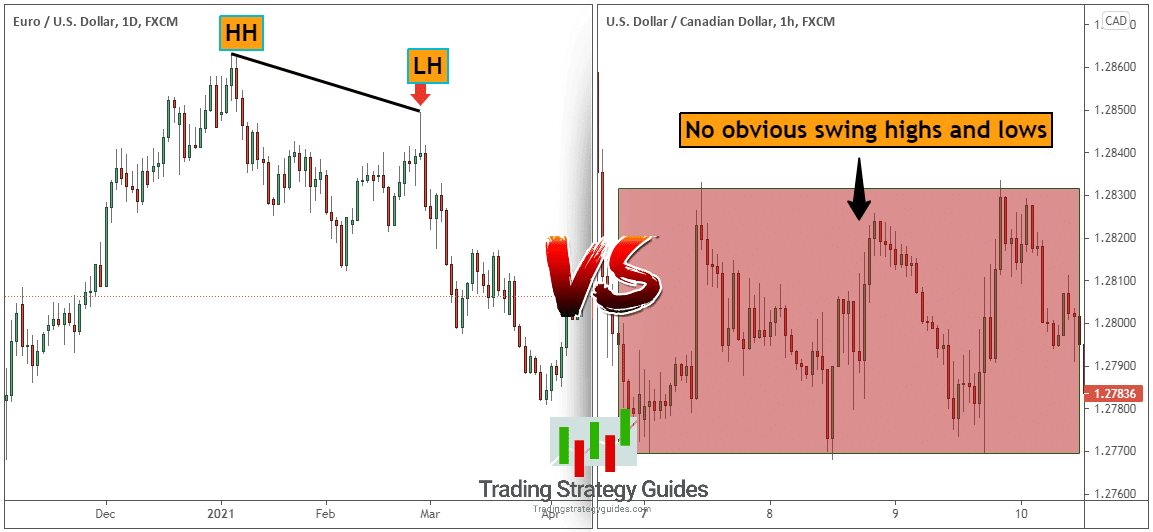
Divergence can only be displayed on the price chart if the price forms a double top, double bottom, a higher high than the previous high, or a lower low than the previous low.
If you’re not able to see these price actions playing out, forget about checking your indicator.
Why?
Simply because it’s impossible for the divergence to play out otherwise.
Here’s an example of what I mean:
Now, let’s move on with the second rule.
See below:
Divergence Trading Strategy Rule #2: For Bearish Divergence Only Connect Highs
This is straightforward.
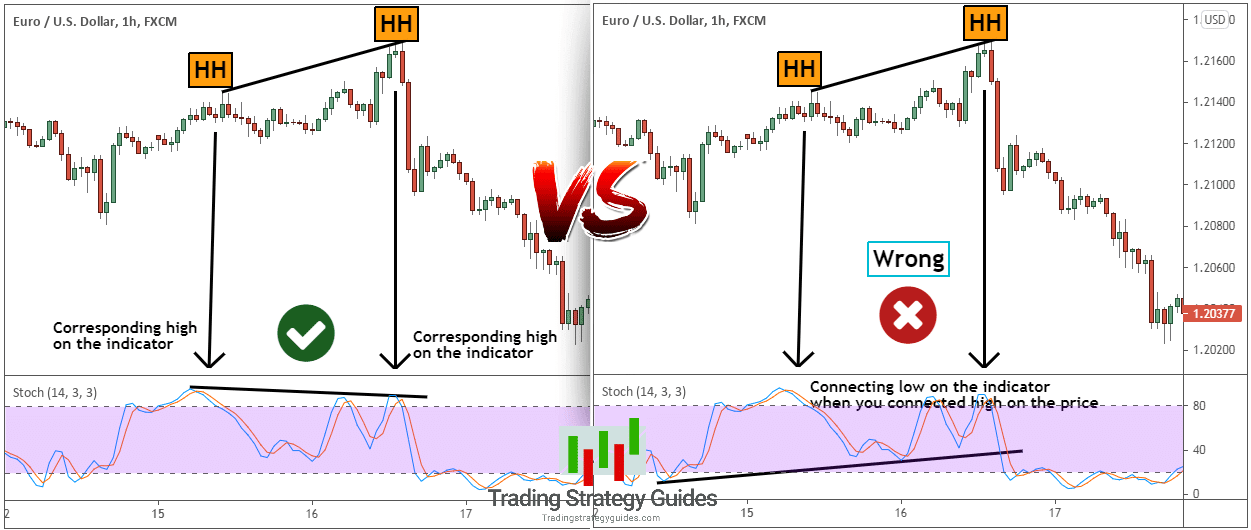
If you’re looking at bearish divergence we draw a line between two highs.
Now, the rule is that you must draw a line between two highs on the indicator as well.
Don’t make the mistake of using price highs and then on the indicator you connect low points. They have to match.
The swing high must correspond to an equivalent high on the indicator. Simply draw an imaginary vertical line from the price to the indicator, to rapidly spot the corresponding high points.
Here is a bearish divergence example:
Now, the same rules are applied to the bullish divergence, but in reverse.
See below:
Divergence Trading Strategy Rule #3: For Bullish Divergence Only Connect Lows
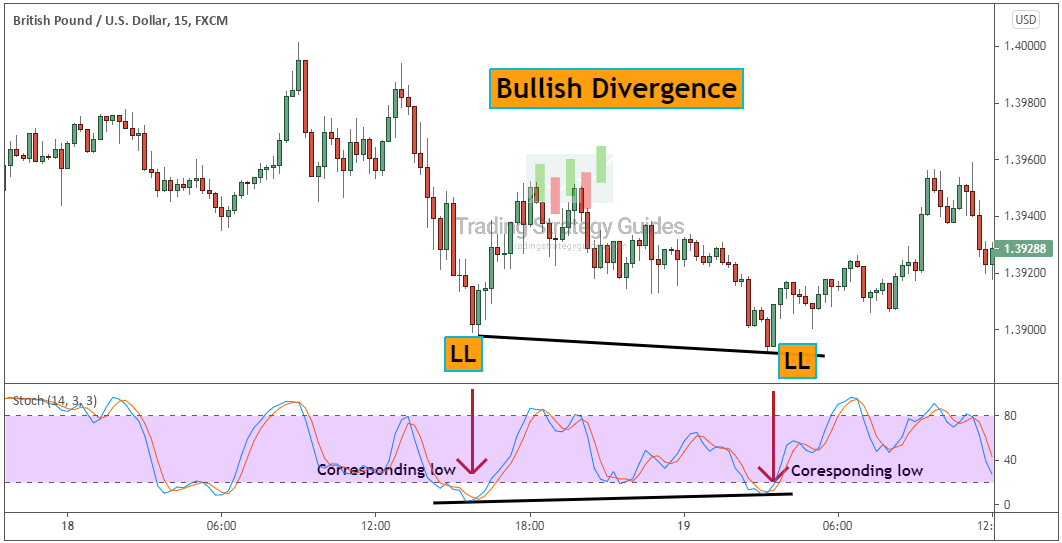
For bullish divergence, we look to connect lows on the price action and lows on the indicator as well.
The lows on the price chart must vertically line up with the lows on the technical indicator.
Here is what I mean:
Now, rule number 4 has to do with the line slope.
See below:
The Power Of Divergence Trading Rule #4: The Line Slope Hints to the Strength of the Divergence
Divergence can only exist if we have an ascending slope or descending slope either on the price action or on the indicator itself.
But, here is a secret that no one tells you:
The bigger the divergence slope is the higher the chances of a price reversal are. And, not just that, but also the profit potential increases exponentially.
Don’t believe us?
Here is a comparison of two regular divergences with different slopes:
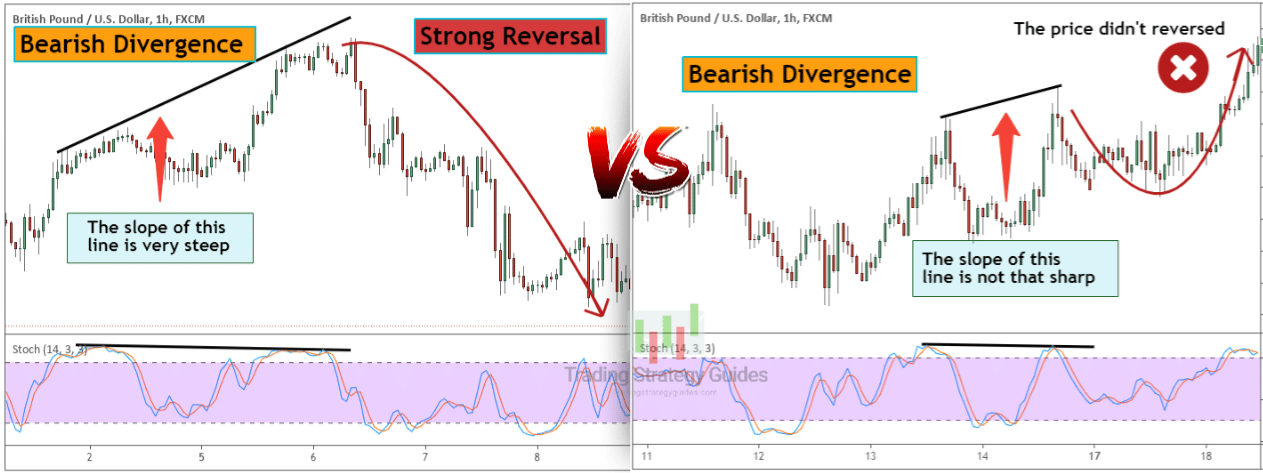
The key takeaway is that you can put more weight on the regular divergences that have steep slopes.
Next…
Another pro tip is to never chase a divergence.
Here is what I mean:
The Power Of Divergence Trading Rule #5: Don’t Chase Divergence
If the divergence has run its course, it means you’re already too late to the party.
The smart way to trade divergence is as soon as they happen. Once the price has started reversing and it’s at a good distance, far away from its recent swing high (low), it’s better to wait for another divergence signal to show up.
We know it always looks tempting to chase a market but keep in mind is a loser’s game.
Moving on…
We have another surprise for you.
See below:
Your Cheat Sheet on the Divergence Trading Strategy
To help you trade bullish and bearish divergences and hidden divergences we’ve created a quick cheat sheet.
Memorize it, save it on your desktop, and use it whenever you feel confused about the price action.
See below the ultimate divergence cheat sheet.
Divergence Trading Strategy Conclusion
Like all trading strategies, remember that using Convergence Divergence indicators require a certain degree of risk. Whether you are using the Awesome Indicator, MACD, Relative Strength Index, or any other, you will need to carefully protect yourself from the risks of speculation. By keeping the Divergence Trading Strategy, you can increase your winning percentage and practice unique trading opportunities.
Please be careful when implementing this divergence trading strategy. Make sure to do proper backtesting and incorporate other tools and time frames to confirm the divergence and convergence readings.
Before I wish you a good weekend, I am giving you a must-read article about the Best Average True Range in Forex – enjoy! Have a great week and Happy Trading!
Thank you for reading!
Please leave a comment below if you have any questions about the power of divergence!


