This post is written by Jet Toyco, a trader and trading coach.
In the world of trading oscillators…
You have the RSI indicator…
The Stochastic Indicator…
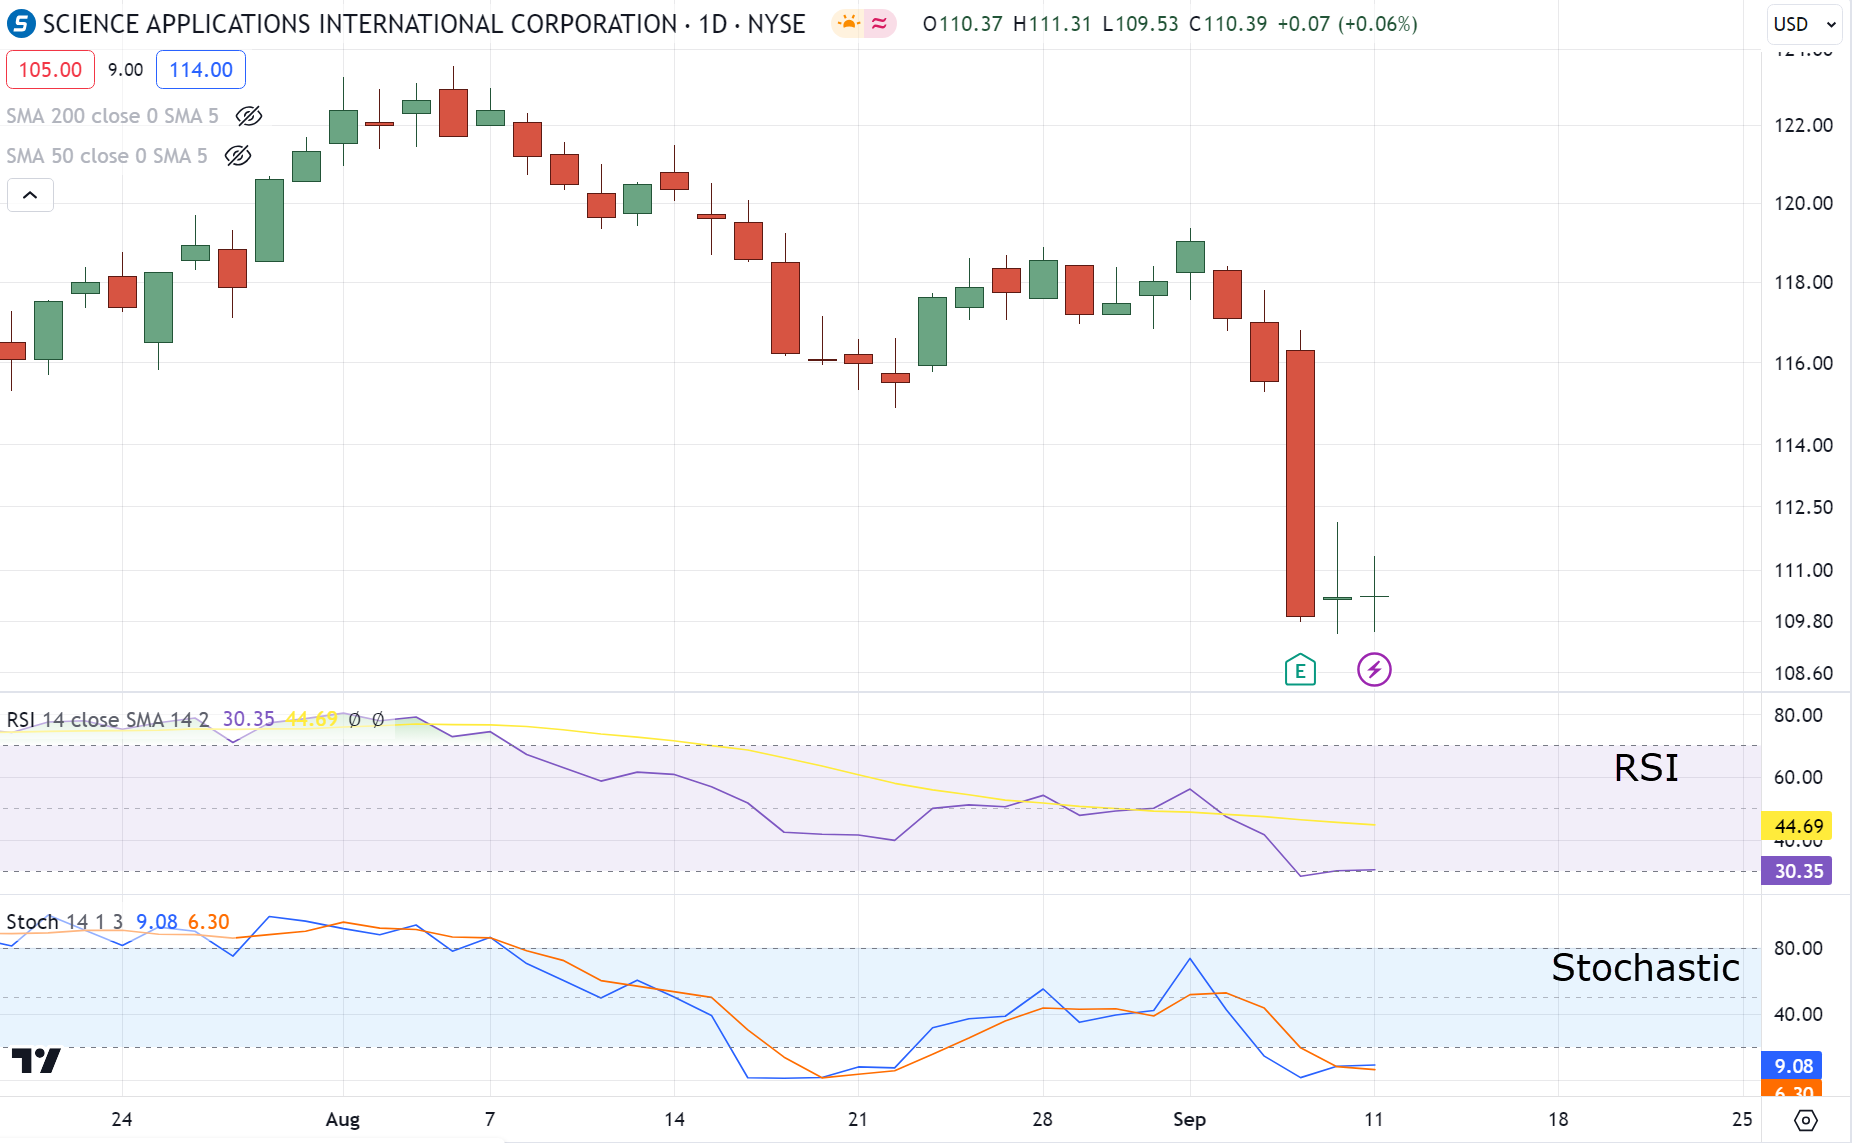
Heck – you even have the Stochastic RSI indicator!…

So, with all the plethora of indicators out there…
What does the ROC indicator bring to the table?…
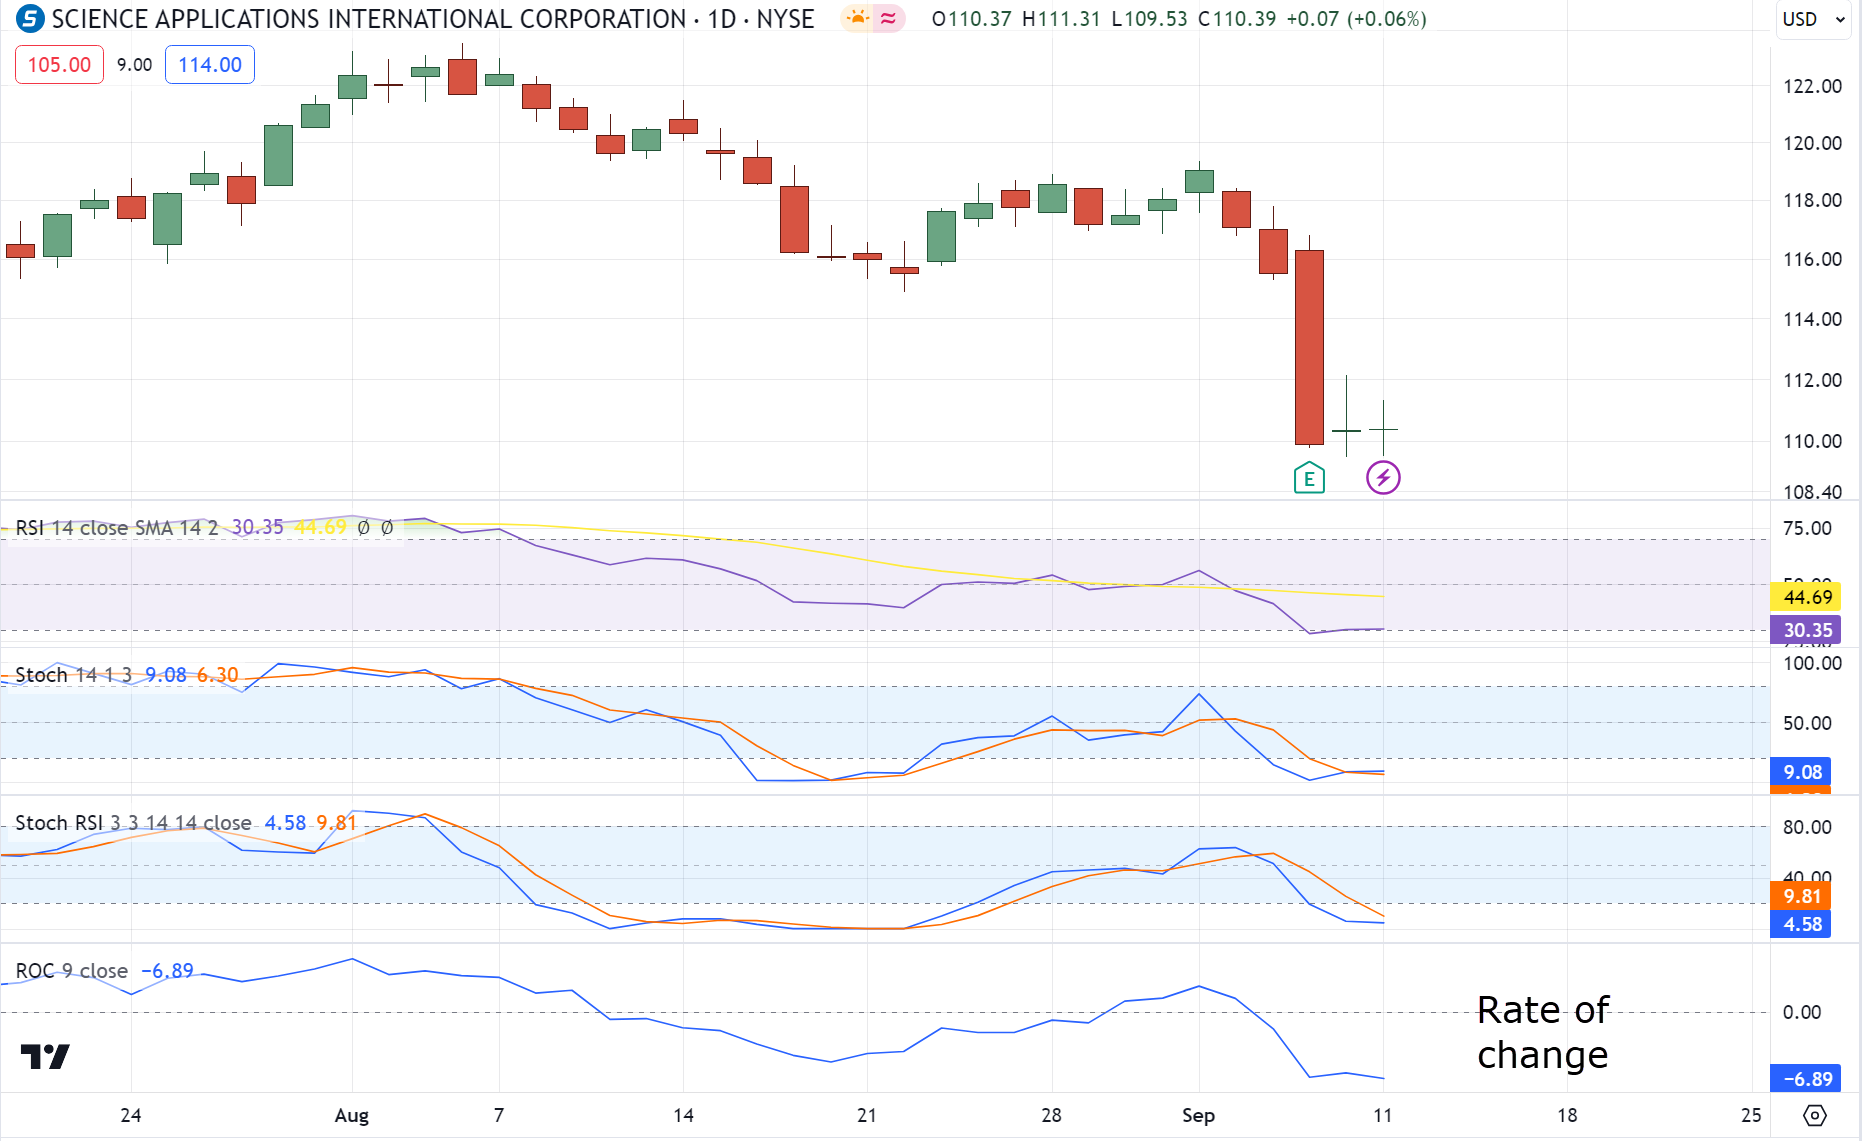
…is it there to better time your entries?
…or to call out trends, maybe?
Nope!
It’s there to help you pick the best markets for your watchlist – so you never have to second-guess yourself again!
That’s why in today’s guide you’ll learn…
- What the ROC indicator is and how it’s meant to be used
- A proven and tested way to select the best stocks to trade with the ROC indicator
- How to use the ROC indicator to choose profitable Forex pairs to trade
- A backtesting result to figure out if the ROC indicator works or not
This guide could be crucial to support your trading portfolio (especially the last section!).
So, prepare your notes and charts – and let’s get started!
What is the ROC indicator and how do you use it
The rate of change indicator (ROC) is a momentum-based oscillator developed by Fred G. Schutzman back in the 1950s.
It’s existed for a pretty damn long-time – and for good reason!
But, how does it work?
In simple terms…
The ROC indicator measures how strong or weak a market is.
It does this by dividing the last closing price by the previous closing price (depending on the period you choose).
Here’s what I mean:
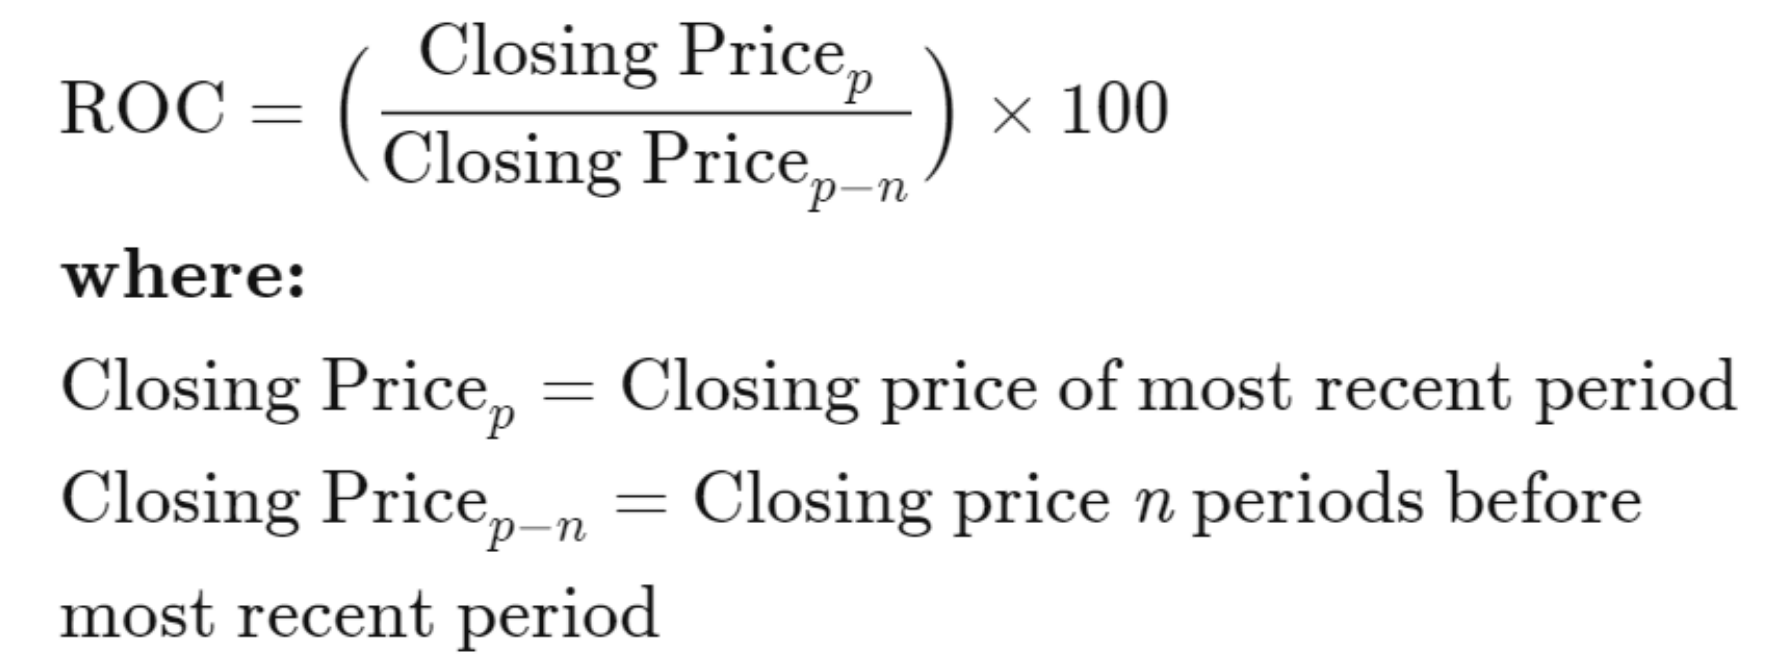
Source: Investopedia
To put it in simple terms…
Let’s say you decided to compare your physical strength , between 2016 to 2019.
The ROC indicator would be a great metric for this – giving you a clear idea of just how much things had changed in that time

And that’s right…
There are no “overbought” and “oversold” levels here…
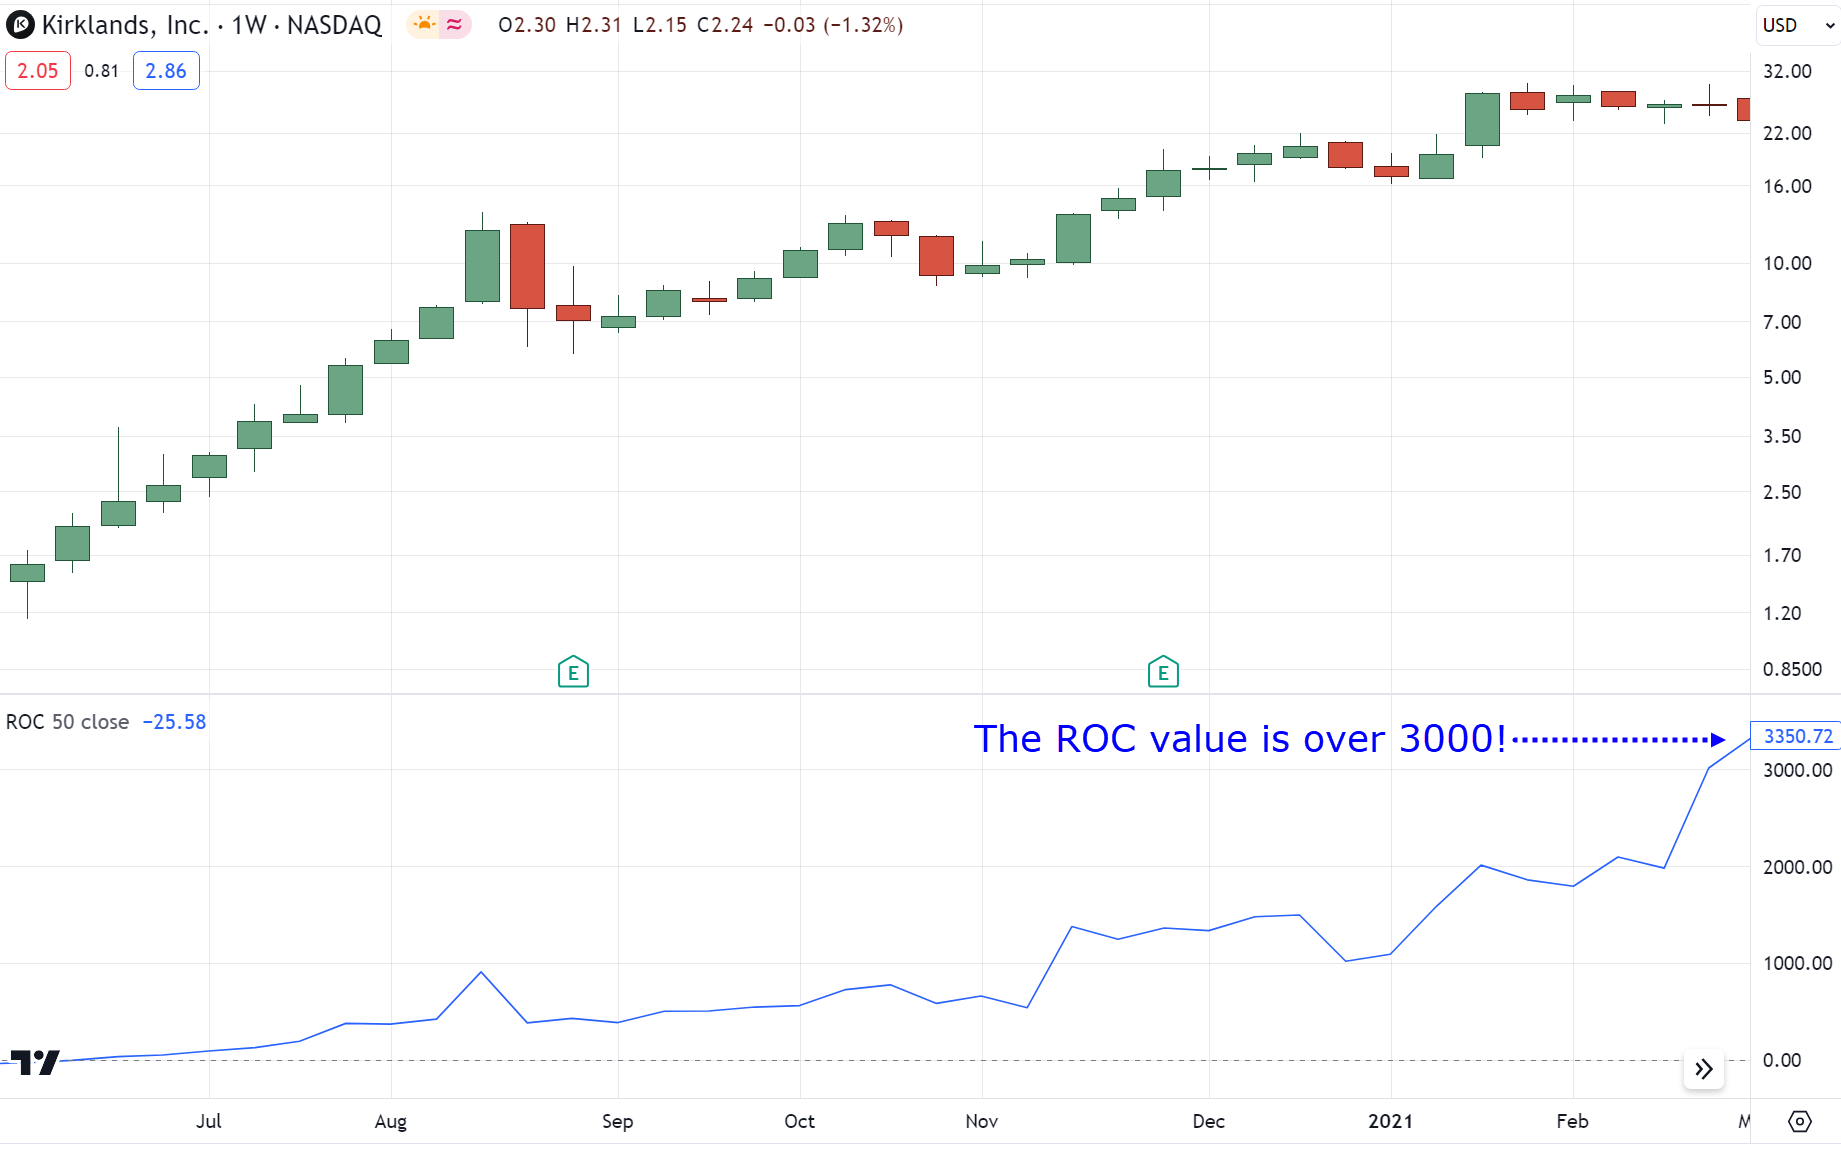
Simply put – the higher the value is, the stronger the market is as a whole (in a way, a higher or lower value means the market has been trending well).
Alright, now that you know how it works…
How do you use the ROC indicator?
Two words, my friend…
Market selection
This is what most new traders miss out on.
…as they’re usually way too focused on shiny new strategies and indicators!
But here’s what I want to tell you right now.
A consistent way to select markets to trade is the biggest contributor to stable performance.
Now read that again.
Got it?
Great!
OK, I know what you’re thinking right now…
“Alright, how exactly do I use the ROC indicator to select markets to trade?”
Well, you’re in for a treat.
Let me show you in the next section…
Using the ROC indicator to pick the best stocks to trade
“There are thousands of stocks out there, which one do I enter?”
“Which market sector should I trade stocks on?”
Have you asked these questions before?
I’m sure you have!
And when the answer isn’t obvious, what’s next?
…Look for stock tips, right?!
Some “insider” news on which stocks to pick!?
Of course, as you know, it’s never sustainable.
Instead…
What you need, to consistently pick winning stocks, are three step-by-step processes:
Step #1: Setup your trend filter
Just like a trading strategy that tells you when to enter and exit your trade…
A trend filter is essential to your trading plan.
Now, if you trade the US Stock market, you have access to screeners such as:
- Finviz
- TradingView
- Thinkorswim
…and probably more.
And the best part?
They’re all free!
However, I’ll be using Thinkorswim as an example for this trading guide…
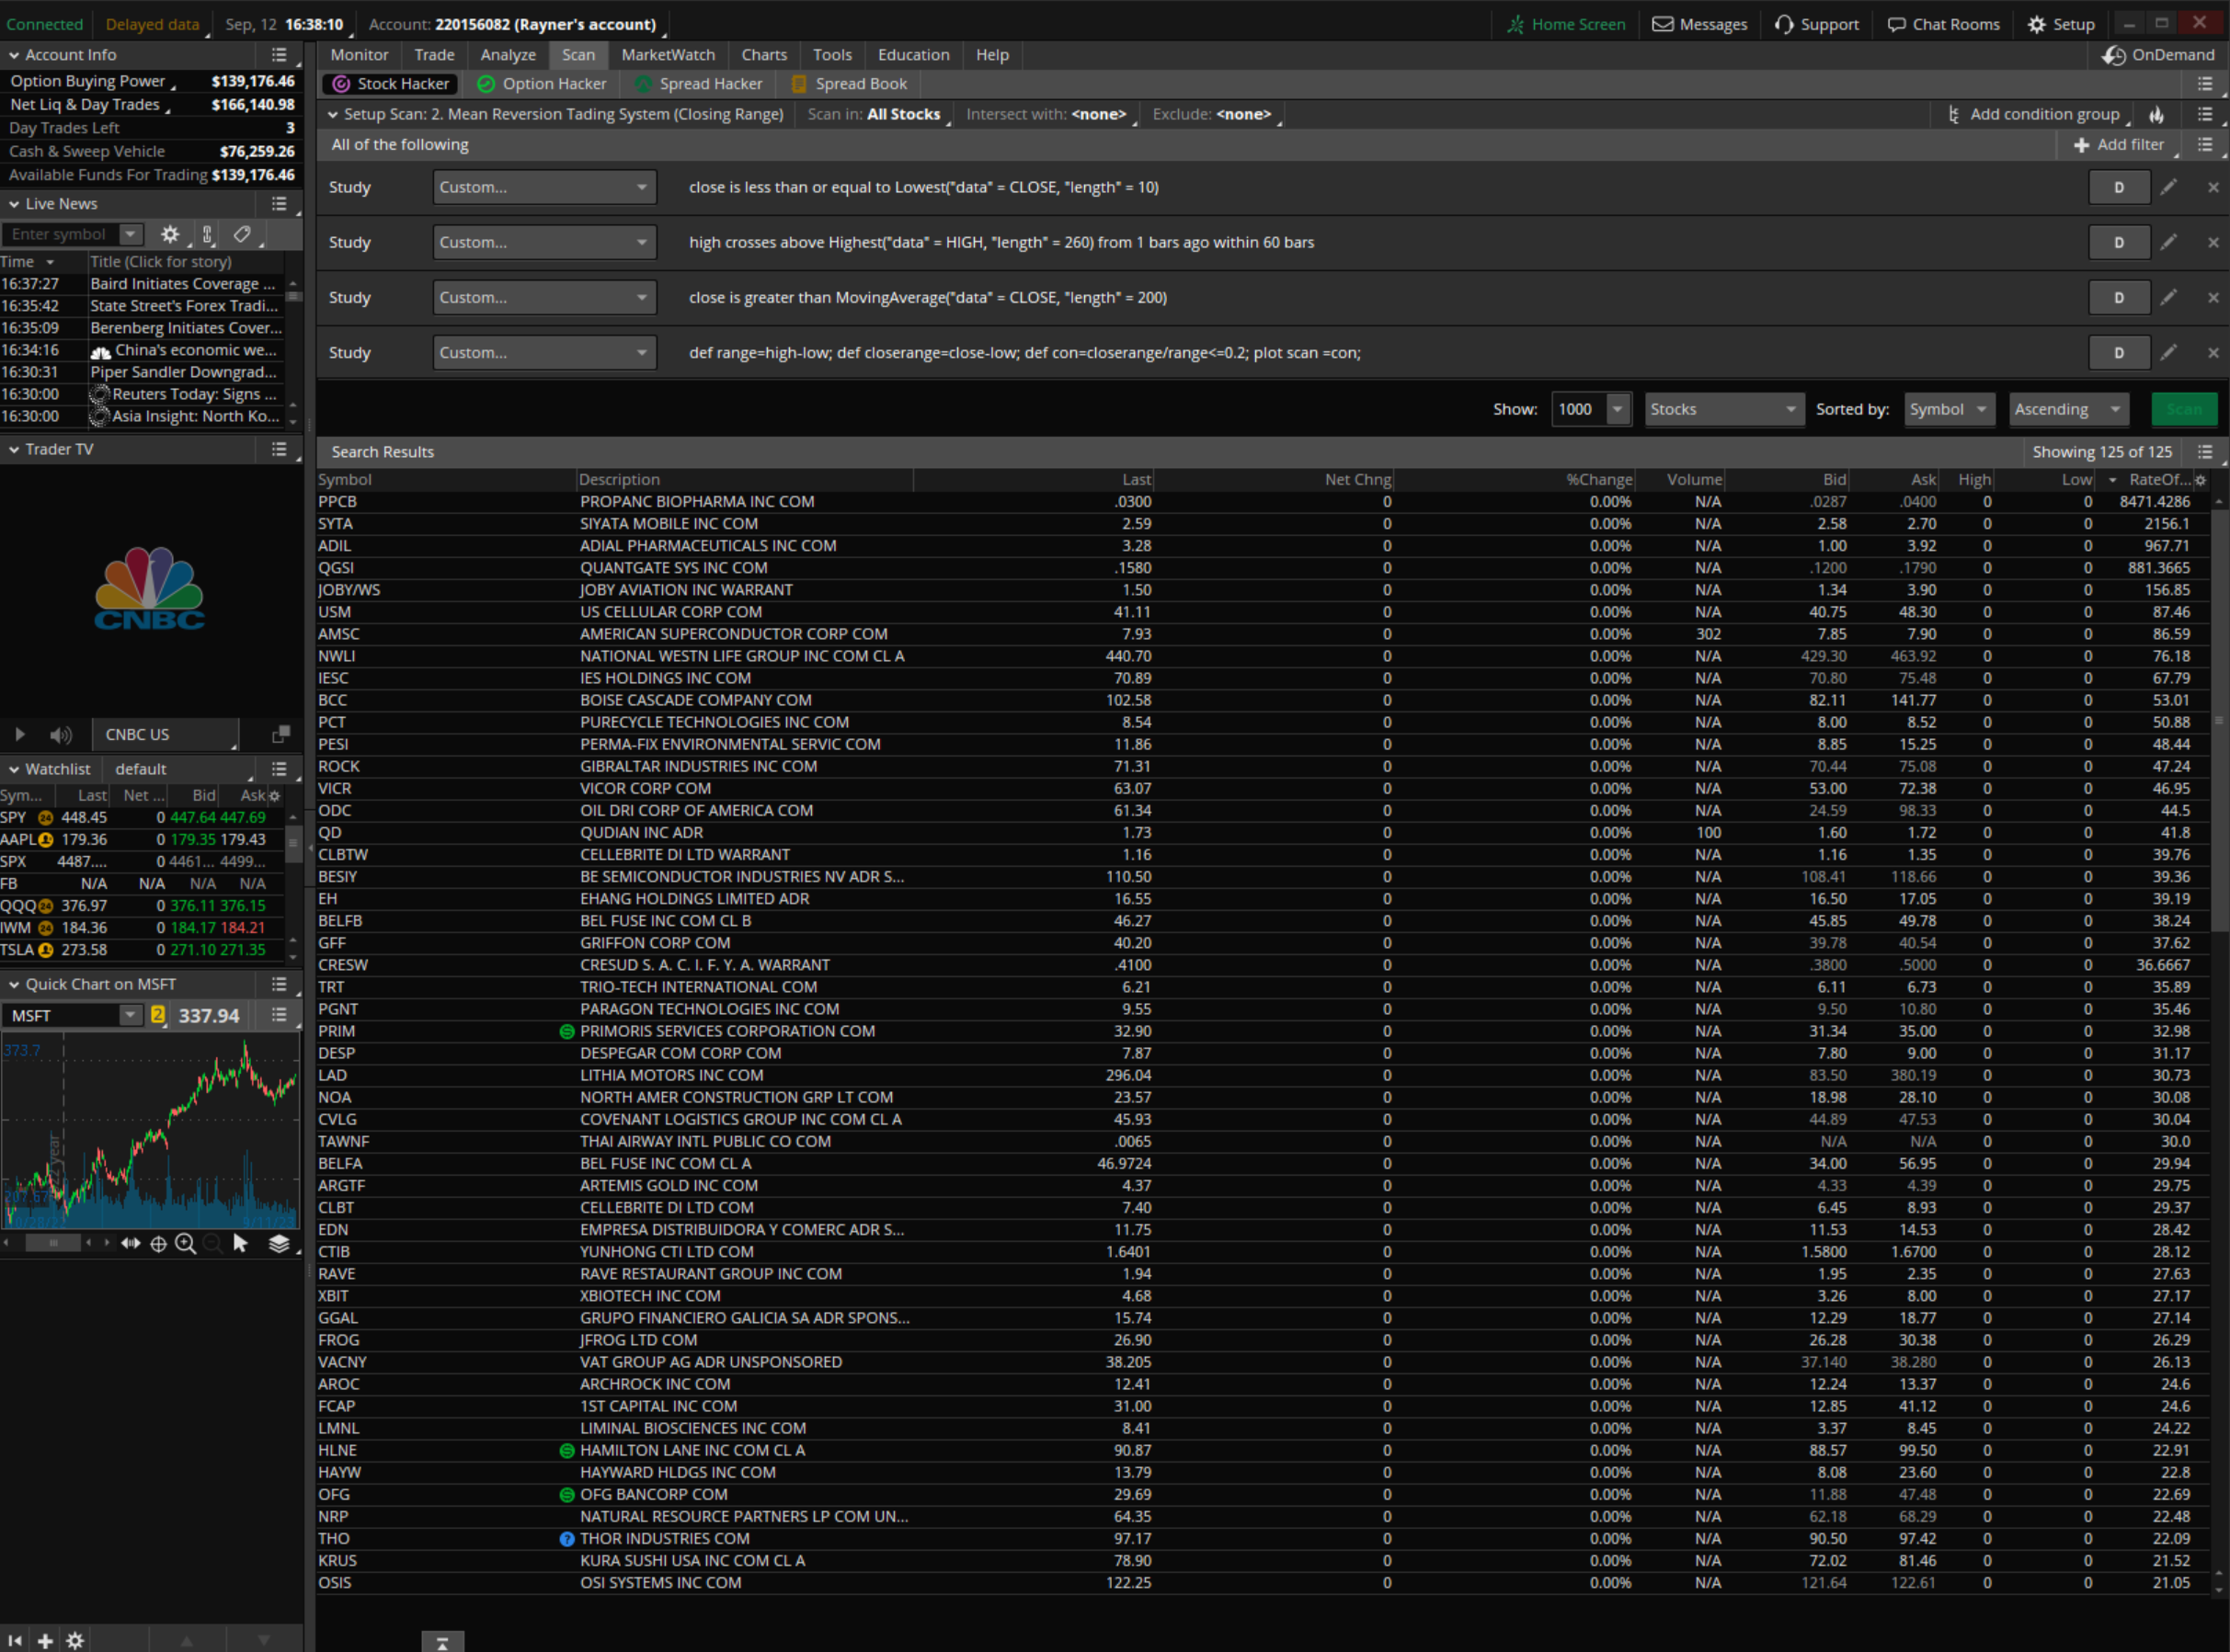
And here’s the thing, my friend…
While I’ll share with you a screener that you can take advantage of in your trading…
…I’ll make it as simple as possible – so you have a lot of flexibility to tweak it to your own!
Sound good?
Alright, so…
If you’re a trend follower, you can simply add a 200-day moving average to your filter…

And if you’re someone who trades pullbacks within the trend, you can also add an RSI (relative strength index) into the mix…

But, “why the RSI?”, you may ask…
Well, this is your secret sauce – looking for trending stocks that are making a pullback!
So, once you perform the scan on Russell 1000, look for trending stocks (200 MA) making a pullback (RSI).
You’ll see a couple of stocks on your results…
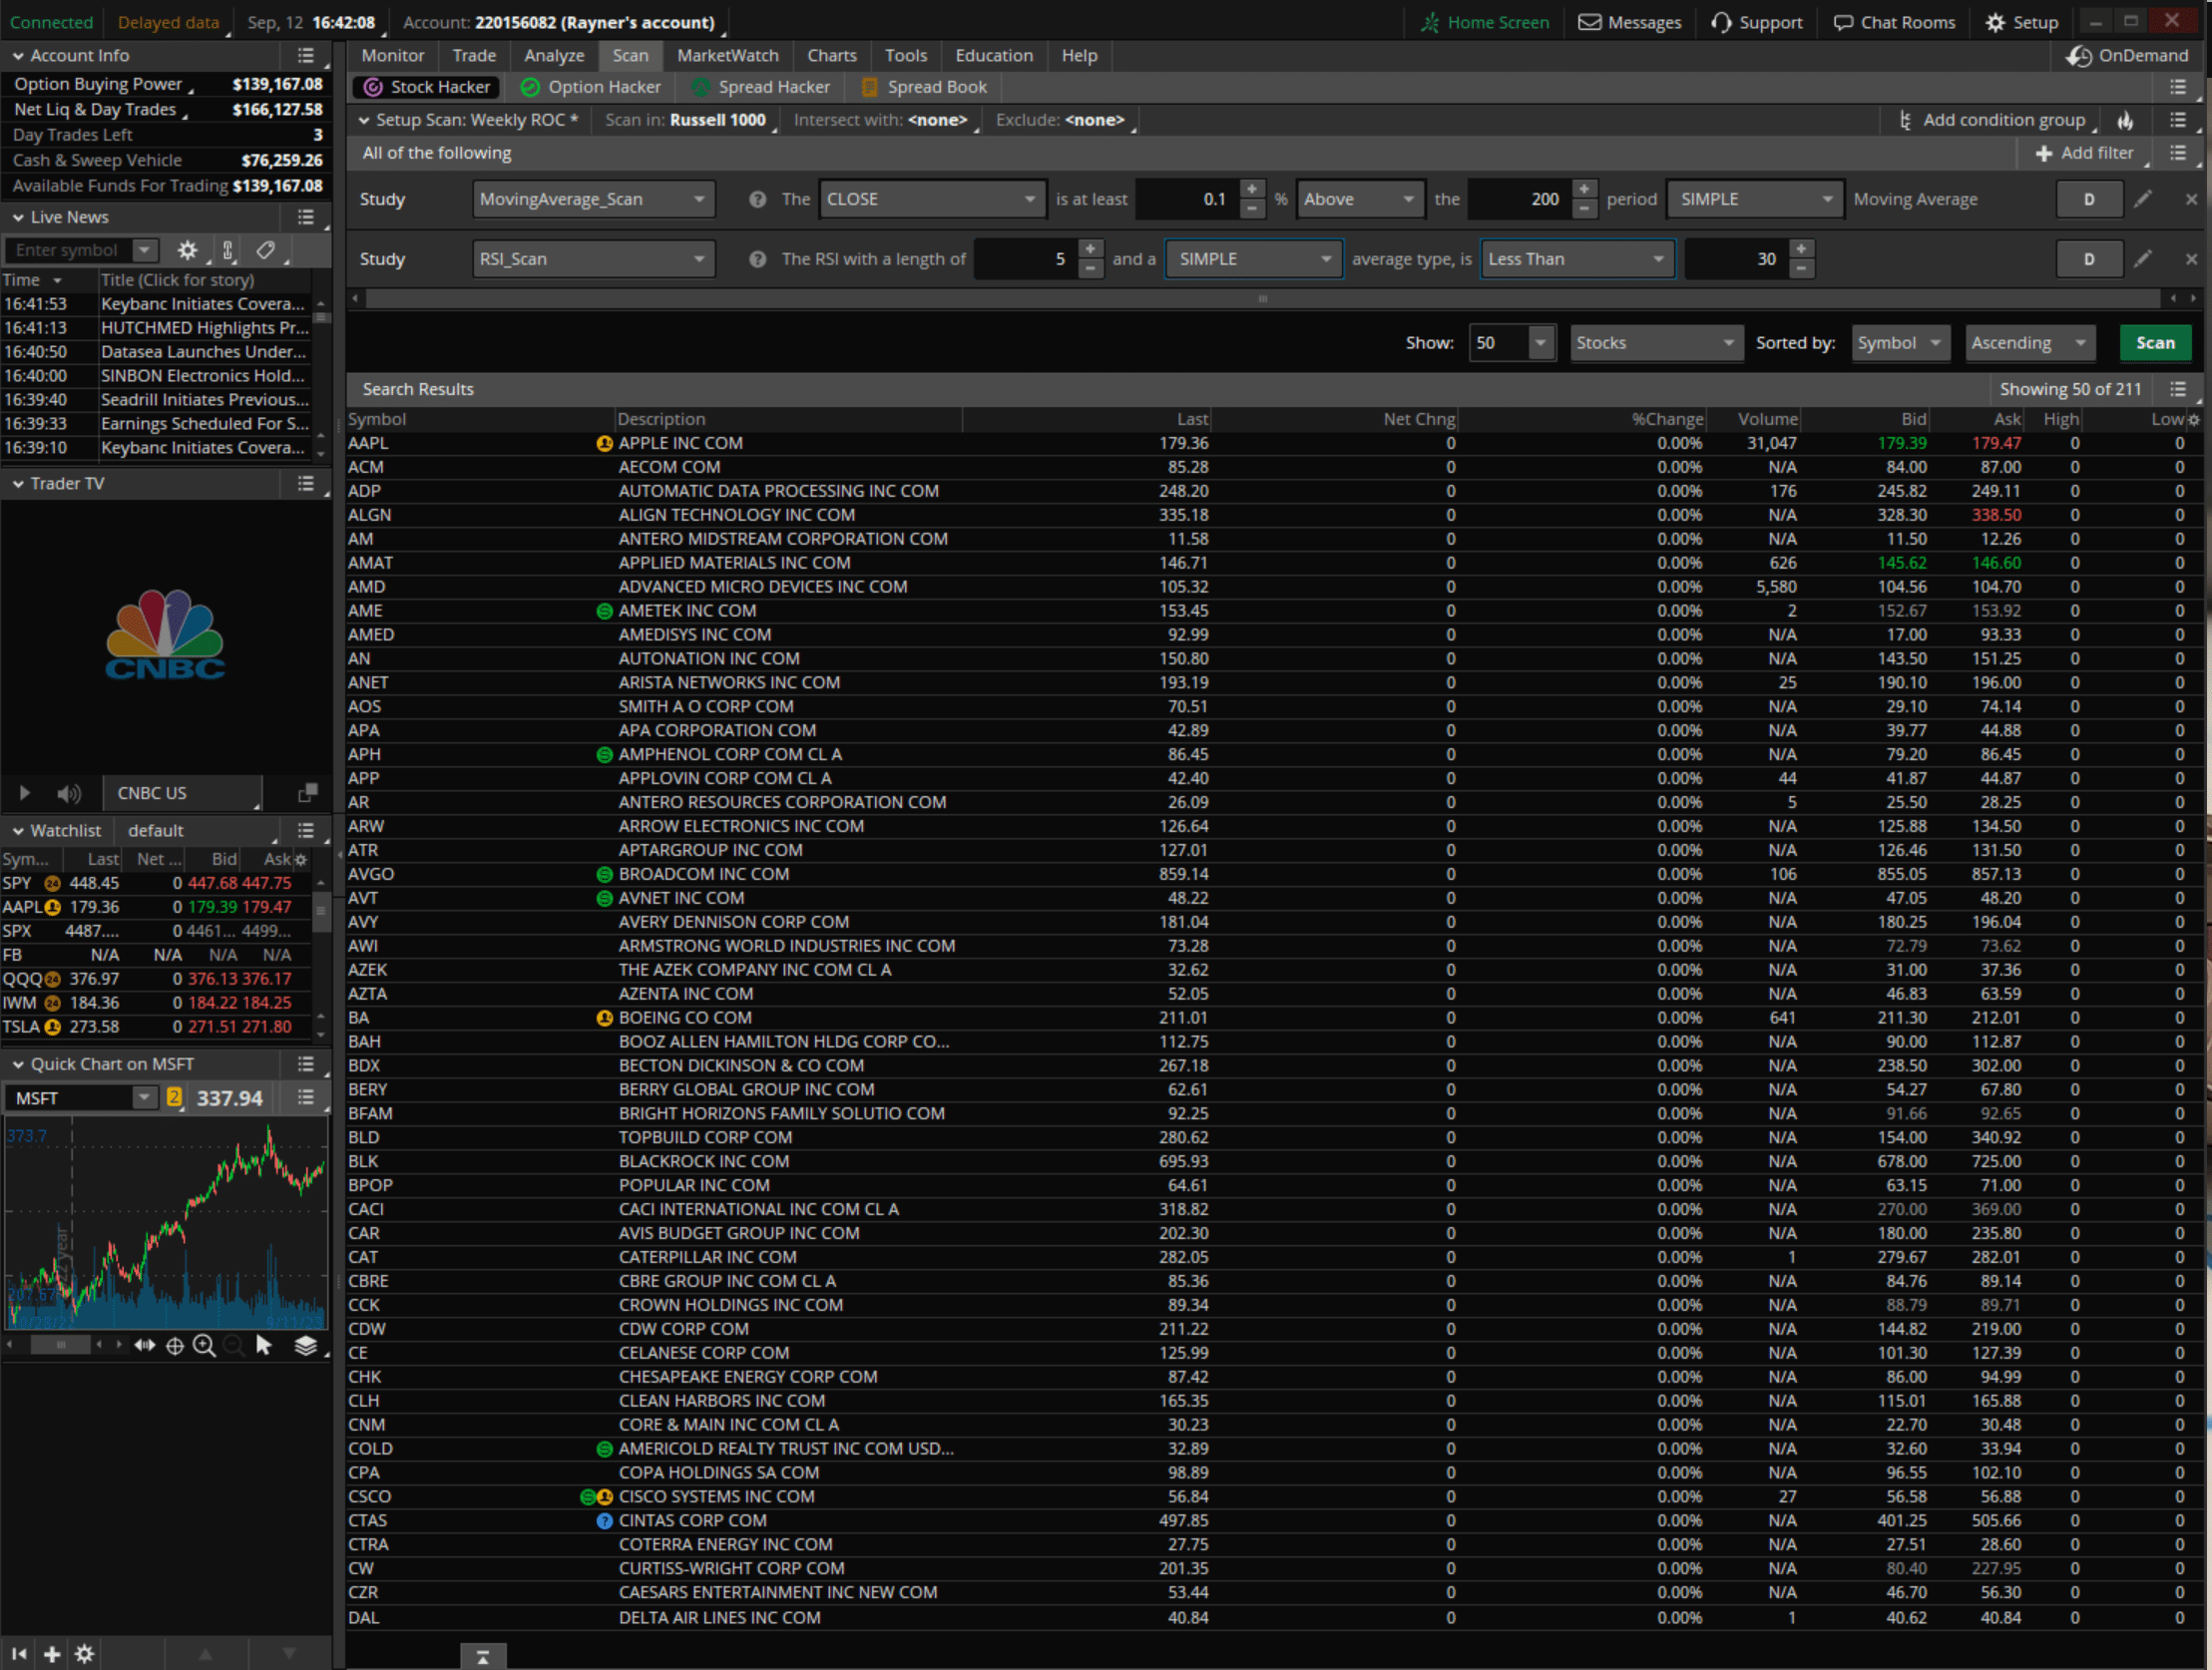
Again, depending on your trading methodology you can change the filter accordingly.
So – now you have them…
…what do you do with these stocks from your screener?
…which ones should you trade first?
I mean, you can’t trade them all, right?
This is where the ROC indicator chips into the mix.
Step #2: Add the ROC indicator to the filter results
Once you have the screener results…
You simply add the 50-week rate of change…
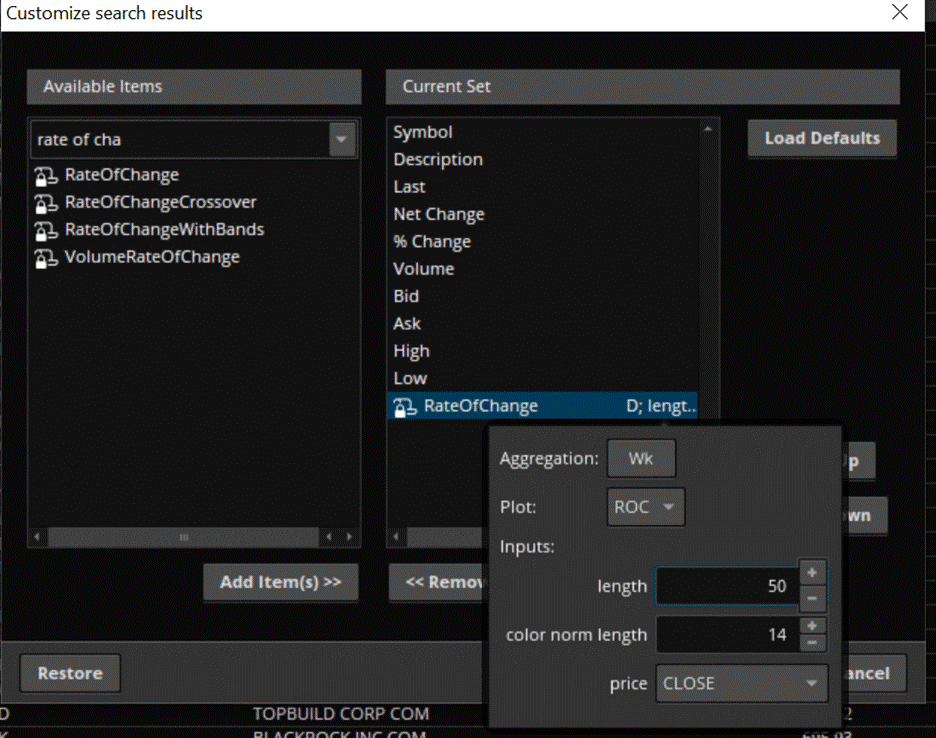
What this does is that it adds another “factor” or column from your scan results a while ago!…

And by the way…
I chose the 50-week ROC indicator period to measure the stock’s strength over one year of data (long-term strength)…
…but you are free to change it to 20 to 30-period to measure a stock’s medium-term strength.
What I mean is – there’s no “magic” number here.
…it’s simply whether you wish to determine long, short, or medium-term strength!
Got it?
So now you have the ROC indicator values showing up on your filter…
…what’s next?
Step #3: Rank the stocks with their ROC values accordingly (highest to lowest)
Once you have:
- Trend filters set that complements your trading style
- ROC indicator values showing on your screener results
The third step is to simply to rank those values from top to bottom…
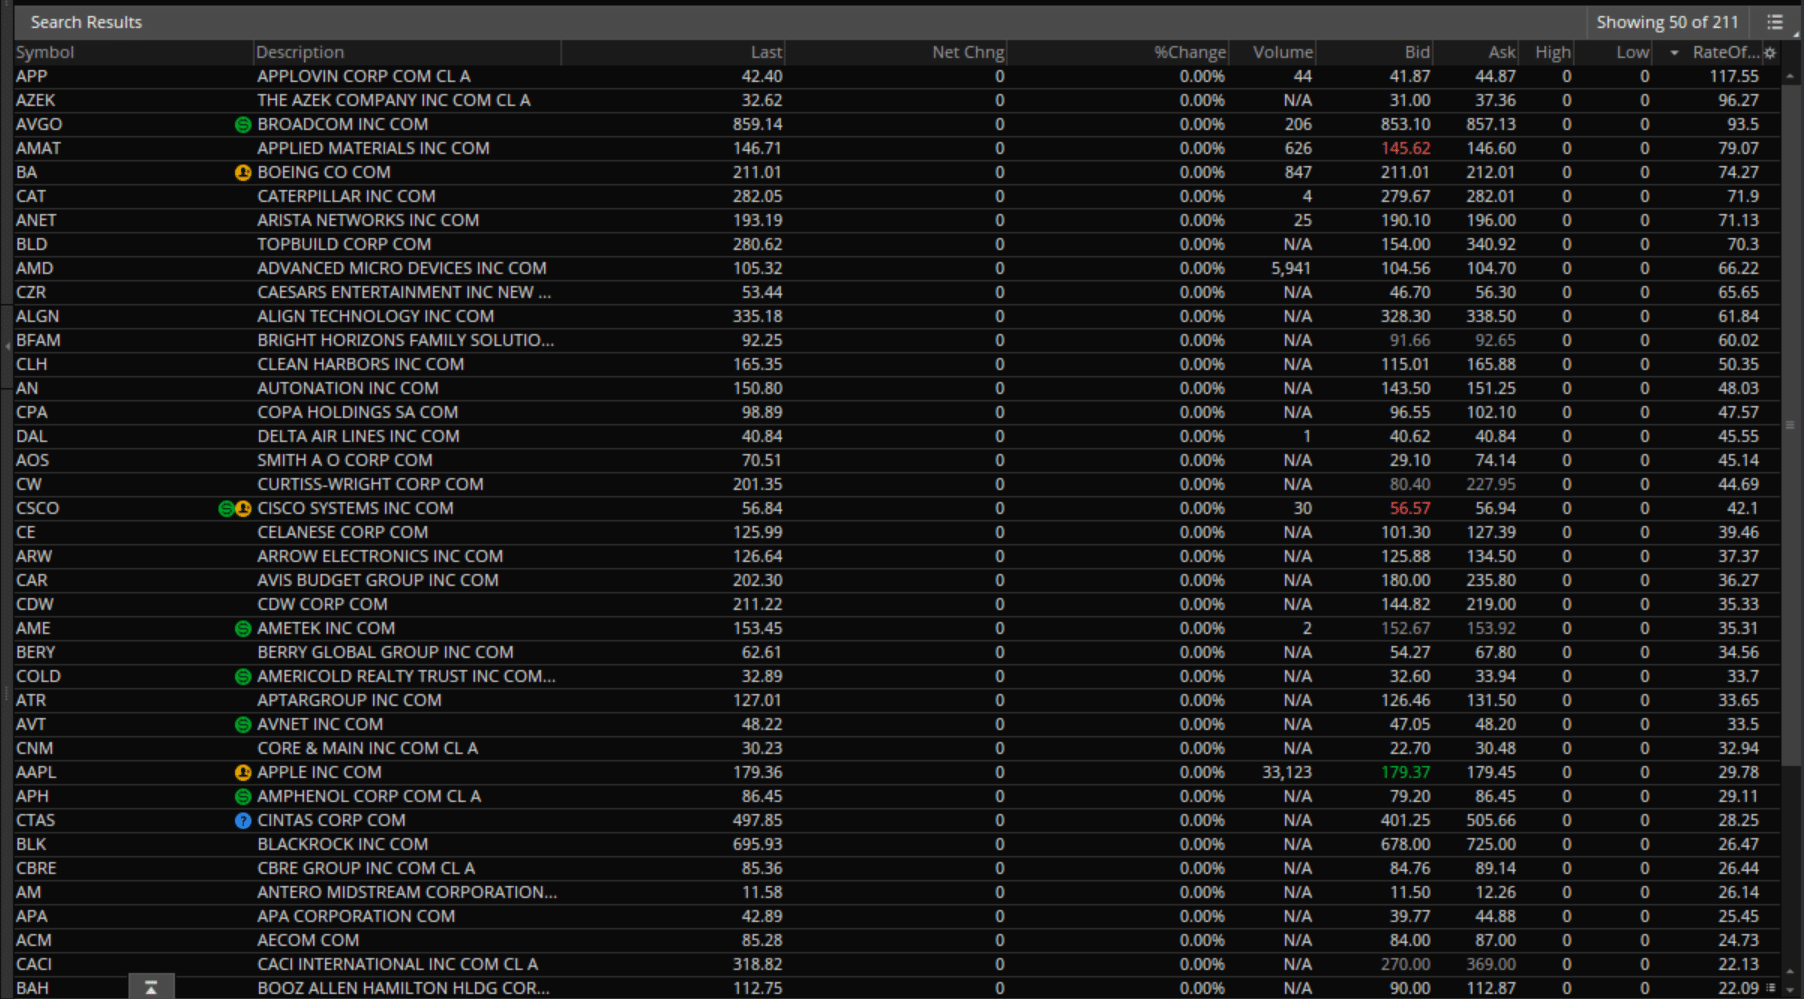
And prioritize entering the top stocks on the list!
So, If you allocate 10% of your portfolio on a stock which gives you a max of 10 open trades…
Then only pick the top 10…
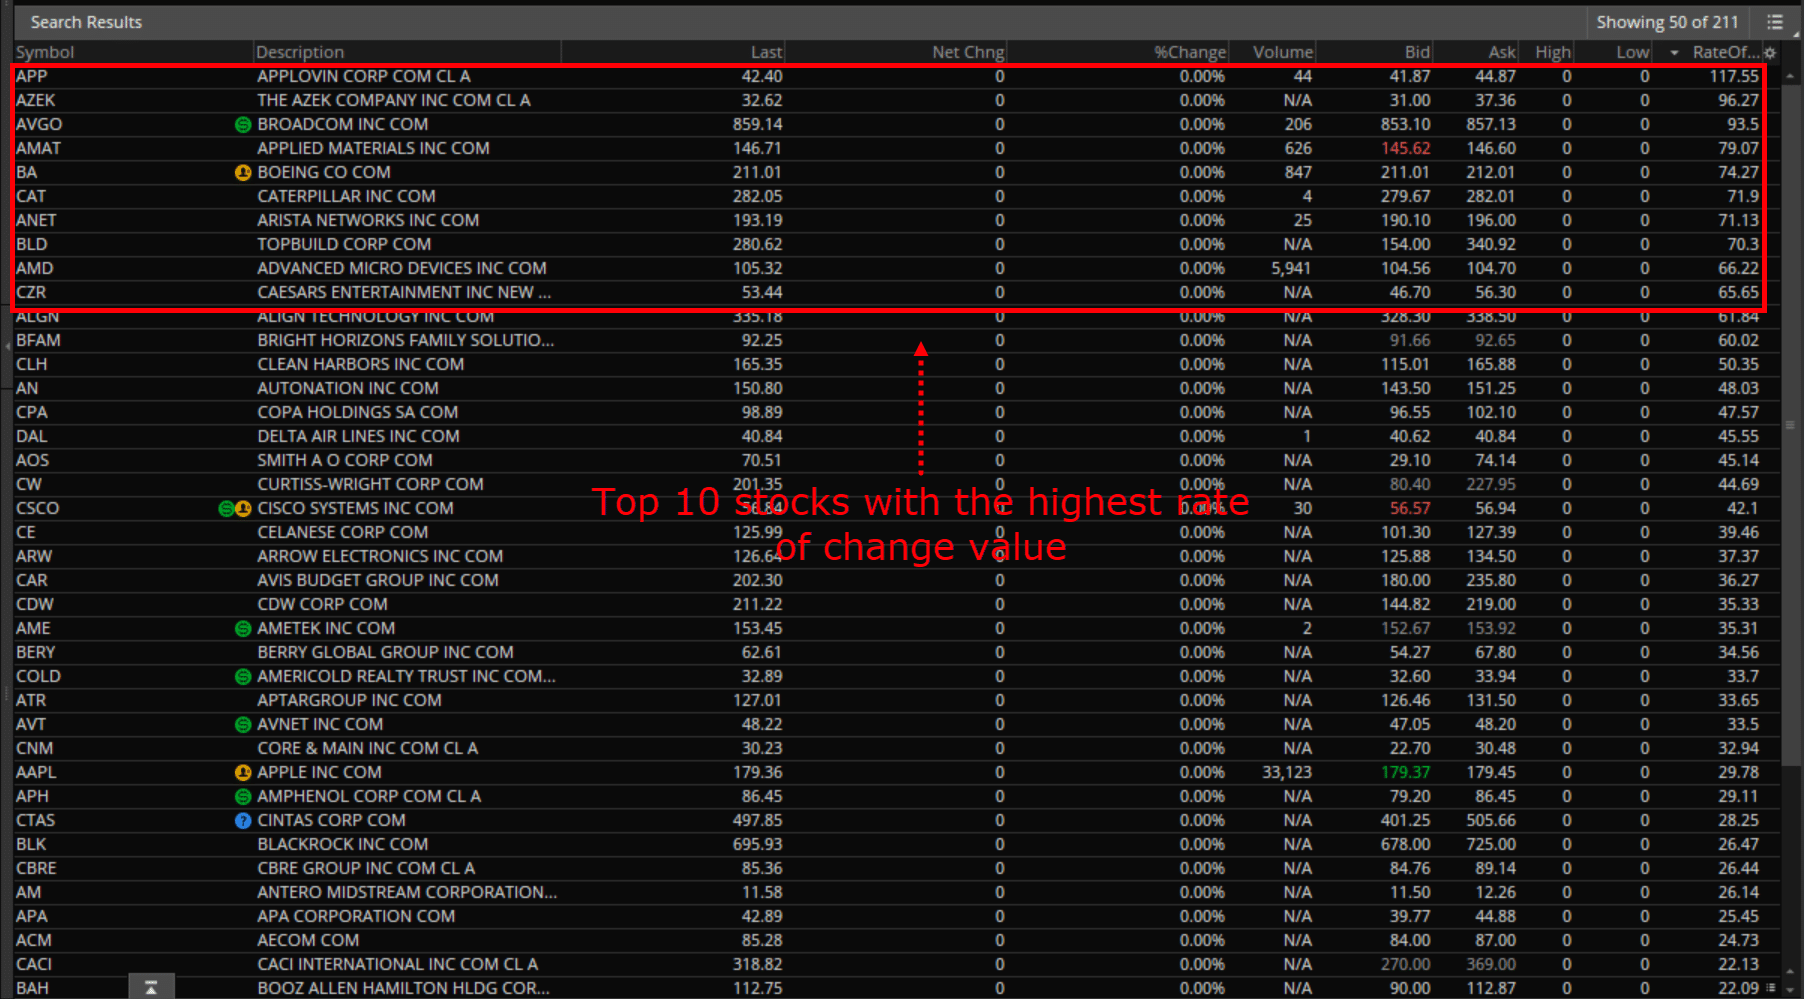
But if you already have 6 open trades, then only pick the top 4 on the list.
Make sense?
Here’s another thing to bear in mind…
I know these steps may seem like they would take you forever to execute.
But in reality?
…it’ll only take you less than 5 minutes once you’ve set up your screener!
It’s a small price to pay for consistently picking winning stocks to trade.
Alright, but…
…what if you don’t trade stocks?
What if you trade forex?
Do the same steps apply?
Well, unfortunately not with this setup…
…but it can be done another way!
Let me show you how to do it…
How to select forex pairs to trade with the ROC indicator
As you know…
There are thousands of stocks out there to trade…
But in the forex market?
…More or less a hundred pairs!
That’s way less than what you’re used to in the stock market, right?
But it’s also a chance for the ROC indicator to take the spotlight.
Instead of making a filter, you will be using the ROC indicator to make…
…a currency strength cheatsheet…
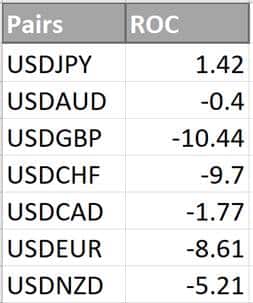
Step #1: Develop a currency strength cheatsheet
If you recall…
The main principle on why I make screeners is to look for strong stocks to trade.
But, how do you apply the same principle when trading the forex market?
Let me show you.
First, you retrieve the current 50-week ROC indicator values from these pairs:
- USDJPY
- UPDATED
- USDGBP
- USDCHF
- USDCAD
- USDEUR
- USDNZD
Yes – you read that right!
The USD pair must be the base currency for this.
Next, retrieve the values by pulling out an ROC indicator on your chart…

The values should look something like this after collecting all of them across the major pairs…

Now that you have this “cheat sheet”, what the heck do you do with it?
Step #2: Rank the ROC indicator values from top to bottom
Pretty obvious, right?
It’s the same thing I did just a little while ago!…
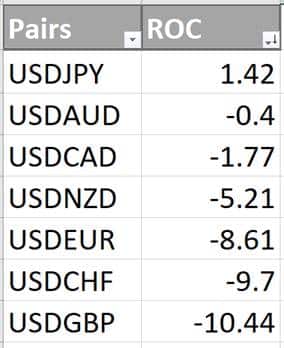
But there’s a twist here…
Step #3: Match the weakest and strongest currencies
This is what makes the forex market “the” forex market.
There are always two currencies to consider, not just one!
Now, if you look at the cheatsheet…
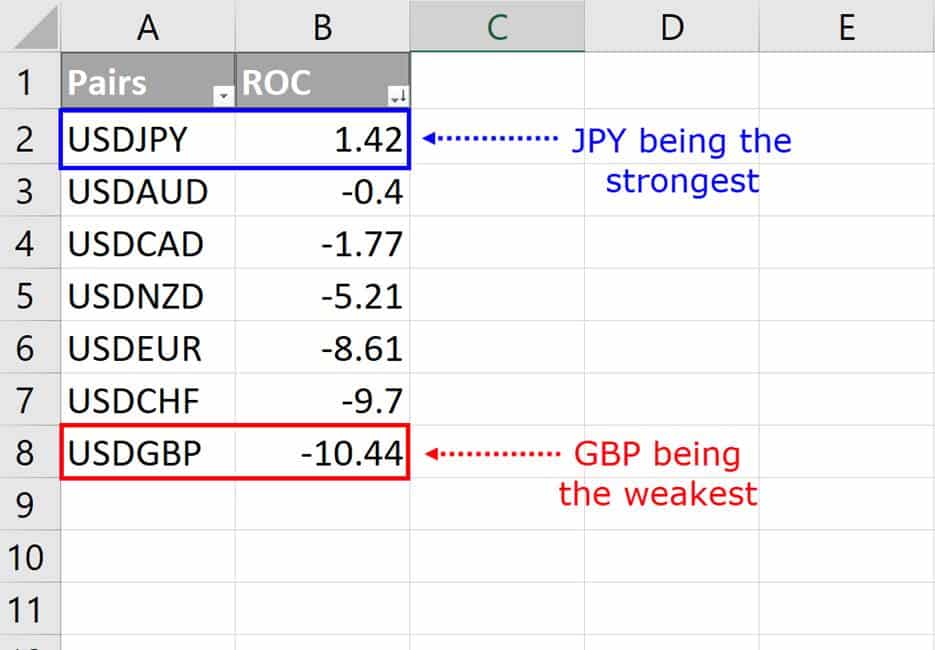
…you can see that the JPY is the strongest pair while GBP being the weakest pair.
(By the way, the USD is always 0 as it is the basis)
Knowing these, what do you do next?
You match them by adding GBPJPY to your watchlist!
Simple, right?
It’s almost the same thing as ranking stocks with the ROC indicator!
The best part is that you have flexibility over the ranking table, as you are free to cross-match other currencies…
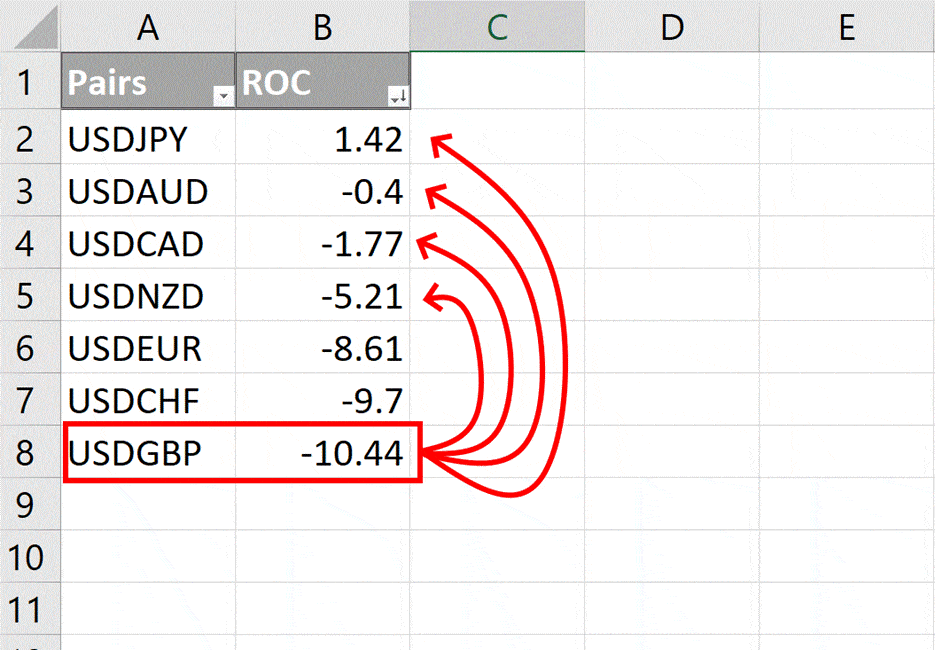
So, you can consider trading GBPNZD, GBPCAD, GBPAUD, GBPJPY, and so on – for other currencies as well.
That’s all there is to it!
It’s a consistent method to select forex pairs to trade – using the ROC indicator!
Oh – and yes, those ROC values do change…
So, I suggest you refresh your watchlist every week!
Now…
I know that I shared with you how to use the ROC indicator as a market selection tool for the stock and forex markets.
But still…
It doesn’t change the fact that it’s just “one of those” indicator lines on your chart!
So, to make this tool stand out in your arsenal…
I’ll perform a historical backtest to find out whether or not this tool works.
Ready?
Then let’s get started…
The ROC indicator: Does it work?
For this test…
I’ll be using a mean reversion trading strategy with these rules:
- The stock must be above the 200-period moving average
- The stock must be below 2-period RSI 30
- If the stock closes above RSI 30 enter at the next candle open
- Exit the stock if it closes above 2-period RSI 50
- Allocate a max of 20% per stock (max 5 open trades)
All clear?
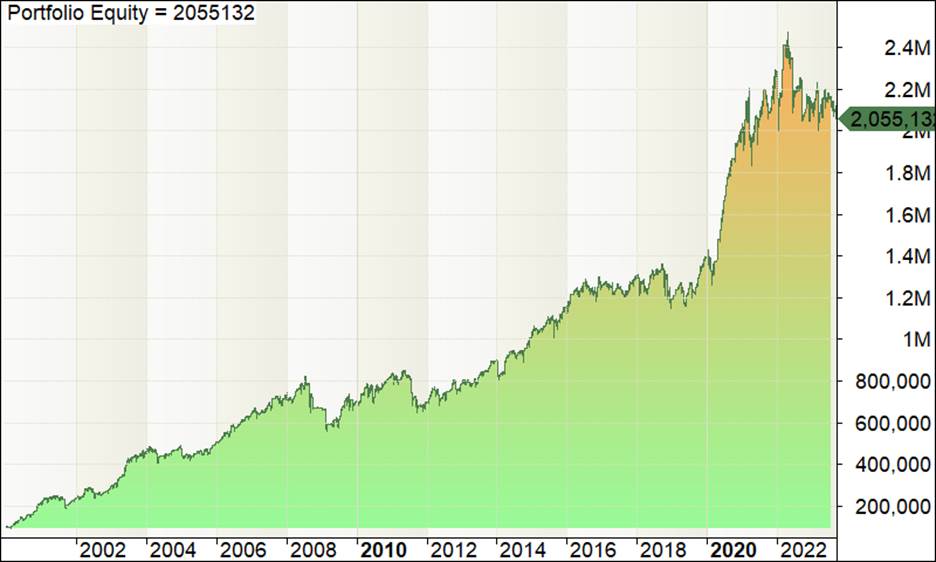
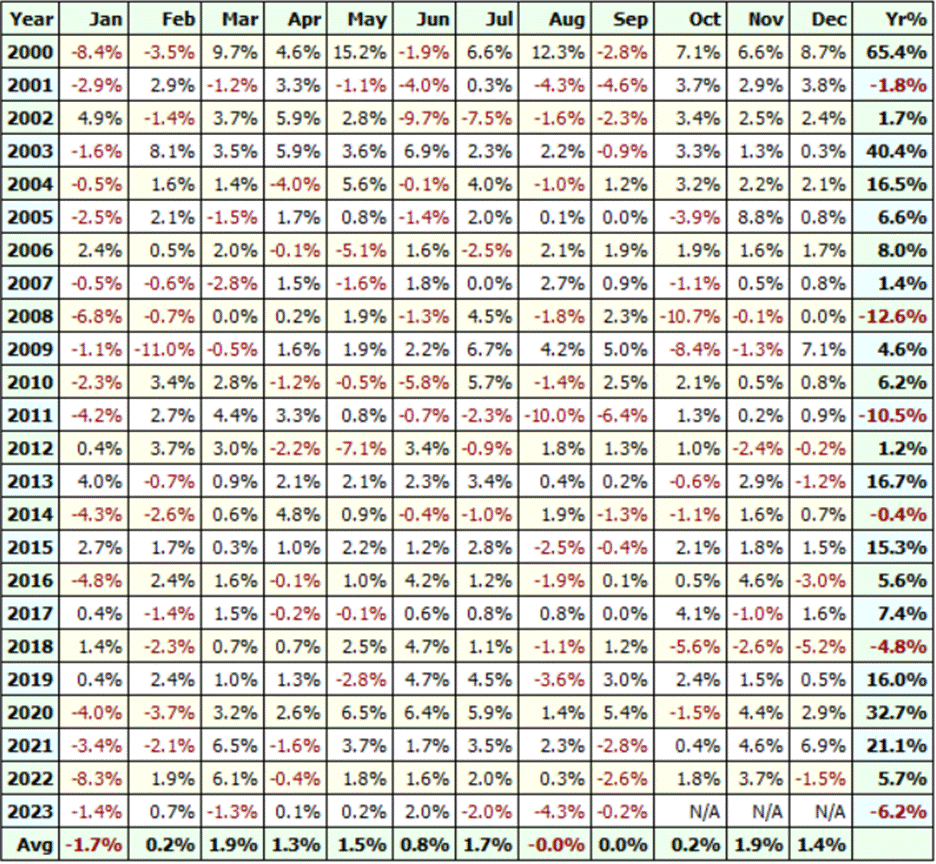
Well, after performing a 20-year backtest with the Russell 1000 stock market universe…
Here’s how it performed:
- Av annual return: 8.81%
- Max drawdown: -27.77%
- Win rate: 61%
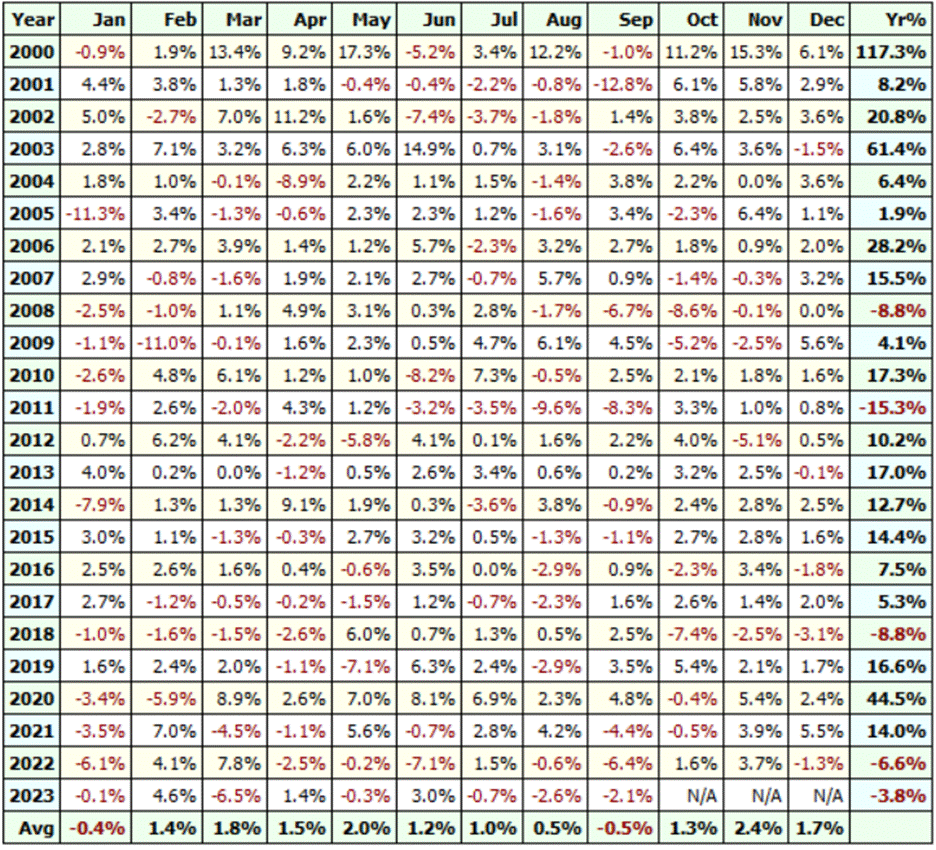
Now what if you add a 100-day ROC indicator filter into the mix where you rank stocks and prioritize trading them?
- annual return: 13.59%
- Max drawdown: -31.86%
- Win rate:10%

Pretty impressive, right?
Without changing the rules of the strategy, the performance of the system has increased!
I simply added a portfolio management rule with the ROC indicator!
Can you see how important this is?
So, the next time you encounter a losing streak…
…the last thing you’d want to do is mess with your strategy…
Now at this point, I’m sure you already noticed that I tried to make this guide as practical as possible…
…revealing as many secrets as I could.
But always remember…
…testing the ROC indicator first is crucial before putting your hard-earned money on the line.
Right! Let’s do a quick recap…
Conclusion
The ROC indicator can easily be a “free upgrade” to your existing trading strategy.
It’s a flexible indicator that is a great addition to any trading plan.
So, even if you already have a ton of indicators on your chart,
You can keep them there and use the ROC indicator to help you navigate where the “big fishes” are in this vast sea of markets to trade.
Nonetheless, here’s what you’ve learned for today’s guide:
- The ROC indicator measures how strong or weak a market is, by simply comparing the current price with the previous prices (the higher or lower the values are, the better)
- The rate of change indicator can easily be used to trade the stock markets, by ranking your screener results based on its results
- Creating a currency strength meter that’s based on the ROC indicator is a must, to determine the strongest and the weakest currencies to pair and trade
- A backtest result that shows how the ROC indicator can improve your results, without even changing your existing strategy
And there you go, my friend!
A complete (no bars held) guide to using and trading with the ROC indicator!
So, here’s what I want to know…
Have you been expecting this guide for a while after hearing this indicator multiple times on videos?
Will you consider using the ROC indicator in your strategy after today’s guide?
Let me know in the comments below!


