Have you ever come across the mysterious Gravestone Doji?
What’s a candlestick with such a scary name doing on your chart?!
Well, fear not! I am about to reveal the secrets of the ominous Gravestone Doji…
In this article, you’ll…
- Learn exactly what the gravestone doji is, and how it can transform your trading game.
- Delve into the captivating process of how the Gravestone Doji emerges and captures the market’s mood.
- Discover the striking differences that make the Gravestone Doji a unique and powerful player among rejection candlesticks.
- Explore the secrets of trading this pattern to seize opportunities in the financial markets on both the long and short side!
- Uncover the limitations that come with using the Gravestone Doji, and how to navigate them in your trading journey.
Ready for an enlightening journey?
Great, let’s dive in!
Understanding the Gravestone Doji
The Gravestone Doji, a candlestick pattern commonly used to identify reversals in uptrending markets, has a few faces – and can show a few different variations in appearance…
However, when specific criteria are met, this candlestick formation becomes a reliable indicator of a momentum shift in the market!
One of the key applications of the Gravestone Doji is to signal when an uptrend is losing momentum…
It suggests that sellers have entered the market with the intent to potentially stall price movement and potentially reverse the price at crucial levels.
It’s also important to note that the Gravestone Doji is the counterpart of the Dragonfly Doji, which is typically found at the bottom of a downtrend.
The Gravestone Doji derives its name from its shape, but I also like to interpret it as the market’s way of conveying that the current uptrend has come to an end!
Rest in peace, uptrend!
Now let’s discuss how the gravestone Doji forms…
How the Gravestone Doji Forms
I’ll delve into how the Gravestone Doji forms, using a hypothetical example where all events transpire within a single candlestick…
As the price approaches a significant area, such as a resistance level, it initially forms a strong-looking bullish candle.
This candle indicates that buyers are in control, pushing the price higher.
However, before the candle closes, a shift in market dynamics occurs…

Bears step in and regain control, causing a sudden price decline!
This reversal erases the gains made by the bullish candle and retraces the price back to the opening level.
It’s in this single candlestick that the gravestone doji pattern takes shape.
It appears as a candlestick with a small body and an extended upper wick, representing the high price reached during the session…
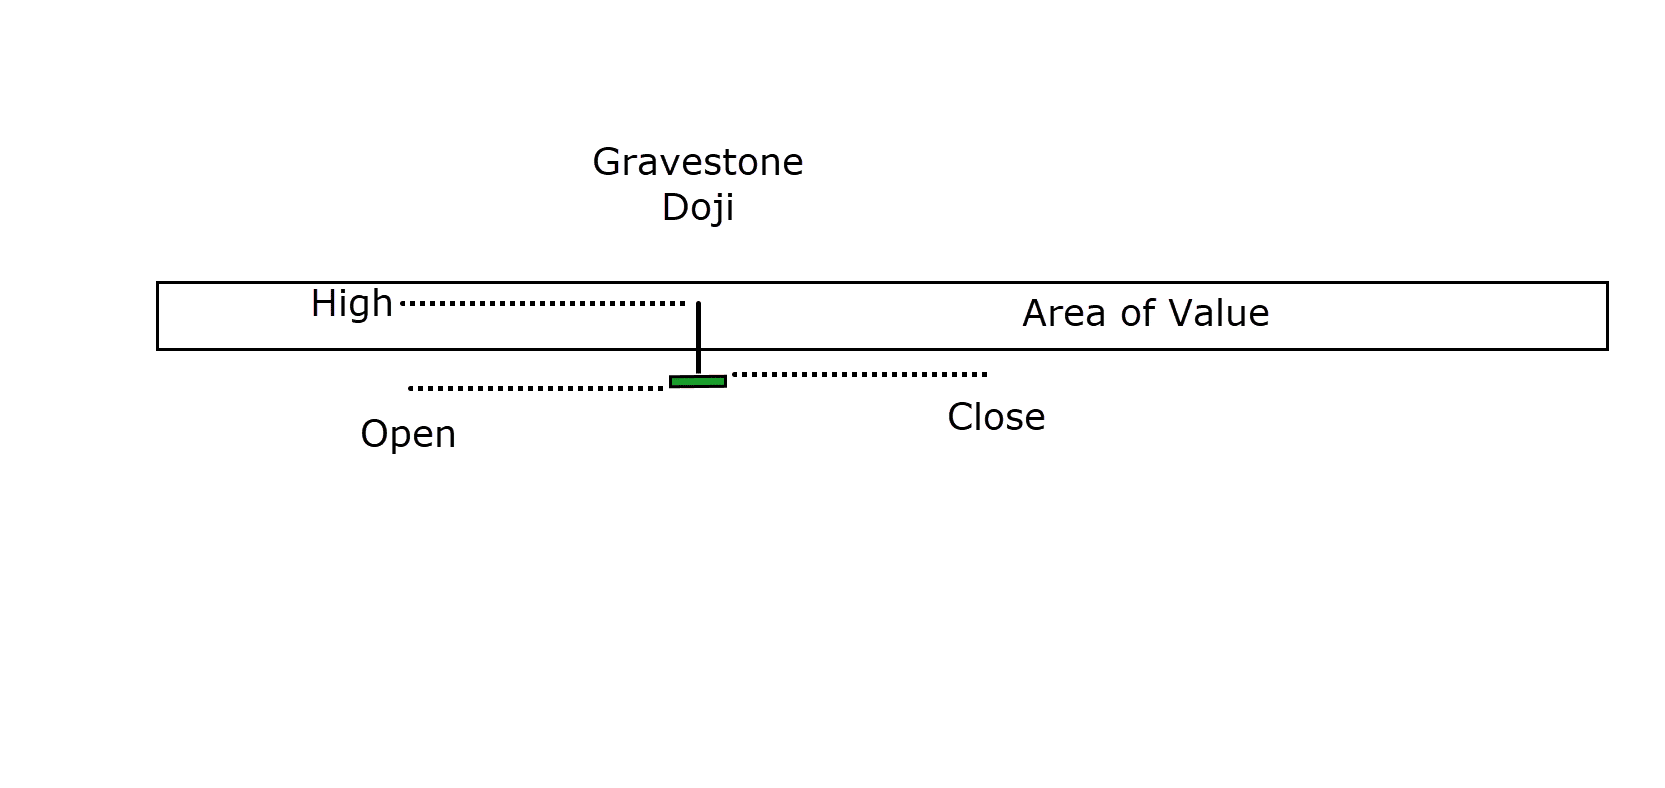
The opening and closing prices of the candle are nearly identical, signifying the bearish pressure that countered the initial bullish momentum.
If all these events occur within one candlestick, the resulting pattern resembles the classic Gravestone Doji, and it indicates a potential reversal in the uptrend.
So, the Gravestone Doji is basically a visual representation of the tug of war between bulls and bears at a key level… suggesting that bearish forces may be gaining strength!
But is there anything else that makes it stand out?…
Comparing the Gravestone Doji to Other Rejection Candlesticks
Now, you might be wondering if the Gravestone Doji is essentially the same as the Shooting Star or Inverse Hammer formations…
Some traders tend to categorize them as similar, and indeed, they can produce similar signals in the market.
However, the significant distinction between the Gravestone Doji and the others is that the Gravestone Doji has minimal to no body, and the opening and closing prices are very close to each other.
This unique feature sets it apart from the inverse hammer or shooting star.
But what signals are going to lead us there?…
Interpreting the Gravestone Doji’s Market Signals
The Gravestone Doji candlestick represents a scenario where buyers initially attempted to push the market higher during the session.
However, during that time, selling pressure overwhelmed the buyers, and the price retraced back to roughly the opening level before the candle’s close!
This occurrence clearly indicates to traders that there is a significant seller barrier at the price point that the session aimed to breach.
It’s essential to note that the longer the wick on the Gravestone Doji, the more potent the selling signal becomes.
If the upper wick is substantial, it means that regardless of the buyers’ efforts to push the price higher, a lot of sellers were waiting for them!
In this way, it shows a pronounced shift in momentum from the bulls to the bears.
Let’s look at this diagram to explain…

In the first example, the bulls manage to push the price slightly higher within the session, only to encounter serious selling pressure that pushes the price back down to the opening level within the same candle…
This situation shows a certain level of rejection, which means that the bears have successfully resisted the buying pressure from the bulls, which is shown by the smaller wick doji.
Now, consider the second example, where the bulls enter the market with major force, pushing the price significantly higher, with a large green momentum candle!
What makes this second scenario more interesting is that within the same candle period, the bears refuse to yield even the strongest buying momentum.
Instead, they aggressively drive the price back down to the candle’s opening level, forming the long-wick Gravestone Doji.
This example shows how a longer wick shows that the bears are more determined to fight off the bullish advance and keep prices stable!
OK, ok, you get what it looks like… so what can you do with it?…
Trading the Gravestone Doji
Let’s examine an example of a trade based on the Gravestone Doji forming at a key resistance level…
AUD/USD 1 Hour Chart:
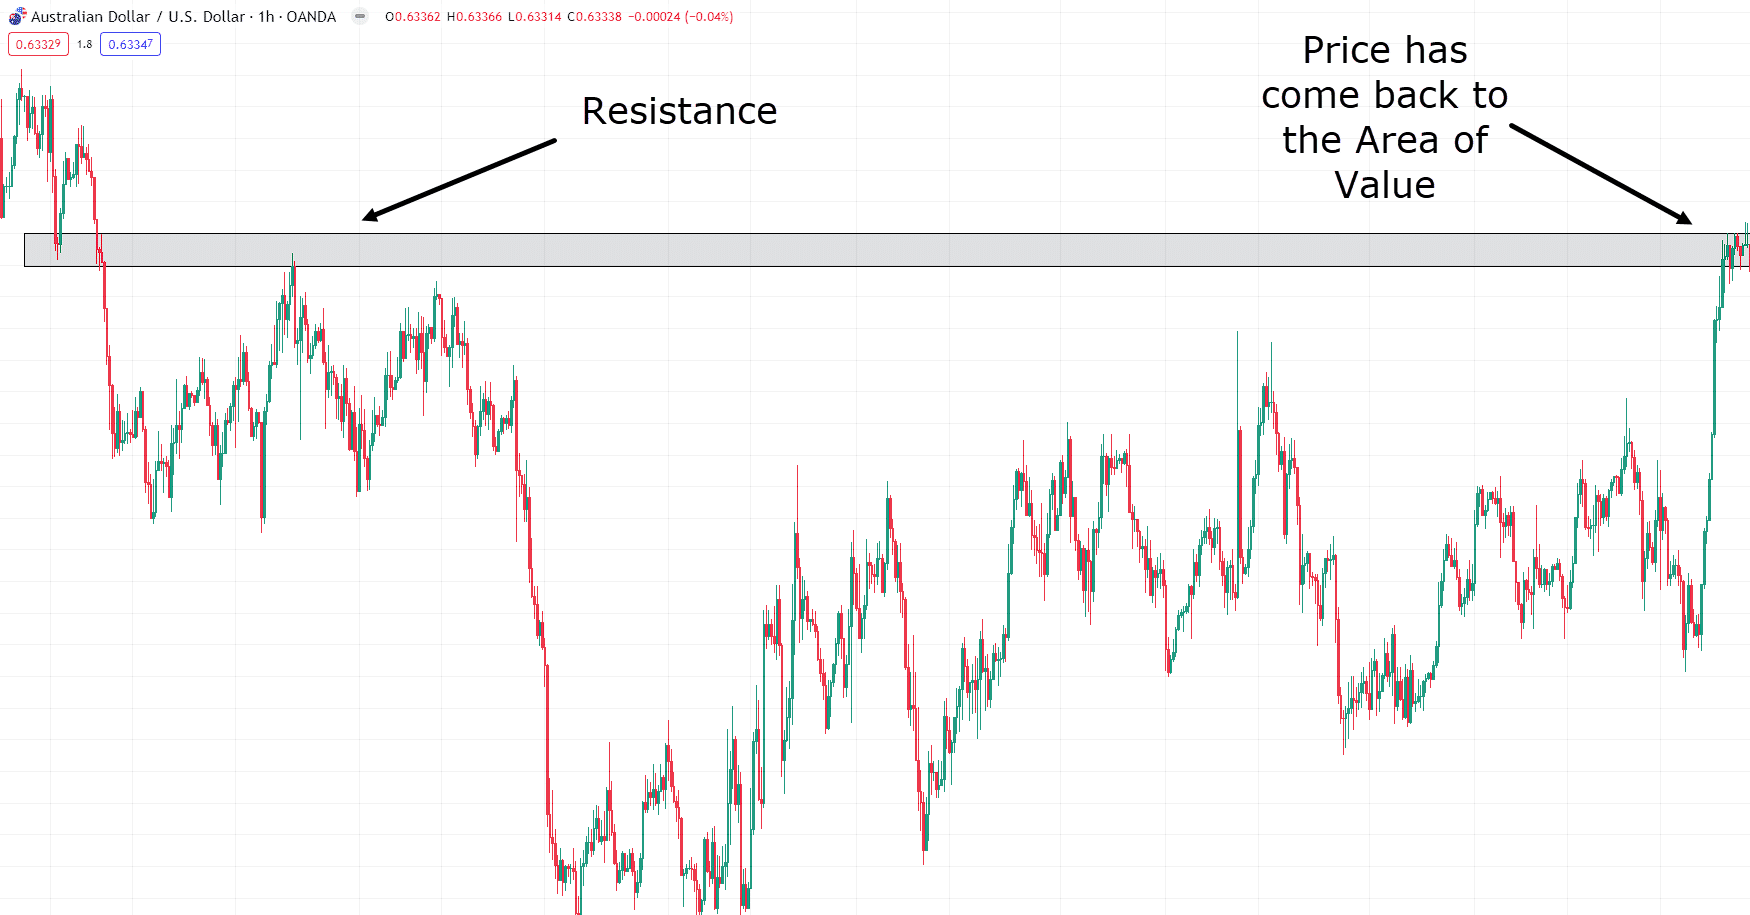
As shown in the chart above, the price has returned to a significant area of resistance. This level previously acted as support and, once broken, transformed into resistance.
To get a closer look at what’s happening in this zone, let’s zoom in…
AUD/USD 1 Hour Chart:
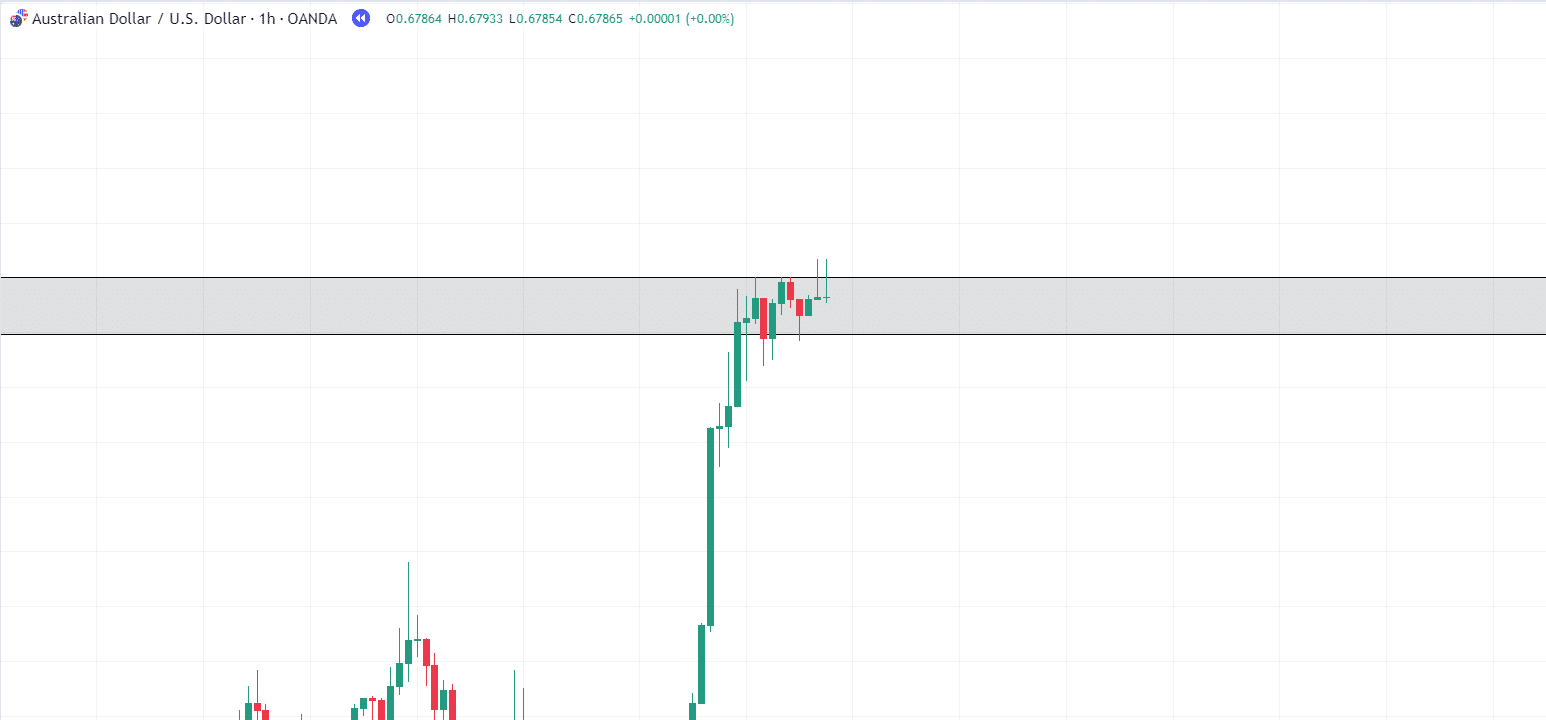
Here, you can see that the price has paused at the resistance zone following a strong upward move.
What’s interesting is the formation of not one but two Gravestone Doji patterns at this critical resistance level!
Now, you might be tempted to initiate a sell right away, but it’s wiser to find confirmation that the price isn’t merely stalling before a potential upward continuation….
In such cases, waiting for the next candle provides additional confirmation of the bearish momentum!…
AUD/USD 1 Hour Chart:
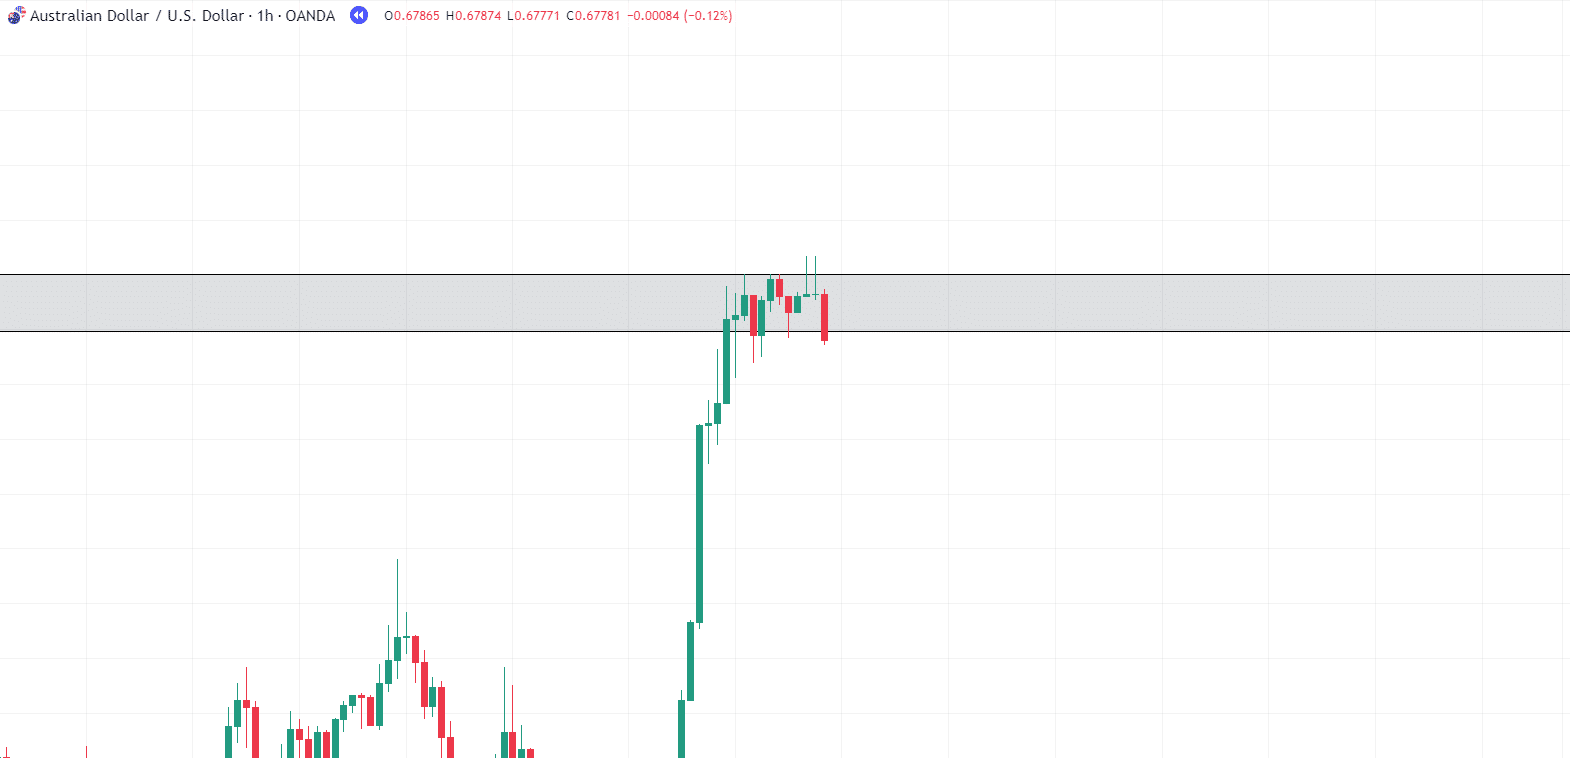
And look! The next candle confirms the initial theory of a possible trend reversal at this resistance point.
Alright, to recap the evidence for our trade:
- Price revisits a resistance zone.
- It stalls and forms the Gravestone Doji pattern, not once but twice.
- A robust bearish candle propels the price below the resistance zone, confirming bearish momentum.
And now, let’s take the trade!
AUD/USD 1 Hour Take Profit #1:
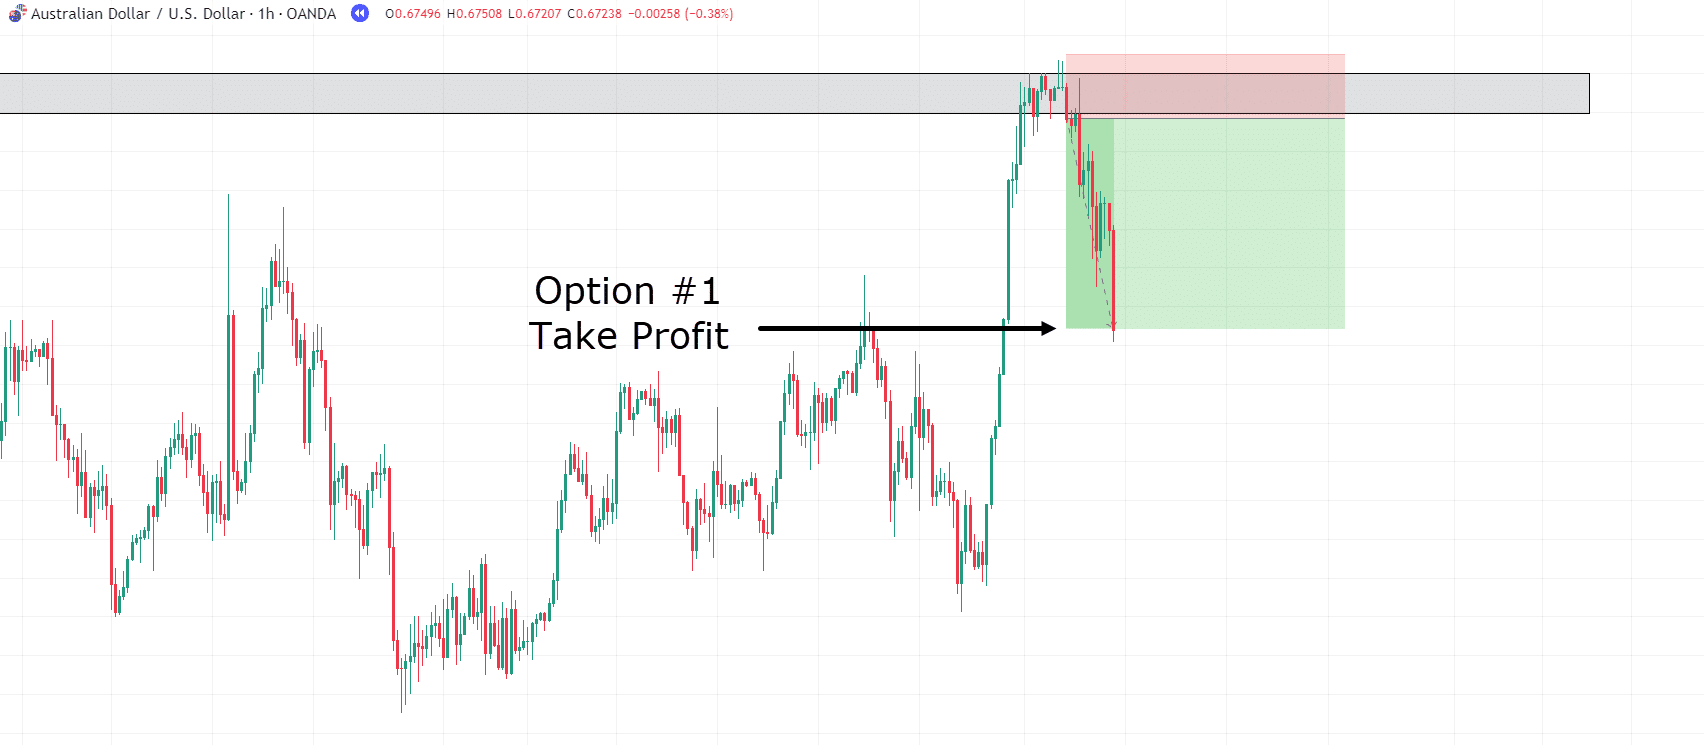
A reasonable initial target for your take profits would be the previous high swing, under the assumption that the old resistance may act as a new support level.
This approach would yield a 3RR!
But what if you aimed for the previous low?…
AUD/USD 1 Hour Take Profit #2:
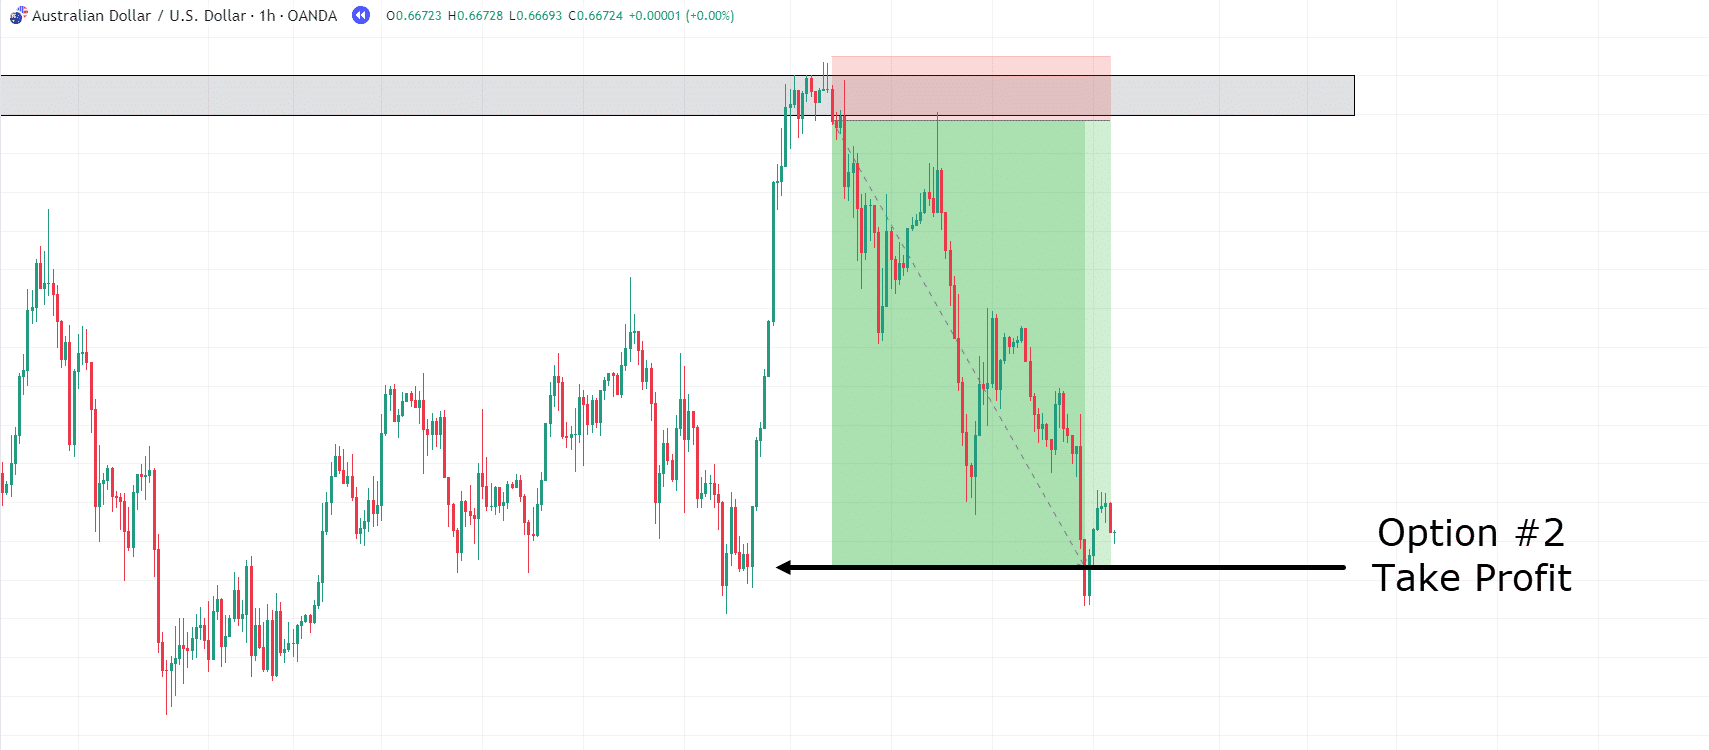
Even though the price initially went back to where it was at the entry point and changed, it eventually moved towards the previous low.
In this scenario, the trade would have yielded an even more impressive (7RR)!
Now, it’s essential to understand that such high-reward trades are rare.
Bear in mind that achieving anything close to a 7RR trade demands practice, patience, and an acceptance of multiple losses along the way…
You can witness the power of using the Gravestone Doji in combination with simple technical analysis techniques.
This trade example shows how the Gravestone Doji can be used to help traders make smart choices, taking advantage of the key moments when bears gain momentum at key resistance levels.
So, you know what to do going in… but what about getting out?…
Exiting Trades with the Gravestone Doji
It’s crucial to understand that the Gravestone Doji isn’t solely a tool for initiating short sells.
This candlestick pattern can also serve as a valuable indicator for exiting a long position!
Let’s delve into an example to illustrate this concept…
USD/JPY 1 Hour Chart:
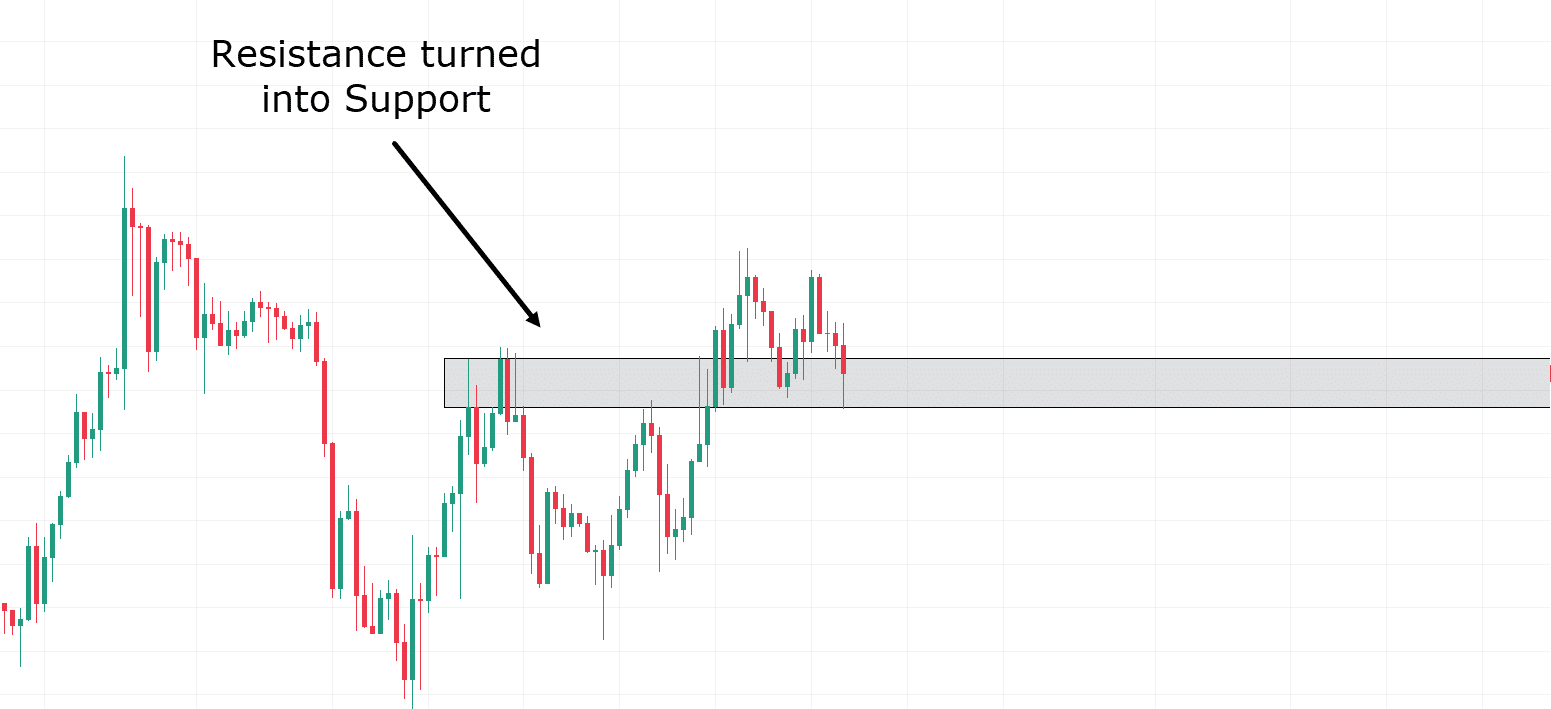
In this case, you have a relatively straightforward setup with resistance transitioning into support.
Price has shown rejection at the zone and appears to be maintaining it as a support level…
USD/JPY 1-Hour Chart Long Position:
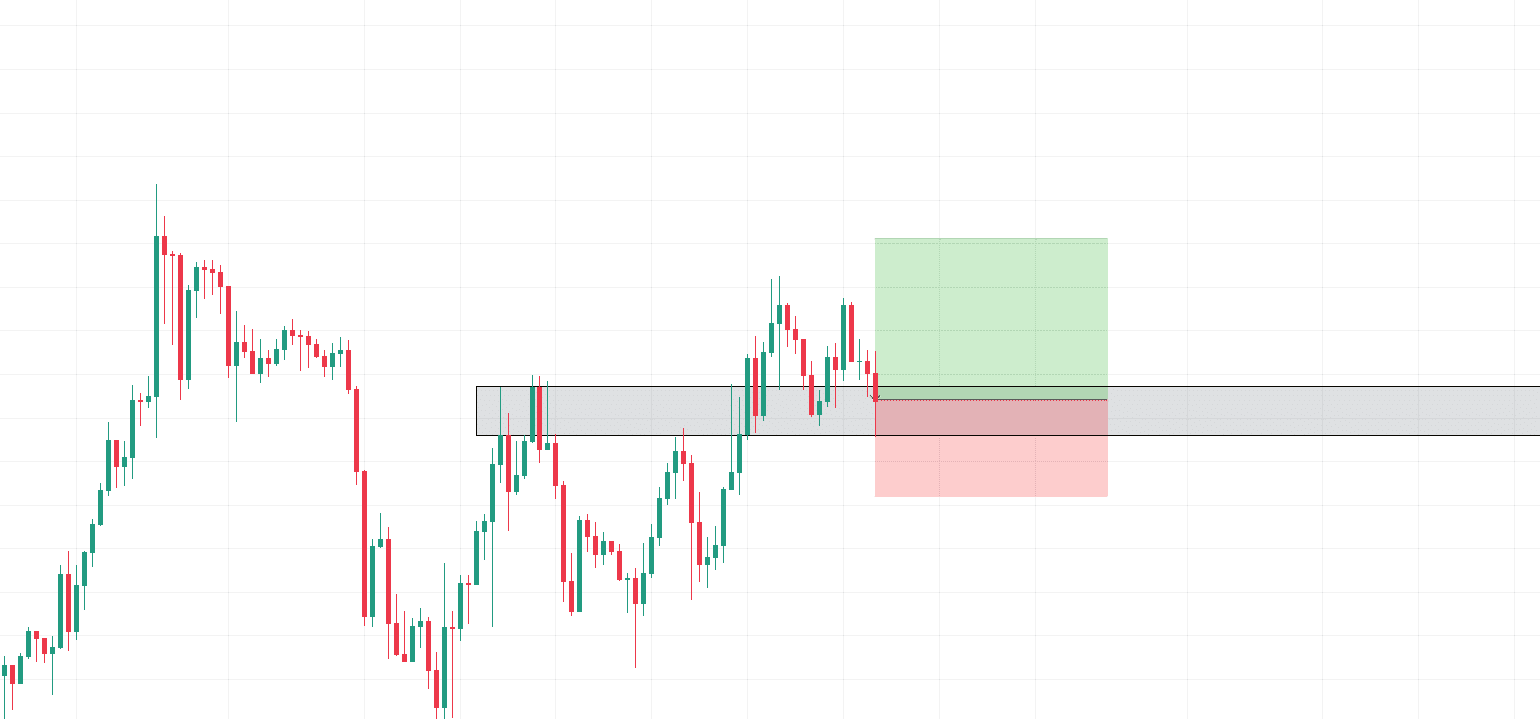
With this zone’s rejection by price, let’s seize the opportunity to go long.
Many traders might think about taking profit at the previous high, but for the sake of this example, let’s see how far this trade can go before you notice the price slowing down and signaling an exit trigger…
USD/JPY 1-Hour Chart Take Profit:
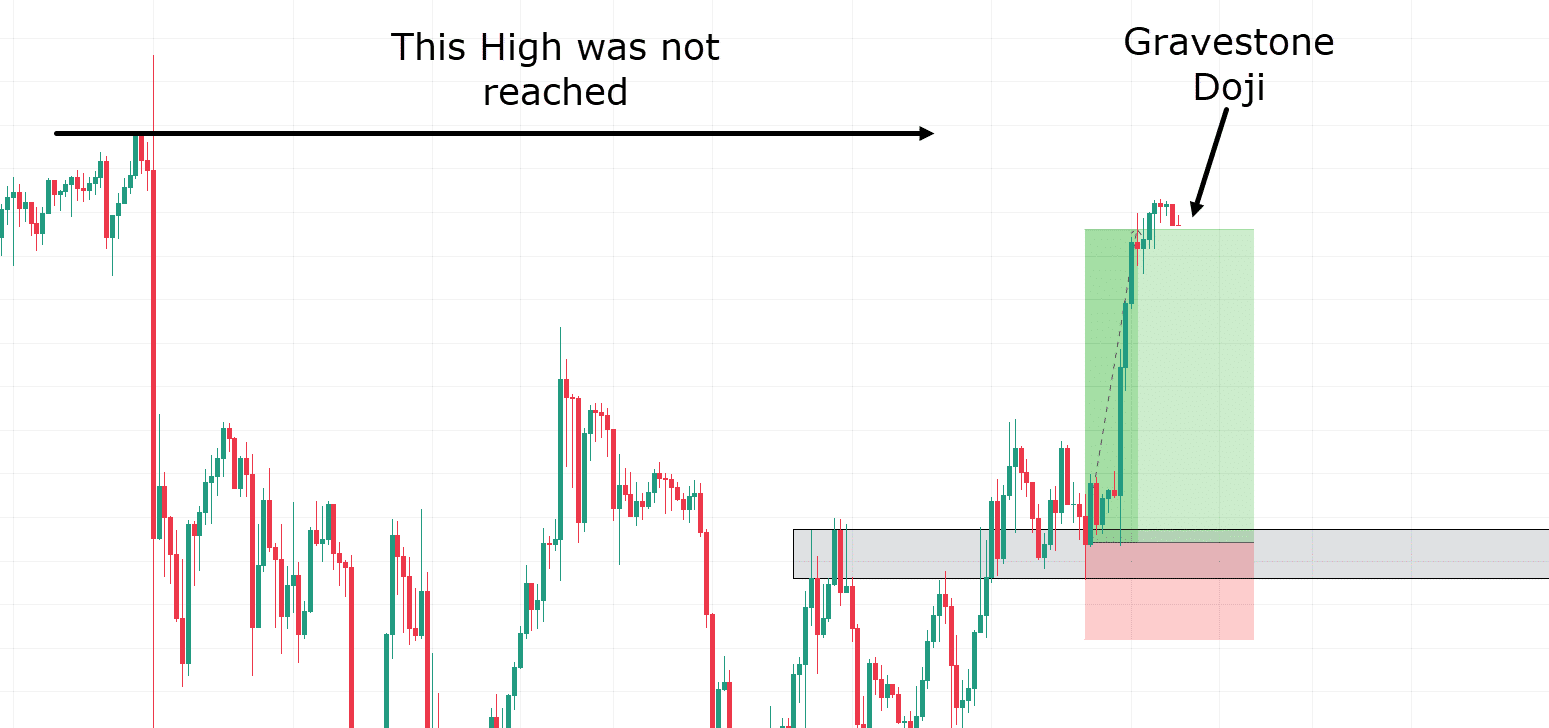
In this example, you can observe that the price has begun to stall, and the candles have started to form smaller, clustered patterns. Furthermore, a Gravestone Doji has emerged!
But, what’s actually happening here?
Perhaps the bulls aimed to reach the high located on the left side of the chart but lost their momentum, allowing the bears to establish a lower high.
For this example, let’s assume you decided to take your profits at this point… what would have occurred next?…
USD/JPY 1-Hour Chart Decline:
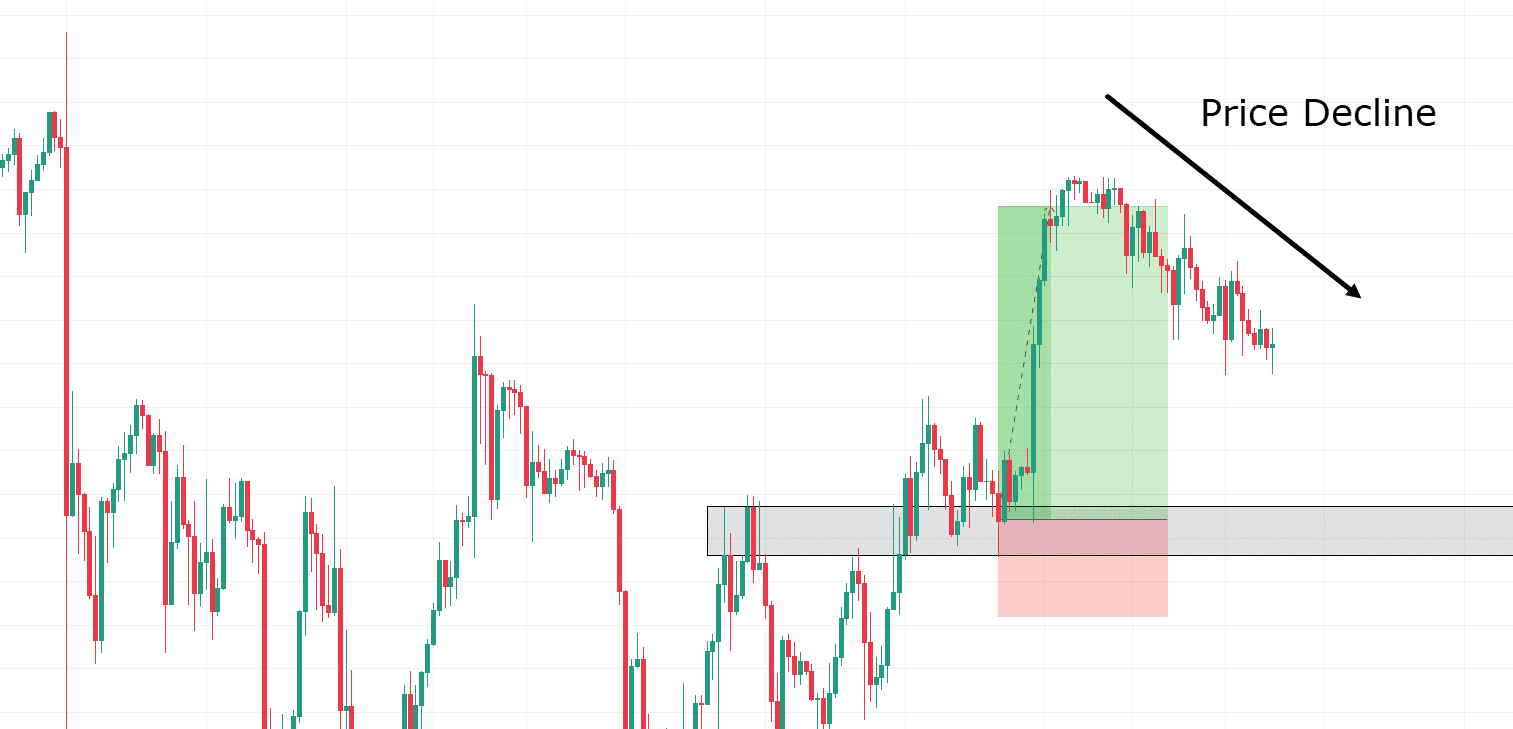
Price retraces, demonstrating that by constructing a narrative about the bulls’ attempt to reach the high, the stalling of momentum, and the formation of a Gravestone Doji, you, as a trader, could predict an impending brief pullback…
In these kinds of scenarios, the Gravestone Doji gives you the ability to make informed decisions based on what the market is trying to communicate.
So when the evidence suggests it’s time to exit your position, do so without hesitation!
Now, of course, the system isn’t flawless…
Gravestone Doji Limitations
Reliability with Indicators: The Gravestone Doji, like many technical analysis tools, should not be used in isolation.
Relying solely on this candlestick pattern is a recipe for losses.
To increase your odds of success, it’s essential to incorporate other indicators or trading strategies into your system.
Market Context Matters: It’s crucial to deploy the Gravestone Doji in appropriate market conditions.
For instance, when the price encounters a resistance level, stalls momentarily, and then forms a Gravestone Doji before declining, this setup is more likely to yield profitable results.
Randomly trading Gravestone Dojis that appear throughout the market would be less effective.
Confirmation Candles: While the Gravestone Doji can be powerful, it often benefits from a confirmation candle.
This additional candle provides stronger evidence of a shift in momentum.
However, relying on confirmation candles can lead to delayed entries, and depending on the intensity of the selling pressure following the Gravestone Doji, it may result in less favorable entry points and wider stop losses.
Uncommon Occurrence: The Gravestone Doji is not a common candlestick pattern. It is sometimes mistaken for Inverted Hammers or Shooting Stars.
In my experience, it is more frequently spotted on lower timeframes, such as the hourly chart or below…
However, it’s worth noting that it does appear on higher timeframes too.
Furthermore, signals on higher timeframes typically carry more significance!
While they may not occur frequently, it’s essential to pay attention to them as they offer opportunities to capitalize on market momentum shifts.
Imperfect Reliability: The Gravestone Doji is not a foolproof trading tool. No trading strategy or pattern works perfectly all the time.
It’s essential to maintain realistic expectations and understand that success rates are not guaranteed.
By combining the Gravestone Doji with other tools and analysis, you can definitely enhance your probability of making successful trades.
Lots to think about? Alright, let’s wrap it up…
Conclusion
The Gravestone Doji may sound intimidating, but it’s a valuable candlestick pattern that can be a staunch ally in the world of trading.
It can offer crucial insights into market sentiment, helping you identify potential reversals and providing clues for both entry and exit strategies!
While it has its limitations, understanding the Gravestone Doji equips you with a powerful tool to navigate the financial markets more confidently and effectively.
So, let’s quickly recap what you have learned in this article…
- What the Gravestone Doji is and why traders carefully consider its significance.
- How the Gravestone Doji unfolds a narrative about market sentiment at crucial Areas of Value.
- The unique characteristics that set the Gravestone Doji apart from other rejection candles.
- How to effectively utilize the Gravestone Doji in both long and short-trading strategies.
- Finally, you took a closer look at the limitations that accompany the use of the Gravestone Doji in your trading journey.
Now, outfitted with yet another powerful trading tool…
You can test the Gravestone Doji for yourself in the markets and capture amazing profits from Key Areas of Value!
So how about it?
What are your thoughts on the Gravestone Doji?
Have you begun to understand how candlesticks can give you great insight into market momentum?
Have you used other rejection or doji candles in your trading before?
Share your insights in the comments below!


