What Is a Moving Average and How Does it Work?
The moving average is an indicator that calculates the average price over a fixed period.
If you have a 10-period moving average, on your chart, it simply calculates the average price over the last 10 candles.
If you’re on a daily timeframe, it calculates the average price over the last 10 days.
If you are using a 50-day moving average, it calculates the average price over the last 50 days.
Example:
The red line is the moving average.
In this case, it’s a 20-period moving average.
One thing about the moving average is that you’ll notice it tends to follow the price.
You can see the price has declined lower and your moving average is heading down as well.
You might be wondering…
Why does it happen?
How The Moving Average Works
Let me explain.
The reason is that it calculates the average price over a given period.
Example:
You have a 5-period moving average, for an Apple stock. The stock price for the 5 days are as follows:
On the first day, the stock closed at $1
On the second day, the stock closed at $2
On the third day, the stock closed at $3
On the fourth day, the stock closed at $4
On the fifth day, the stock closed at $5
How do you calculate this 5-period moving average using the data that you have?
You just simply take the values from the first day to the fifth day and divide them by 5.
In essence, in this case, it’s a simple moving average we are calculating.
(1+2+3+4+5)/5 =$3
The 5-day moving average in this case is $3.
Just remember this number moving forward.
On the sixth day, the stock closed at $6
$(1,2,3,4,5,6)
How do you calculate the 5-day moving average on the sixth day?
Now we have six values on the chart.
If you are dealing with moving average you have to take into consideration the recent 5 days so in this case the most recent closing price over the last 5 days is:
$(1, {2,3,4,5,6})
You will ignore the first day, as you are not dealing with a 6-day moving average.
{2+3+4+5+6}/5 = $4
And so on…
What happens is that on your chart,
Imagine this is a chart:
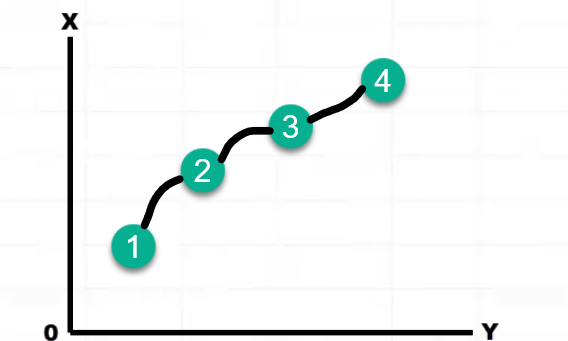
What happens is that they will connect these dots as lines on your chart, and that’s how your moving average is shown by calculating the average price over the last 5-days.
And of course, if your values get smaller in a descending order the moving average would point down as well.
That’s how your moving average works.
When to Use the Moving Average
Moving Average works best during a trending market. Here’s why.
Have a look at this chart:
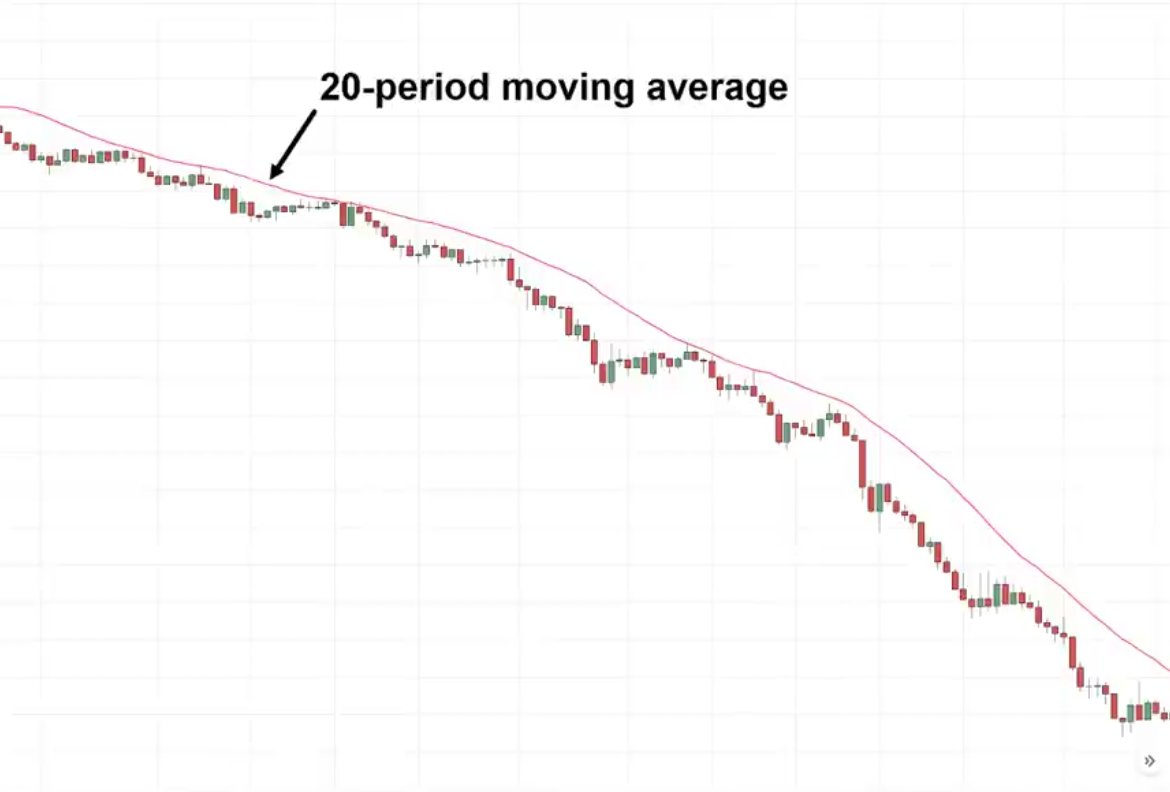
You can see that this market is in a downtrend.
The red line is the 20-period moving average. If you use this moving average for this market condition, you can see that you will be able to spot numerous trading opportunities.
You can see how the market bounced off at the moving average a couple of times.
These are all potential trading opportunities to short this market and ride the move downward.
Example:
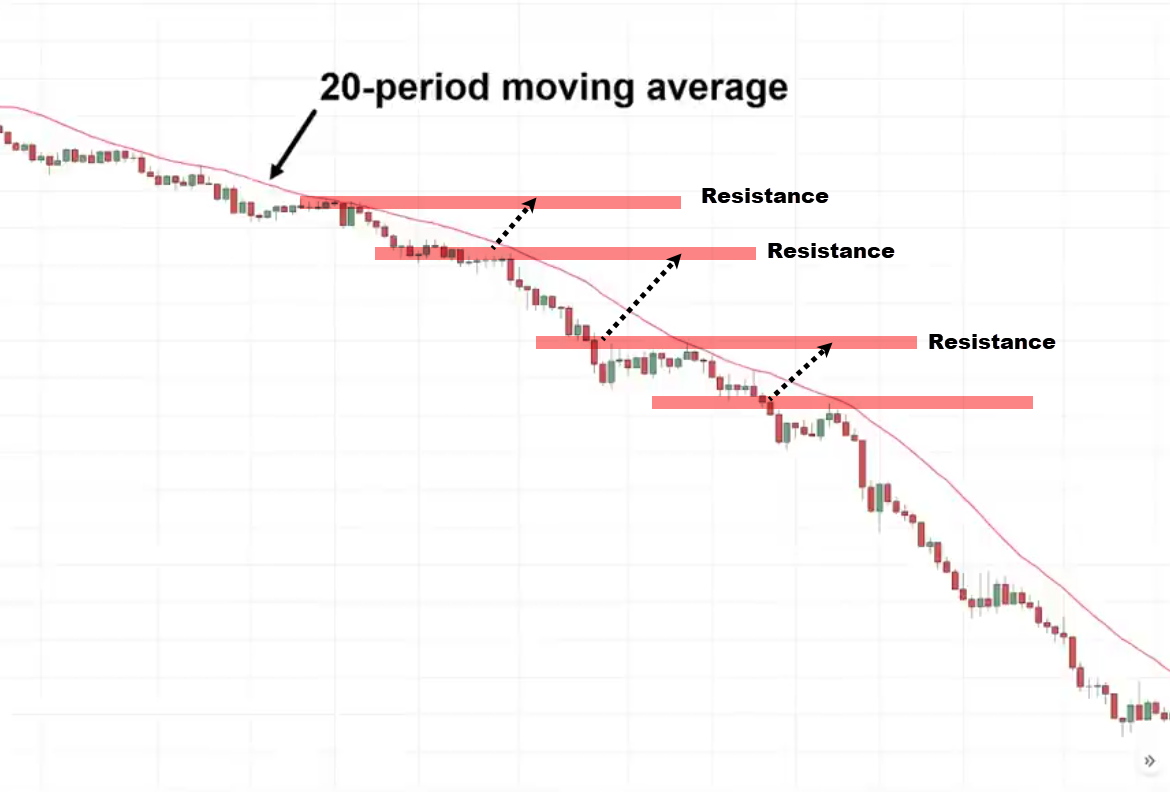
If you are a trader who relies on support and resistance, you will be disappointed because the price never comes back to resistance. It just continued hitting lower.
There would be a lot of missed opportunities if you don’t have additional techniques in your toolbox to trade the markets.
This is a powerful arsenal.
Example:
50-Moving Average
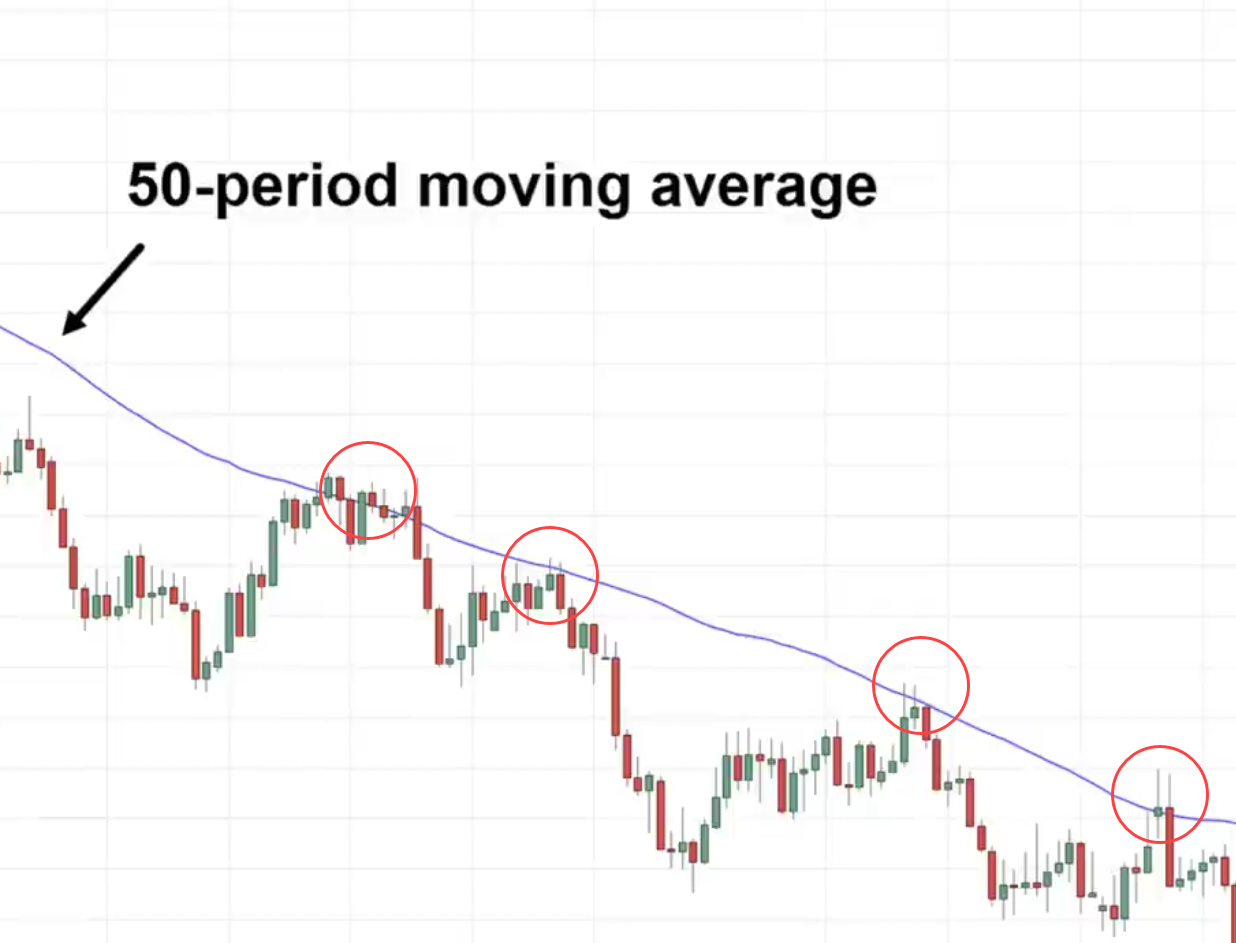
You notice how the market respects this particular moving average in this trending market condition.
The price bounces off the moving average nicely.
Later on, I’ll share with you which is the best-moving average to use.
When Not to Use the Moving Average
Ranging Market:
This is a perfect example:
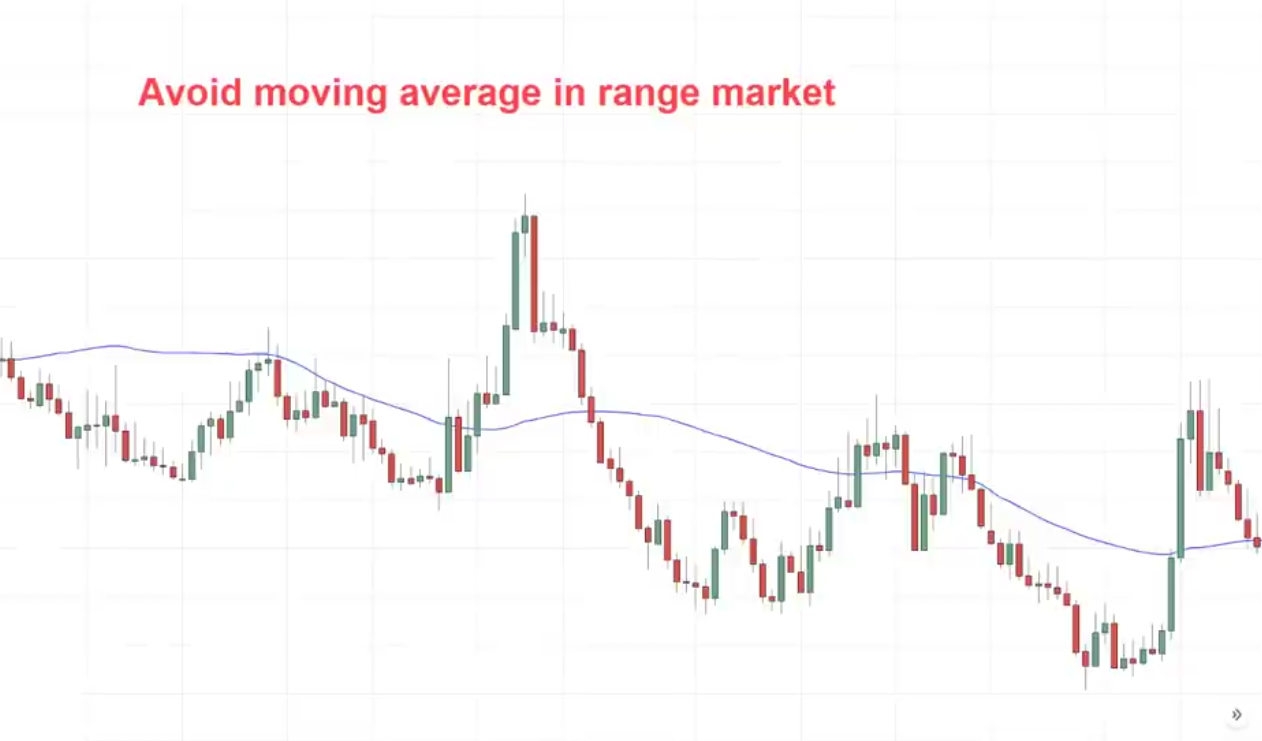
When it’s a range market you don’t use the moving average.
Whatever moving average you have on your chart, the price will just slice through it like a hot knife through butter.
The price comes in and cuts through the moving average hits lower and goes up.
You can see that during a range market, the moving average is not effective and you only want to use the moving average when the market is trending.
It’s key to be able to identify trends.
How to Identify the Trend
A market is said to be in an uptrend when it consists of a series of higher highs and higher lows.
Example:
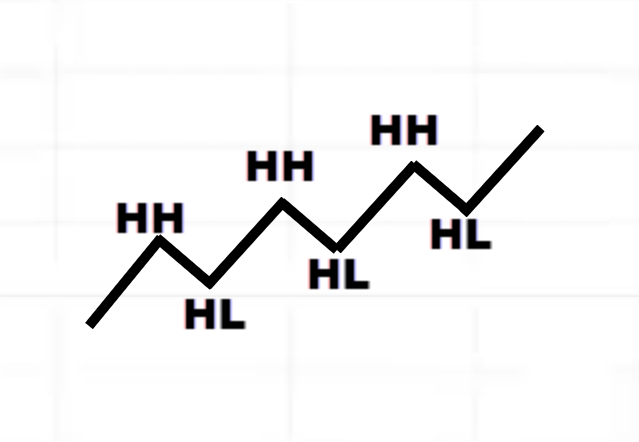
Why is this called a higher low (HL)?
Because the low is higher than the previous low.
Why is this called a higher high (HH)?
Because the high is higher than the previous high.
Does it make sense?
Example:
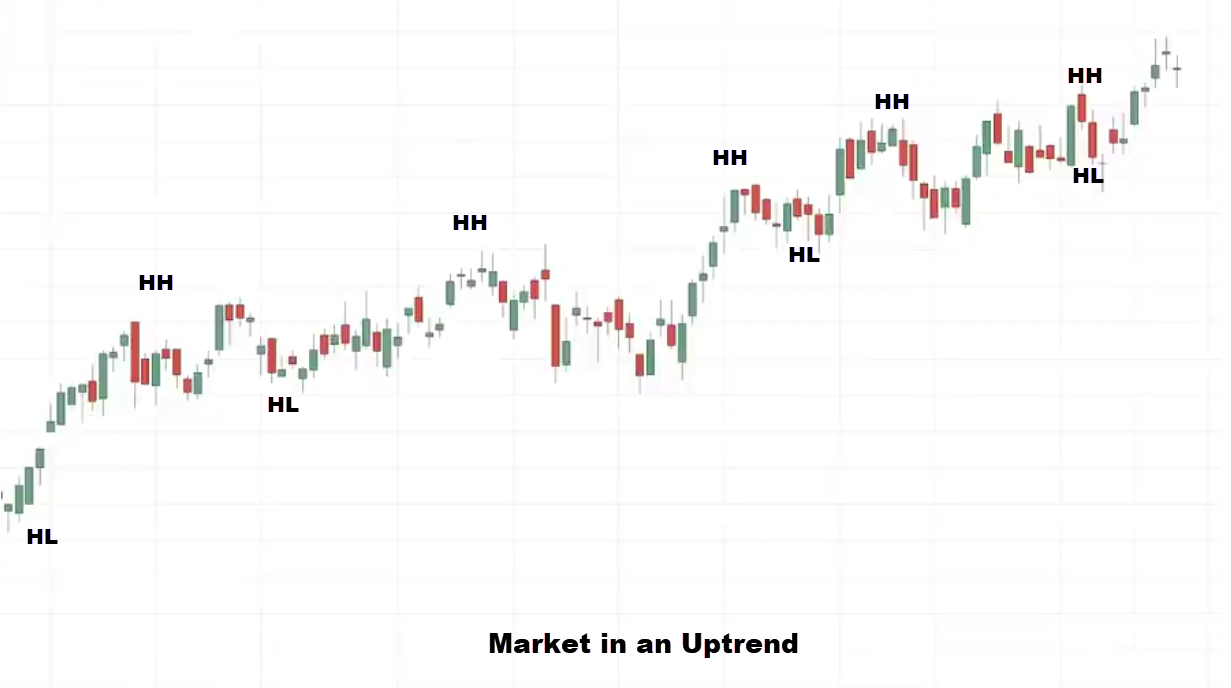
This is what we call an uptrend.
We have a series of higher-high and higher-low
You can see that when the market is in an uptrend it will consistently form a series of higher highs and higher lows.
Some of you might be thinking…
“Rayner, no this is not as easy as it seems because there are times when I see the market is in an uptrend like this then it goes lower and it continues up higher”
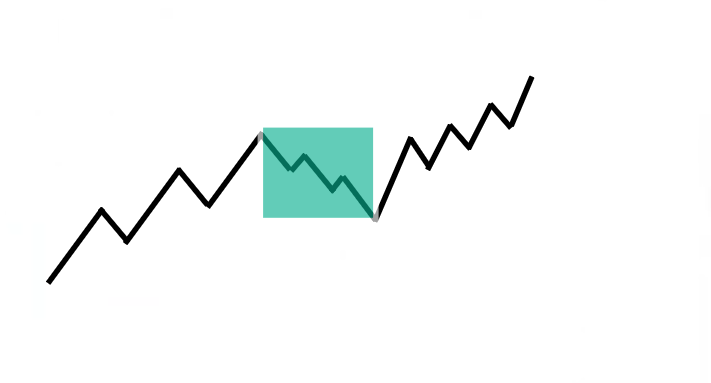
Let me ask you, Rayner…
Is this now in a downtrend because we now have a lower high and a lower low?
That’s a good question…
In a market structure, in an uptrend, you don’t always get a series of higher highs and higher lows because there are times when the market can make a pullback, and within the pullback the market gets messy. It forms a lower high and a lower low.
Sometimes the market could go up and chop into a range then you think it’s a reversal and it breaks up higher.


