Over the past few months, I’ve shared with you some advanced trend line strategies…
Such as the different types of trend lines…
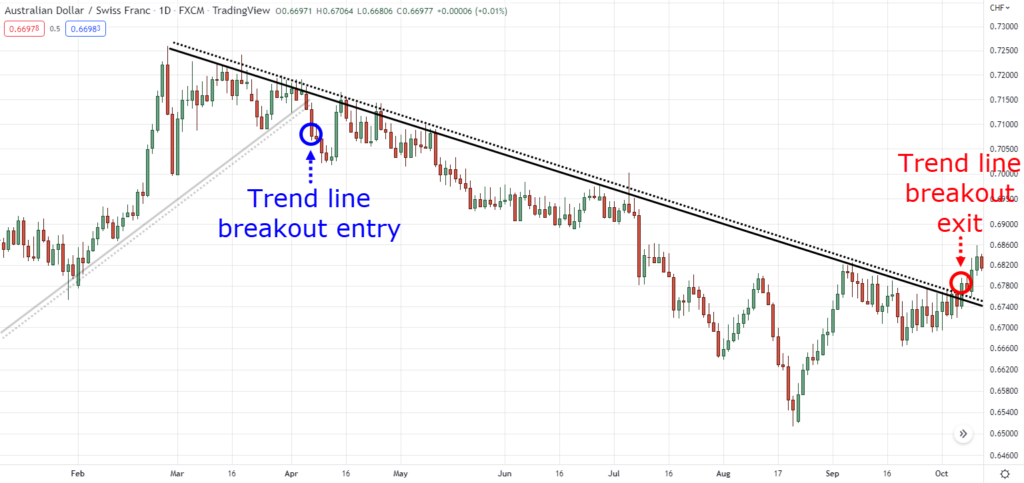
And a trend line breakout strategy…
But what if advanced analysis isn’t really your thing?
Maybe all you want is a quick and snappy guide on how to use trend lines – right?
If that’s the case, then you’re reading the right article!
In this trend line guide, you’ll learn:
- What a trend line is, and how (and why) it works across most markets
- How to use trend lines to generate low-risk and high-reward trading ideas
- The easy way to enter, manage, and exit your trades using trend lines
- A few pointers on what NOT to do when learning how to use trend lines
Are you ready?
Then let’s get started!
How to use trend lines: what they are and how they work
Let me share with you something which helped me unlock my studies…
The secret to learning any new trading concepts out there is to first understand WHY things happen.
The WHAT comes later.
So, instead of asking:
“What is the best moving average period?”
It’s better to ask:
“Why do I need to select this moving average period?”
It’s the same idea when you approach trend lines.
Instead of asking what the best trend line strategy out there is, you should ask:
“Why does the trend line work in the first place?”
So, let’s dive into that question.
How trend lines work in the markets
As you know, there are different types of trends.
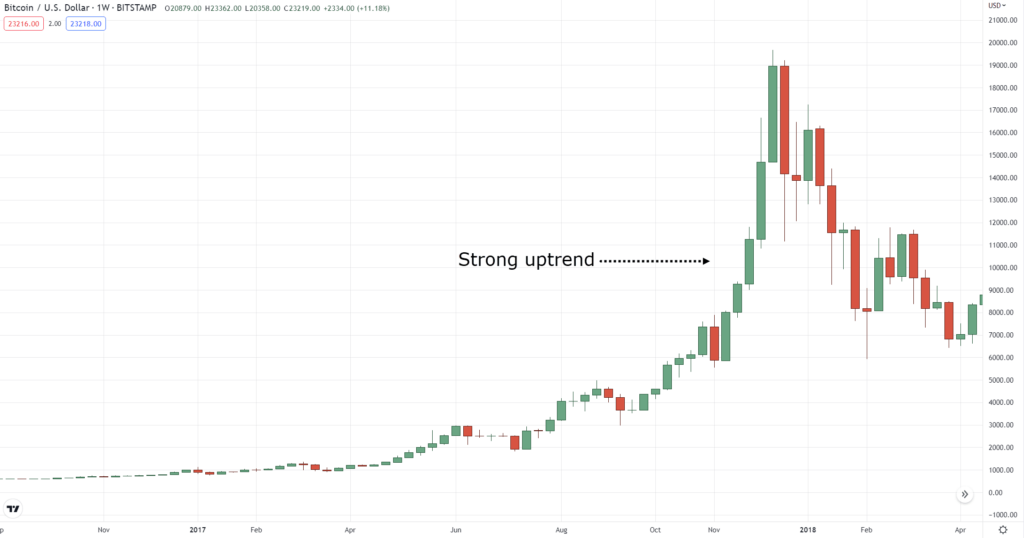
There are strong trends…
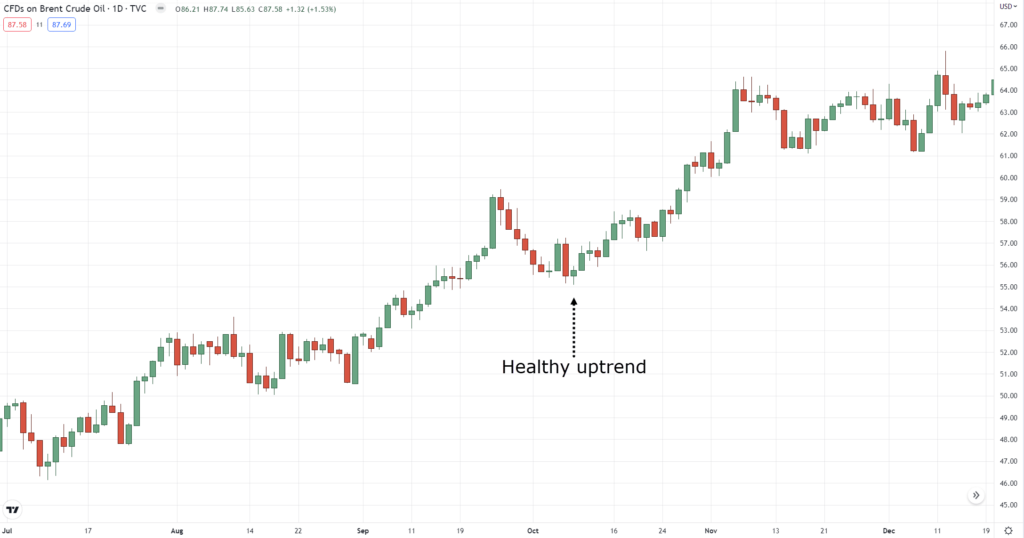
Healthy trends…
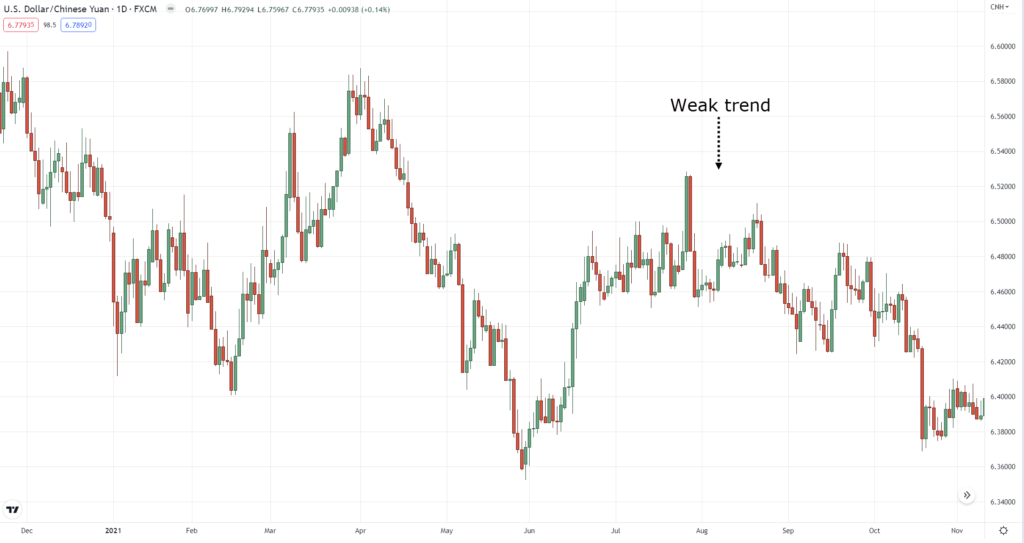
And weak trends…
Simply speaking, what trend lines do is identify areas of value…
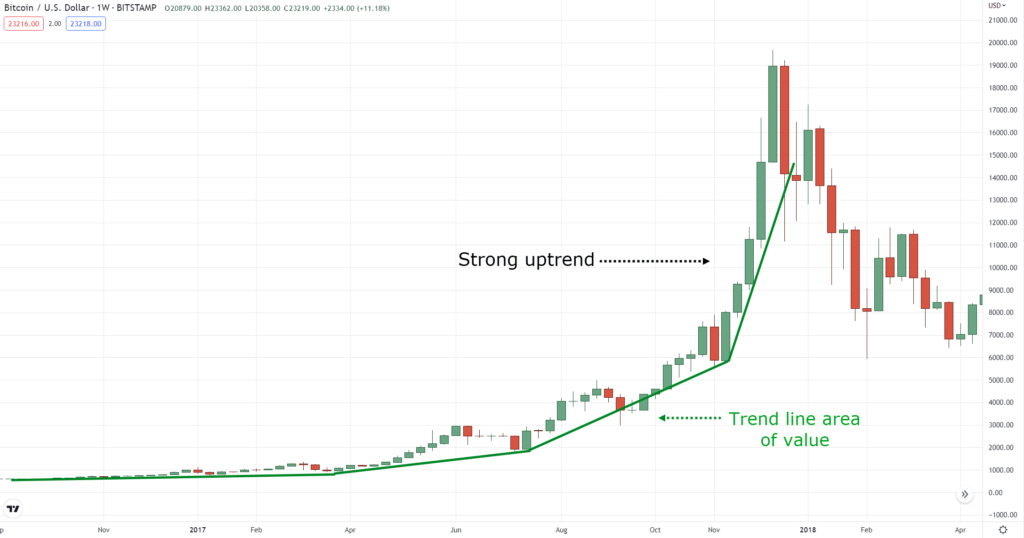
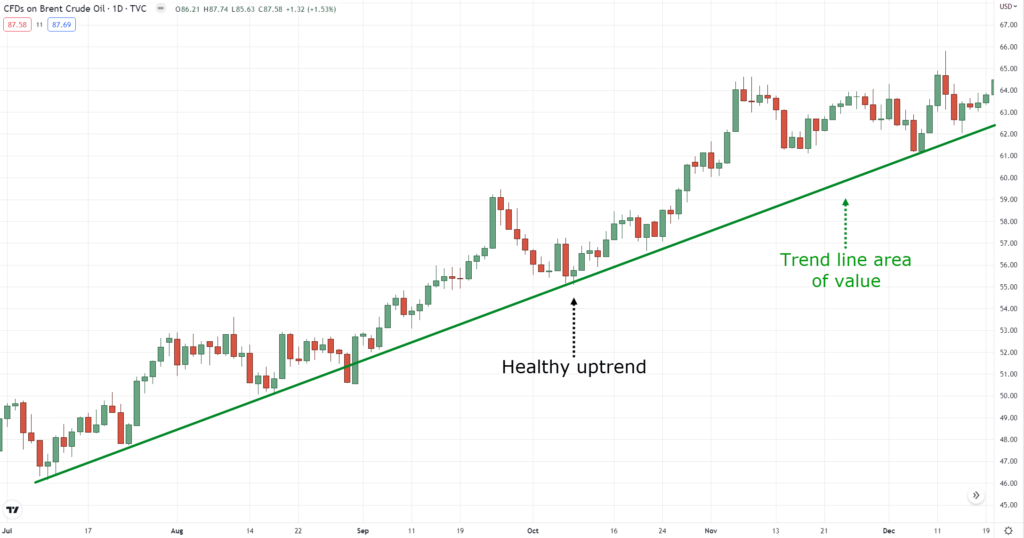
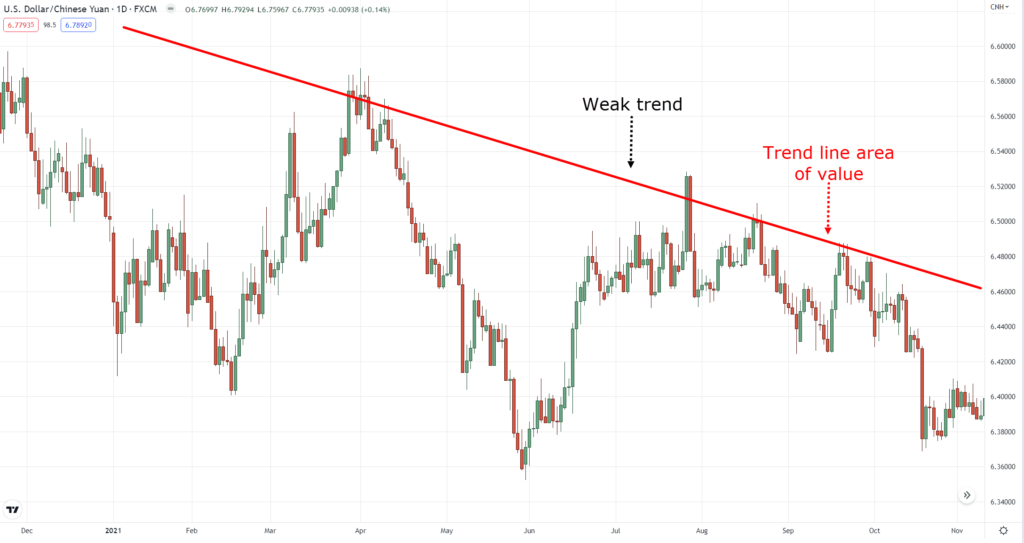
In response, we find market opportunities on trends as they present themselves!
You don’t predict with them… instead, you use trend lines to react to current market conditions.
Make sense?
Now that you know the “why” behind trend lines…
Let’s start with the basics of how to actually use them.
How to plot trend lines on your chart
The reality is that, as with any tool, it takes practice to learn how to use it properly.
So, there will be times when you might plot trend lines the wrong way (and that’s okay!).
Nonetheless, a trend line is valid when there are two swing points in the market.
For example…
In an uptrend, you’d want to focus on looking at the lows…
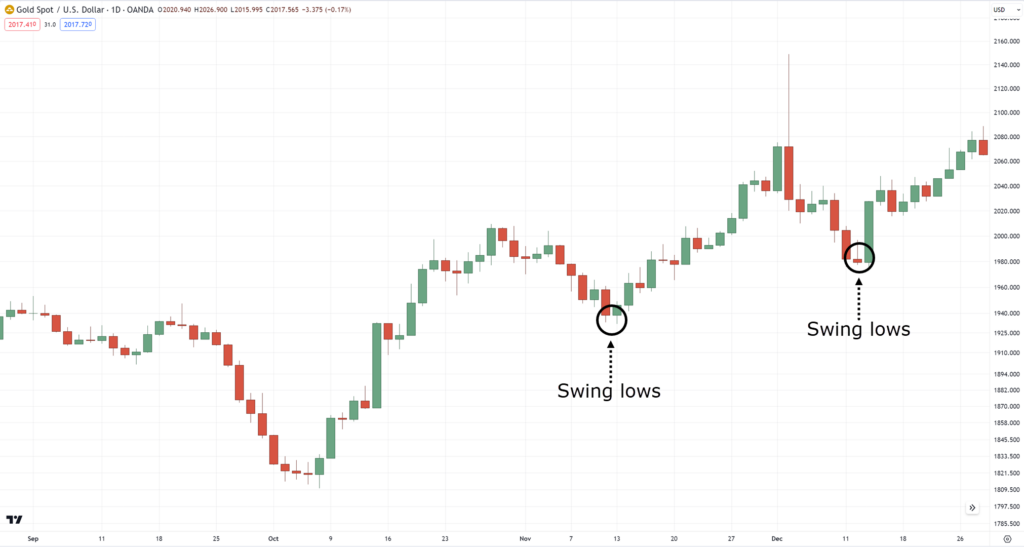
Once it made two swing lows then that’s the time when you want to “project” where the next swing low would be…
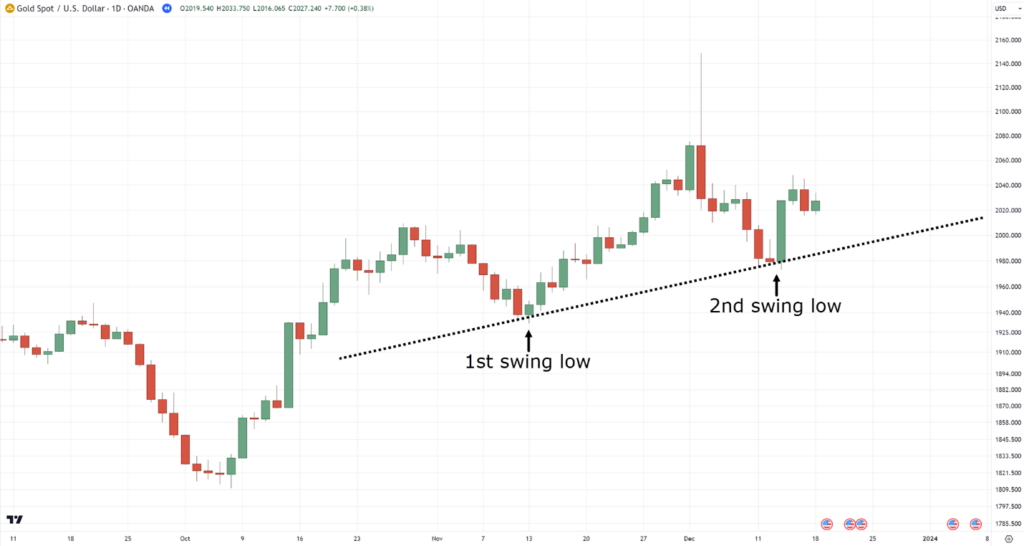
For downtrends, however…
…it’s swing highs that are something you’d want to focus on instead (and not the swing lows)…
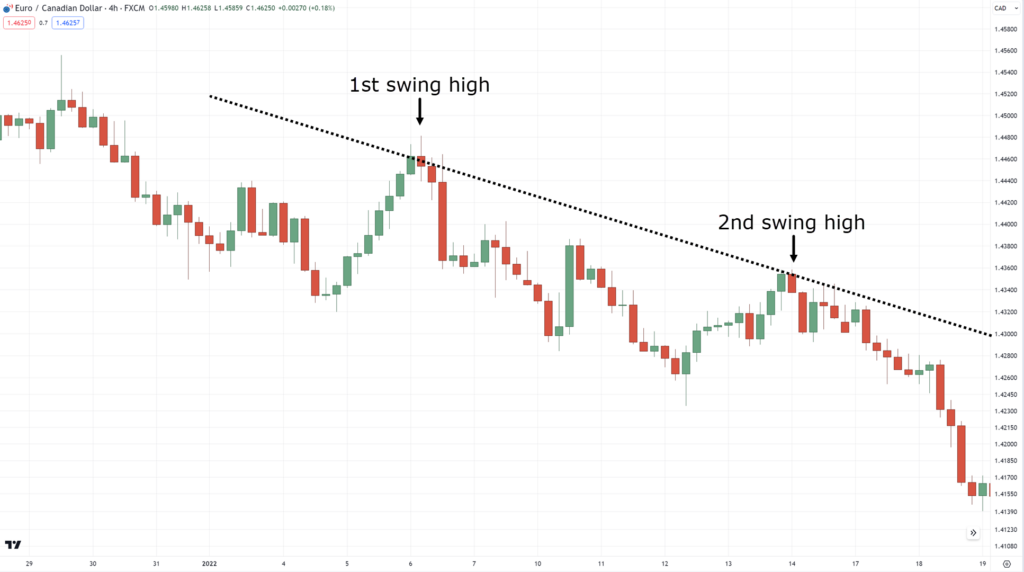
It seems pretty simple, right?
Think you’ve got it?
Well, let’s have a quick workshop first.
Look at these charts…
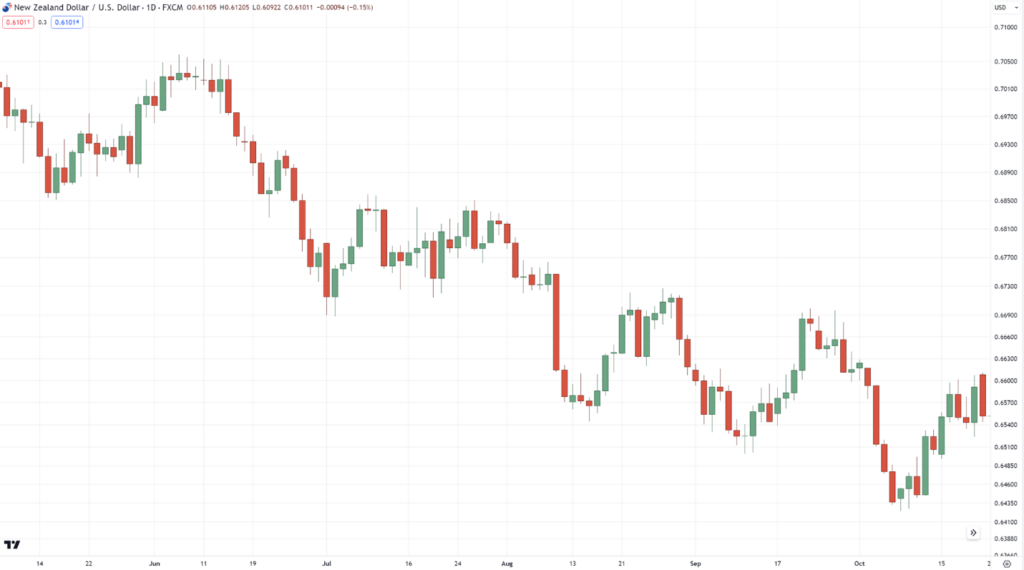
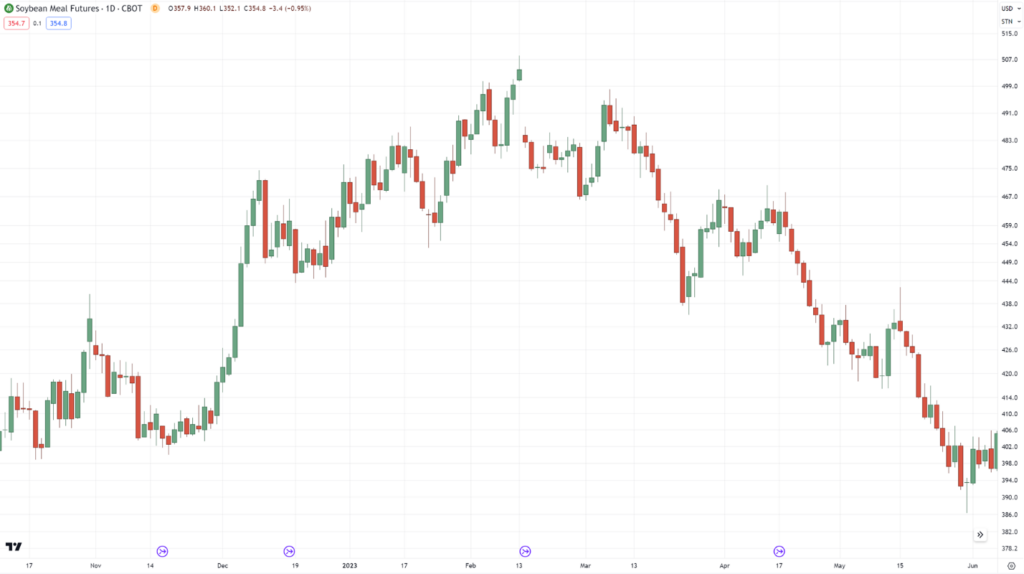
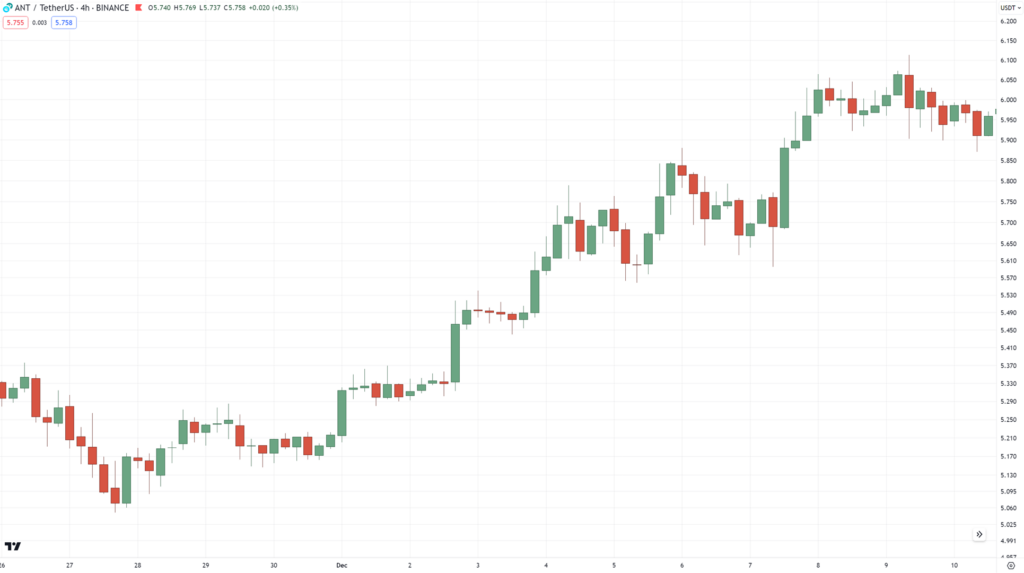
Where do you think the trend lines should be?
…I’ll give you a moment to look again.
So here are mine…
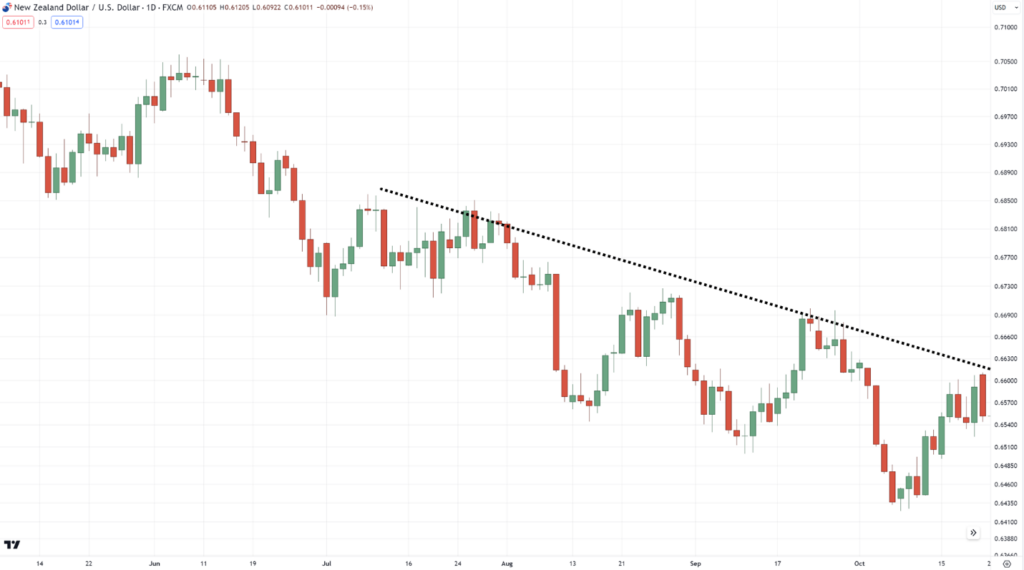
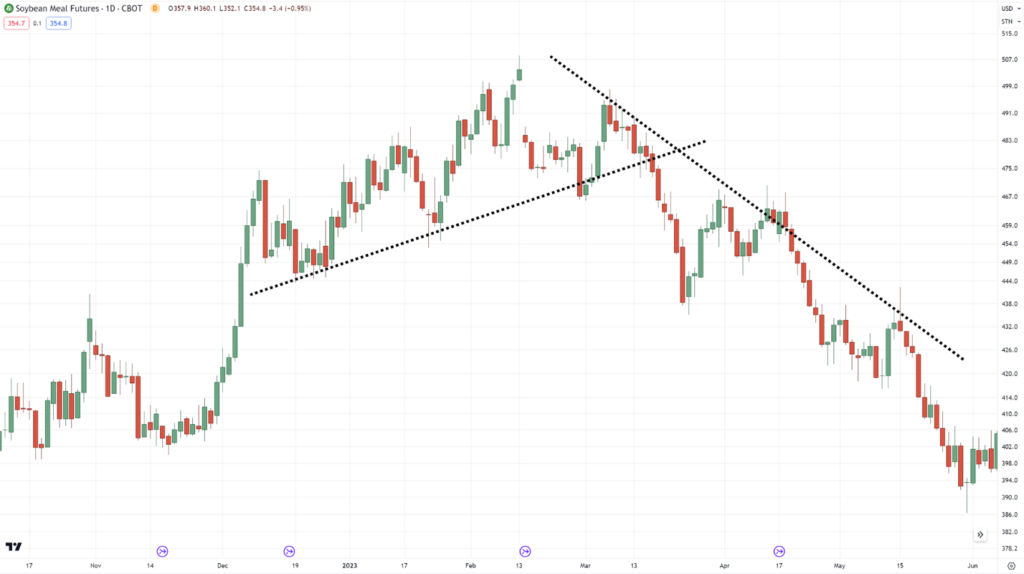
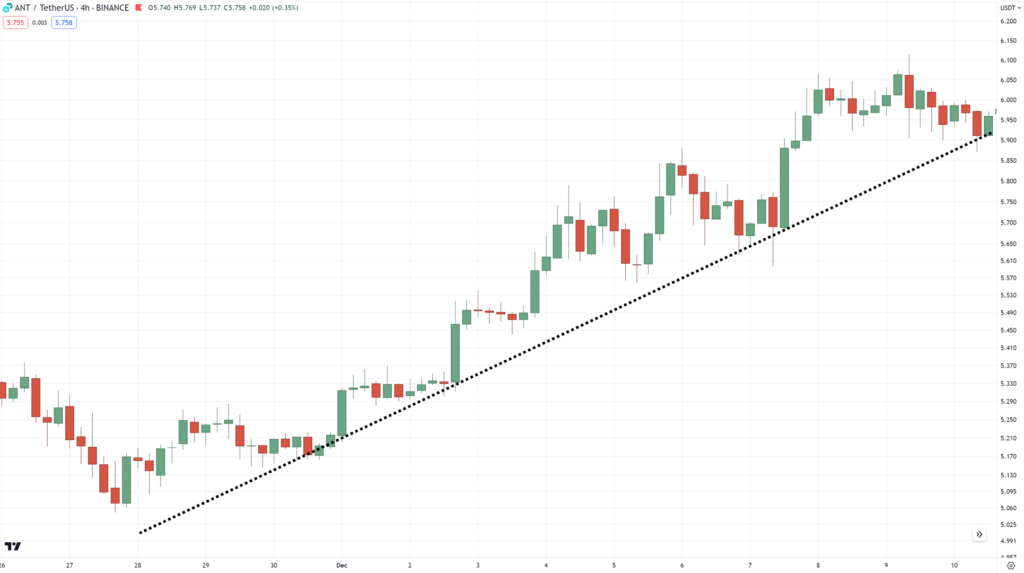
I’ll give you more tips later about plotting trend lines.
Needless to say, if your plots more or less match my example, then you’re a pro at this already!
Now that you know why the trend line works and what to keep in mind when plotting it…
Let’s dive deeper!
How to use trend lines to accurately analyze the markets
Here’s the truth:
Trend lines are the most simple and versatile tool to use when trading the markets.
However, even simple tools can have a lot of tricks up their sleeves.
And it’s those tricks that I’ll share with you in this section.
First…
Identifying trend strength
This technique is simple.
Remember what I told you about using swing highs or lows to plot your trend lines?
Good!
One way to identify if the trend is accelerating to the moon is when its swing lows are sloping higher.
Here’s what I mean…
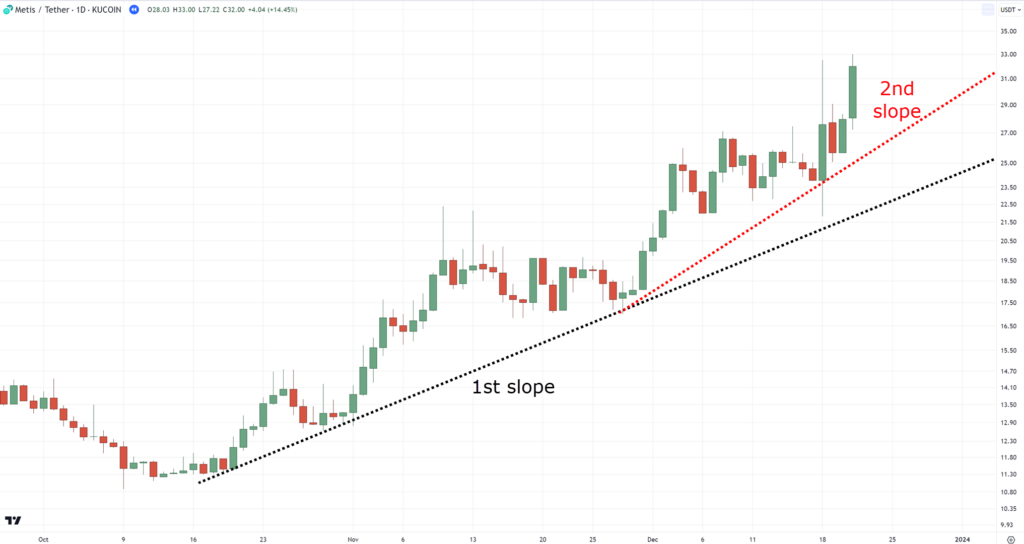
Breaking it down for you…
The moment you plot your valid trend line and the market makes a 3rd swing low…
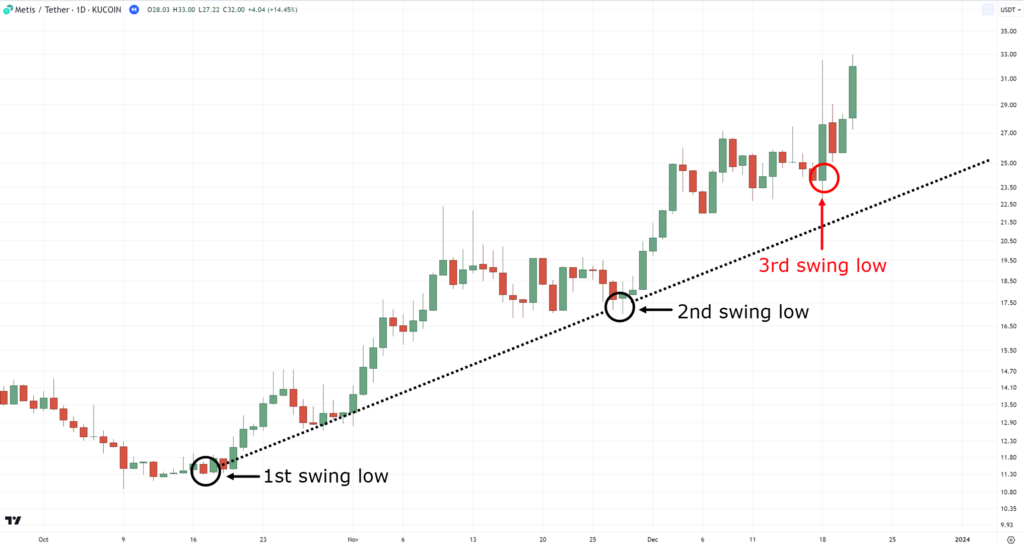
…plot another trend line from the 2nd swing low…
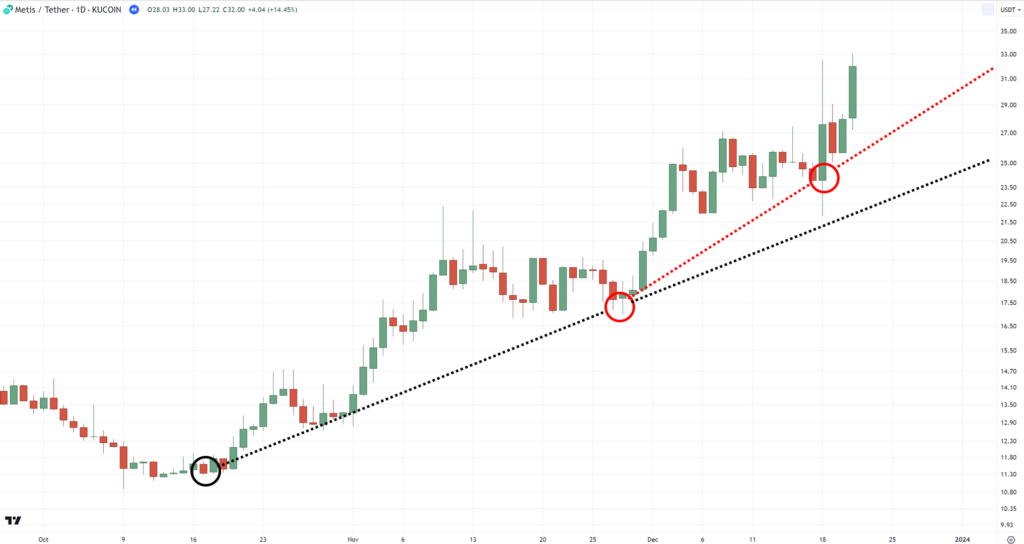
If the trend line is continuously sloping, then this tells you that the trend is accelerating.
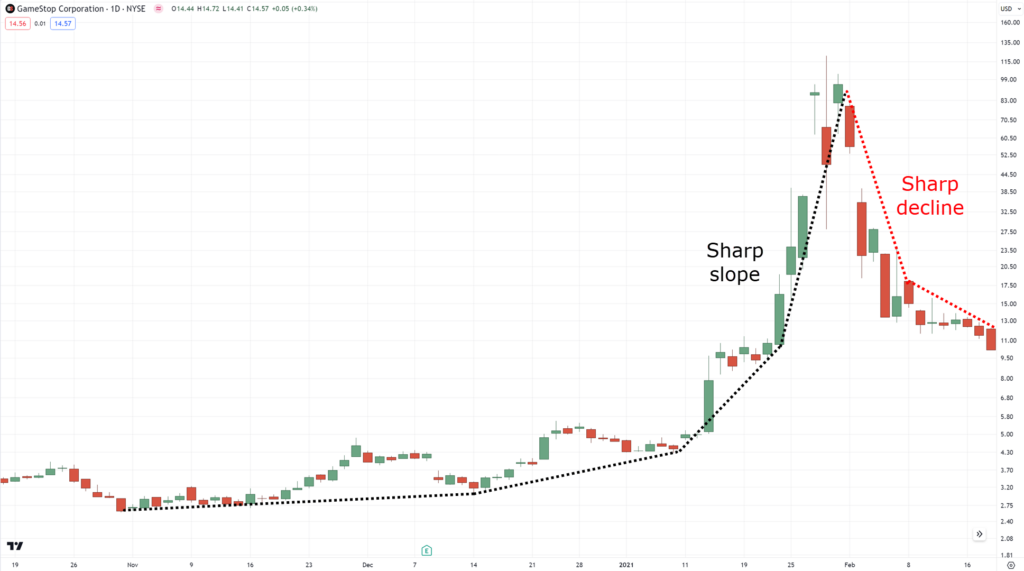
Now, the reason why this is important is that, in an accelerating trend:
- The price can shoot up even further
- Pullbacks rarely happen
- But at the same time, sharp crashes are still possible!
Here’s an example…
On the other hand, the opposite can happen when swing lows start sloping lower…
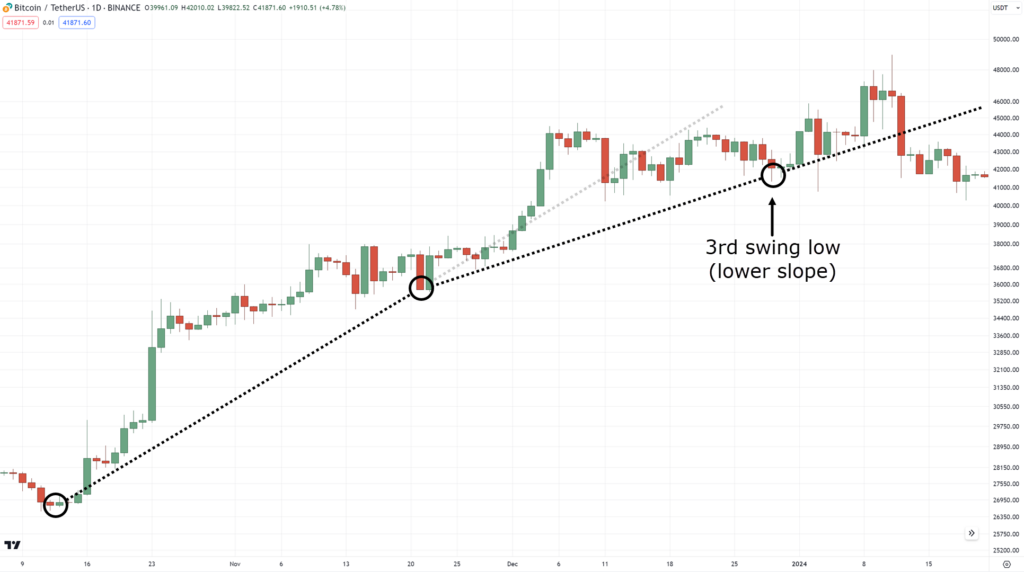
This indicates that the trend is weakening and potentially forming a range market.
Make sense?
Now, before we move on, it’s crucial that you always set your charts to the logarithmic scale…
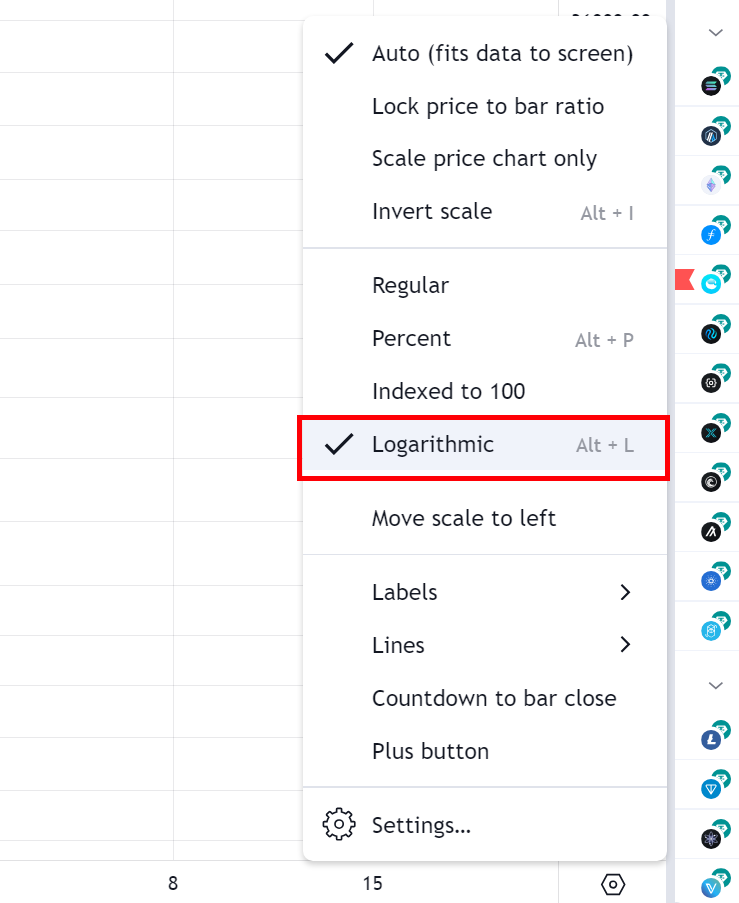
This deserves a whole new guide for itself, but basically, being on a logarithmic scale helps you look at the chart more objectively!
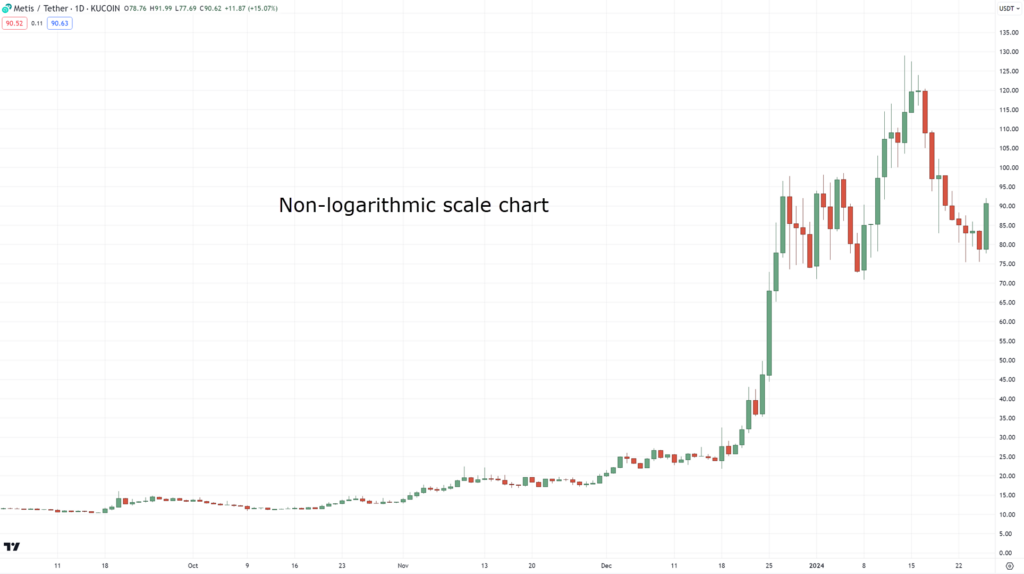
For comparison, here’s a chart which is not using a Logarithmic scale…
And here’s the same one which does use a logarithmic scale…
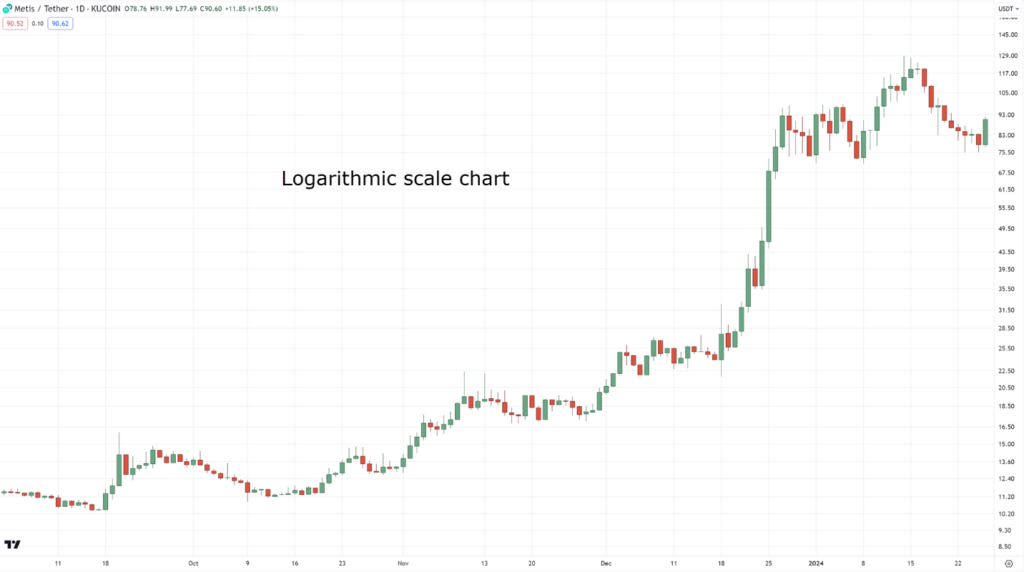
It makes a whole lot of difference, right?
Swing lows and highs are much more visible, which can be huge when learning how to use trend lines.
Now, another concept on how to use trend lines to analyze the market is…
Timing trend reversals in the market
I know what you’re thinking:
“Aha, a trend reversal!”…
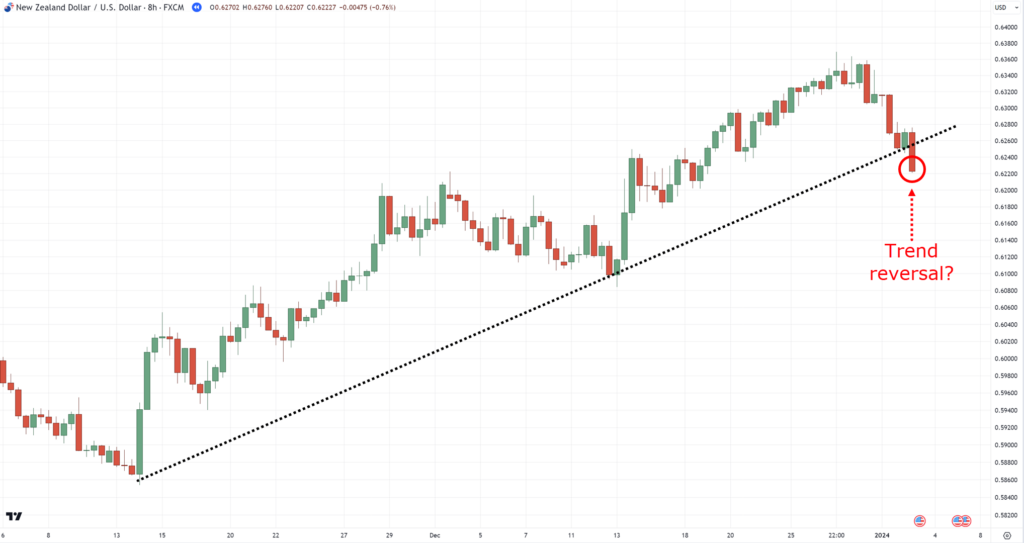
Yet, one candle alone isn’t enough to reverse the whole trend.
Why?
Well, because false breaks happen all the time in the market!…
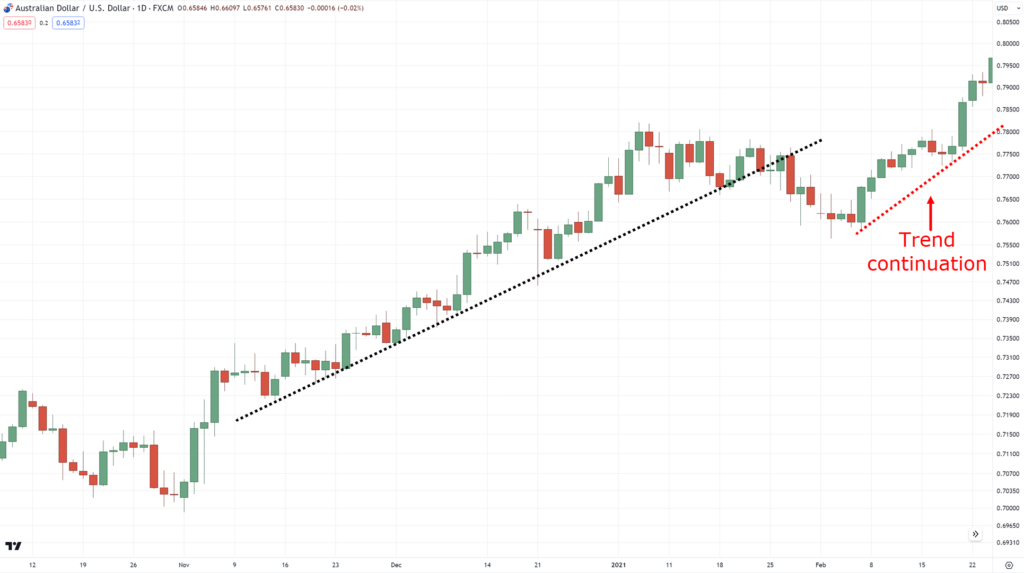
So, how should we properly define trend reversals by using trend lines?
The answer is through the extra confirmation!…
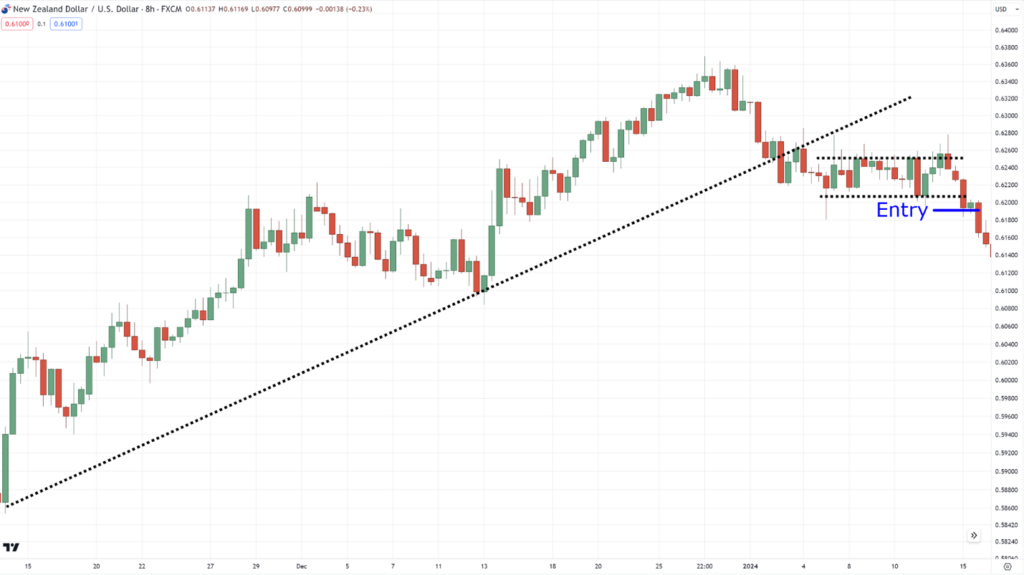
That’s right!
Waiting for a bear flag pattern and then a breakout of that pattern is enough to tell us that the market structure has changed!…
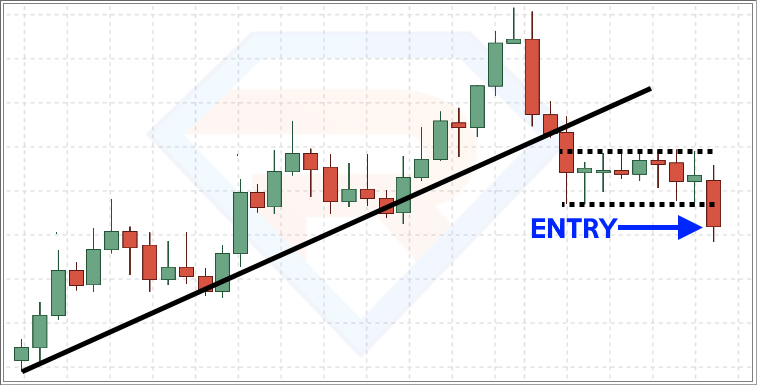
Here’s what it looks like on long setups…
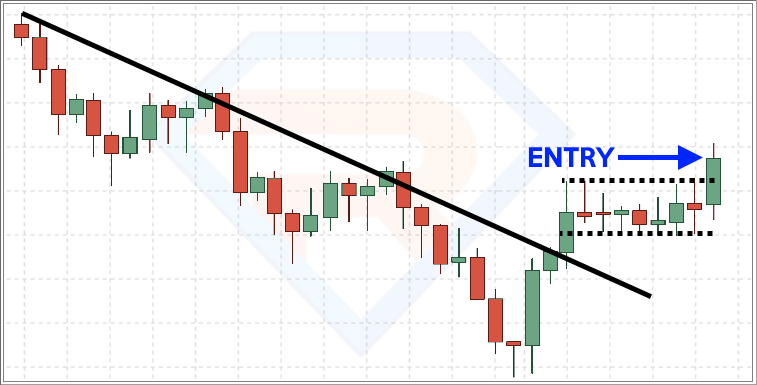
Got it?
Great!
Now that you can understand WHY trend lines FORM, and HOW to use them to ANALYZE the market…
What’s next?
Or rather… what’s missing?
The answer is – how to use trend lines to PROFIT from the market, of course!
So, let me show you more in the next section…
How to use trend lines to enter, manage, and exit your trades
What use is any trading concept if it doesn’t help you trade better?
After all, doing analysis is vastly different from the actual churn and flow of real markets!
But before I start…
Take note that these concepts have been simplified somewhat…
…in order that you can use them to improve your current strategy.
Now let’s get started!
How to use trend lines to enter pullbacks
This is probably the oldest trick in the book!
Take a look at what I mean.
Simply wait for the third touch!…
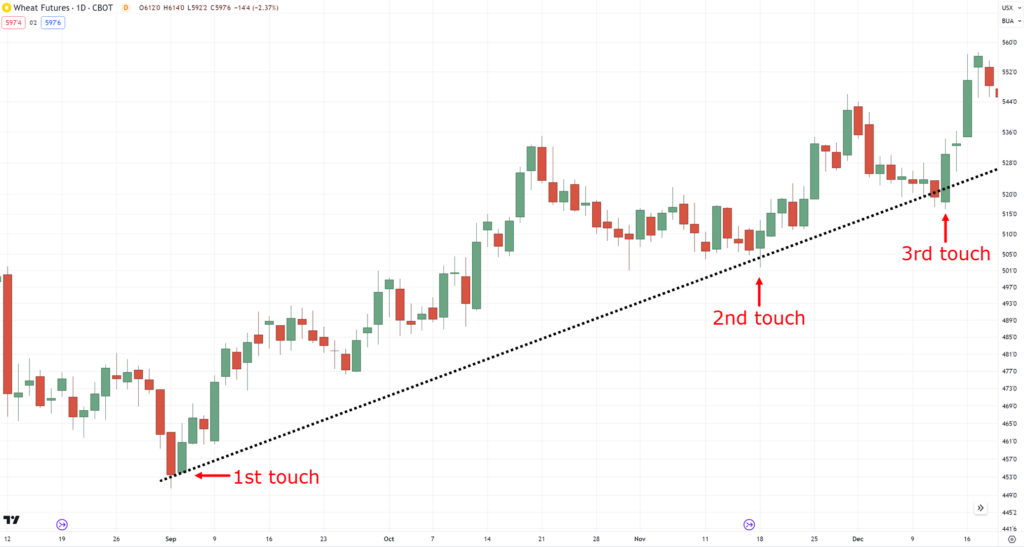
See it? Ok… but… when exactly do you hit the buy button?
It’s a question the books only vaguely answer, right?
But, here’s how:
First, wait for the price to close below the trend line…
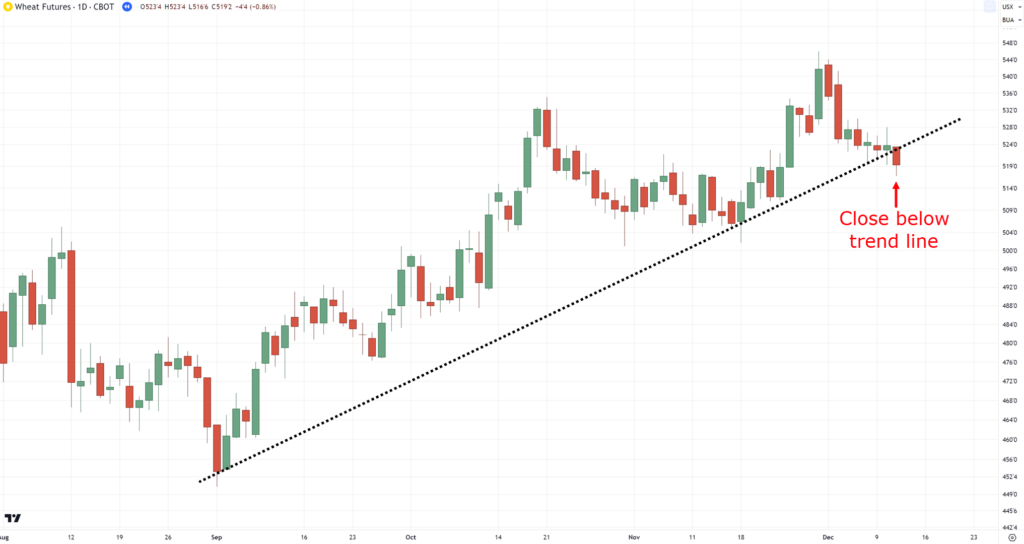
…and once the price makes a bullish candle close…
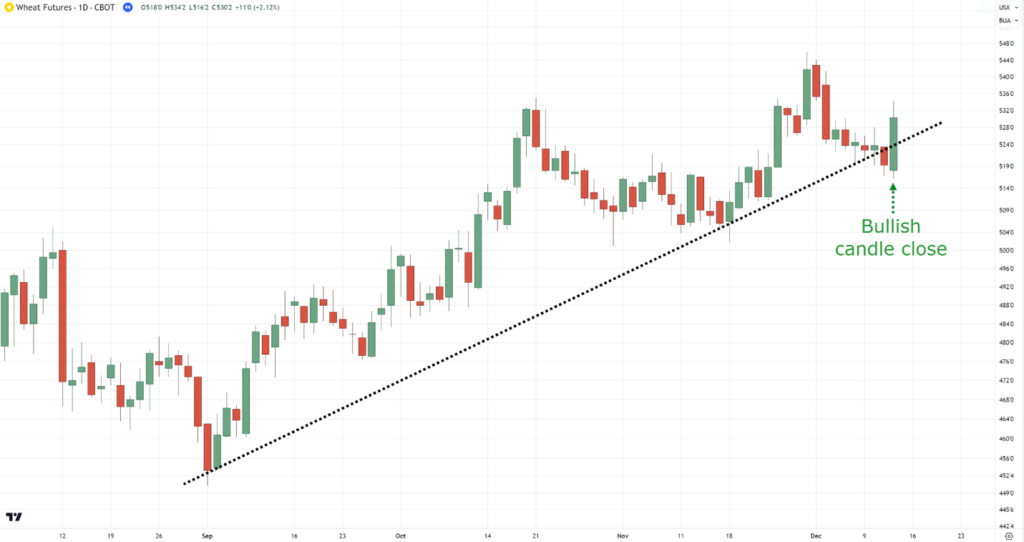
…then, you enter at the next candle open!…
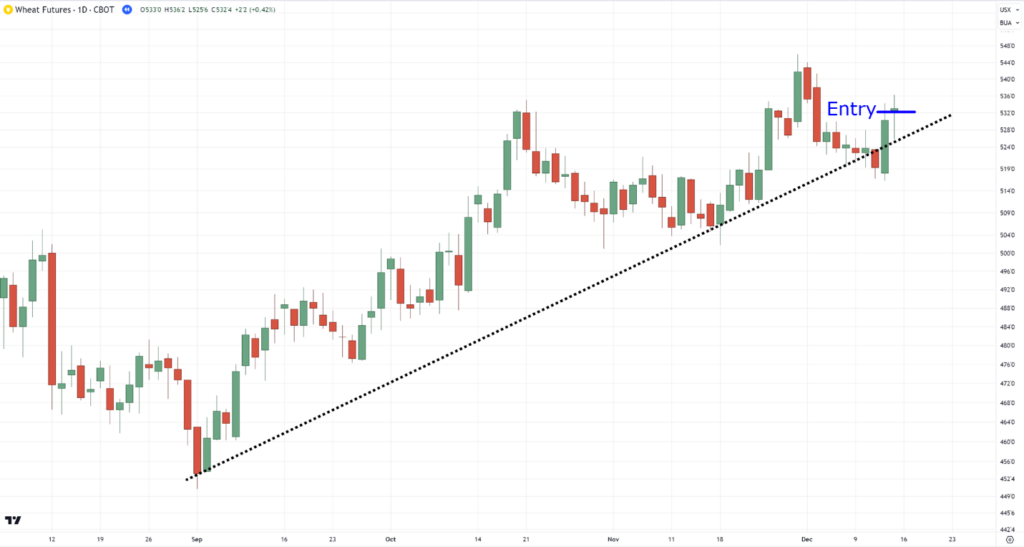
This is actually a universal way to enter common chart patterns and trend lines.
The more you know, right?
Now you’re probably thinking:
“But what do we do when the trend is sloping like our previous examples?!” …
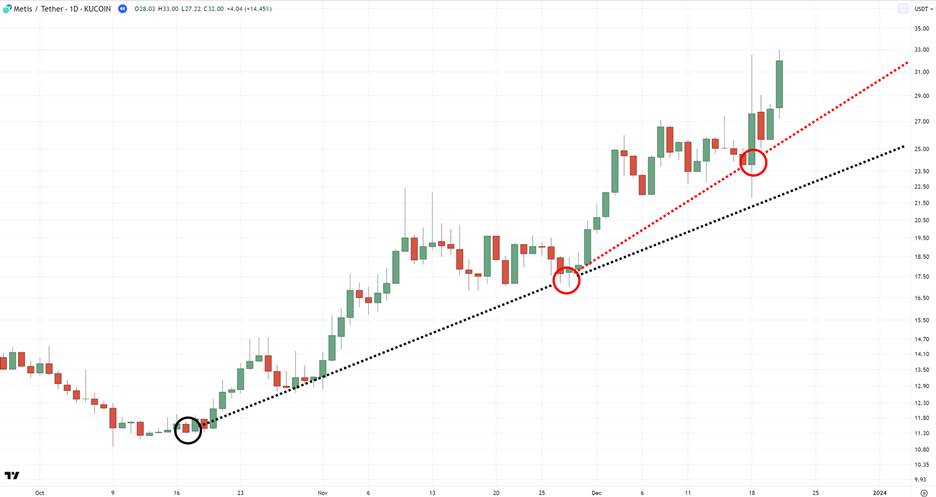
Great! You’re paying attention, I see!
In this case, you’d have to learn how to use trend lines on breakout trades…
…which leads me to the second concept!
How to use trend lines to enter breakouts
I know that I’ve been teaching you how to use trend lines to objectively look at trends.
But this time…
I’ll teach you how trend lines can also be used to objectively look at pullbacks!
(to keep things simple, I’ll keep calling them trend lines instead of “pullback lines”)
So, if you’re in an uptrend…
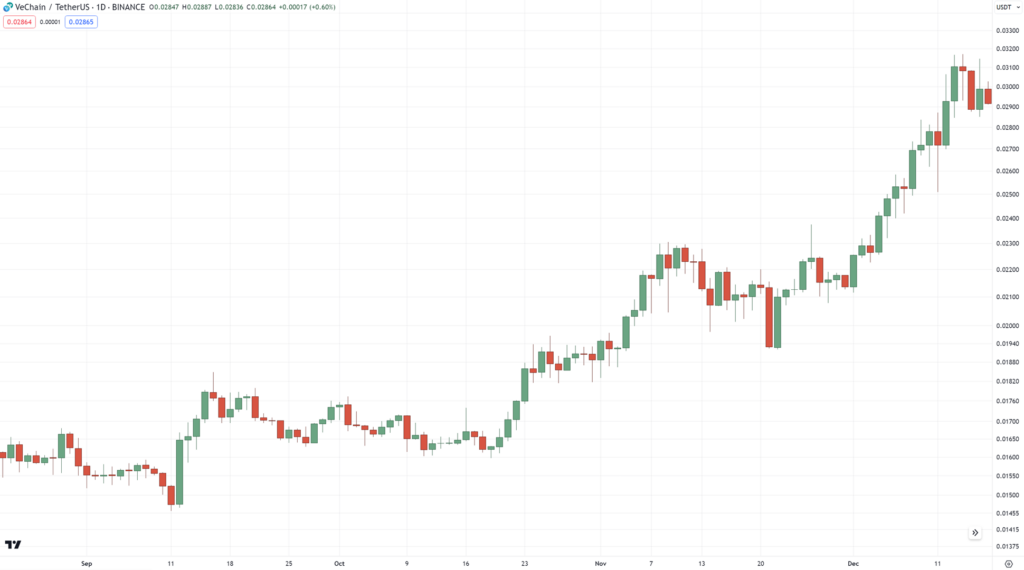
Place your trend line at the highs of the pullback…
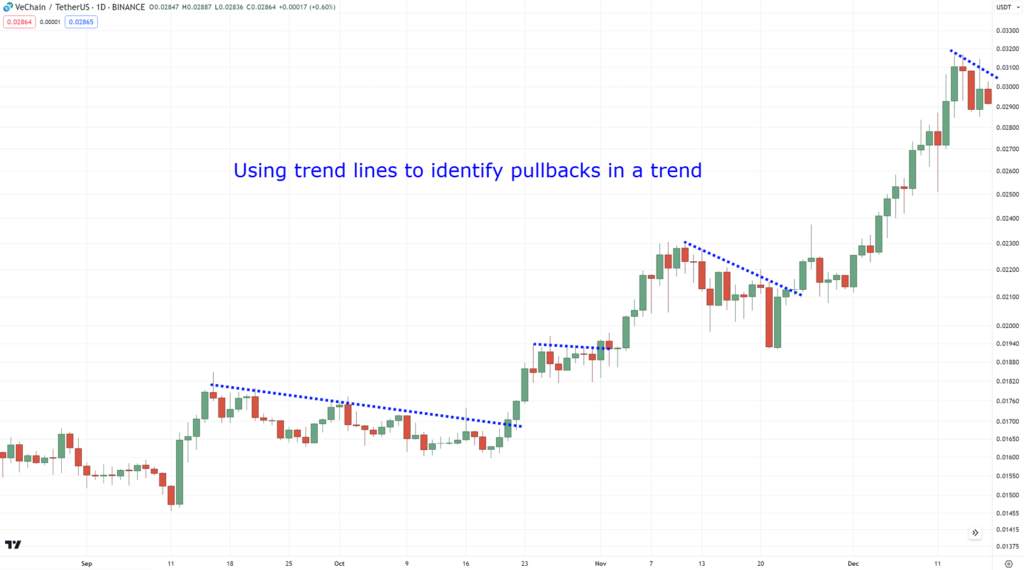
(Mind you, pullbacks can come in different shapes and sizes, as well as trends!)
…and the moment it makes a bullish close…
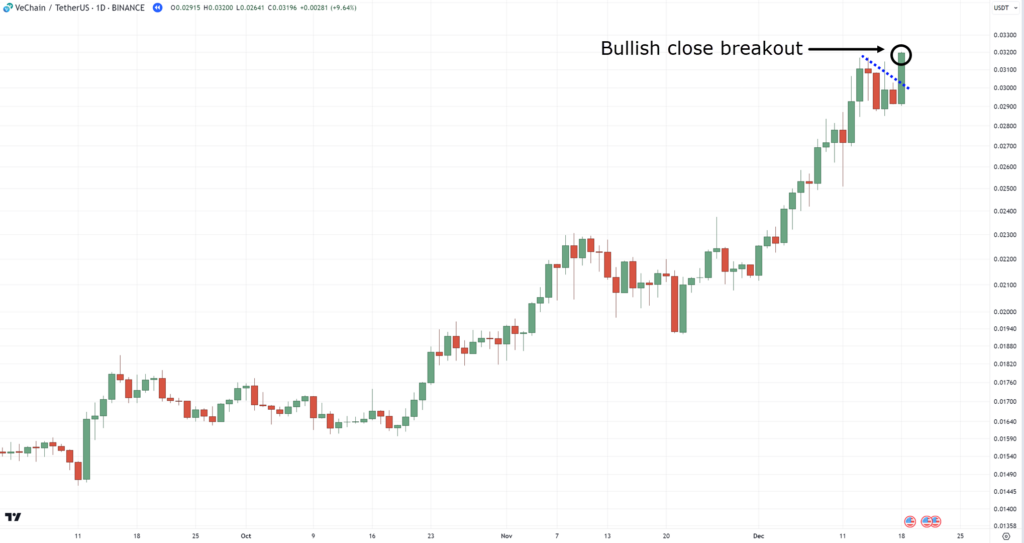
…then it’s a breakout!
So – what you do next is – enter the next candle!…
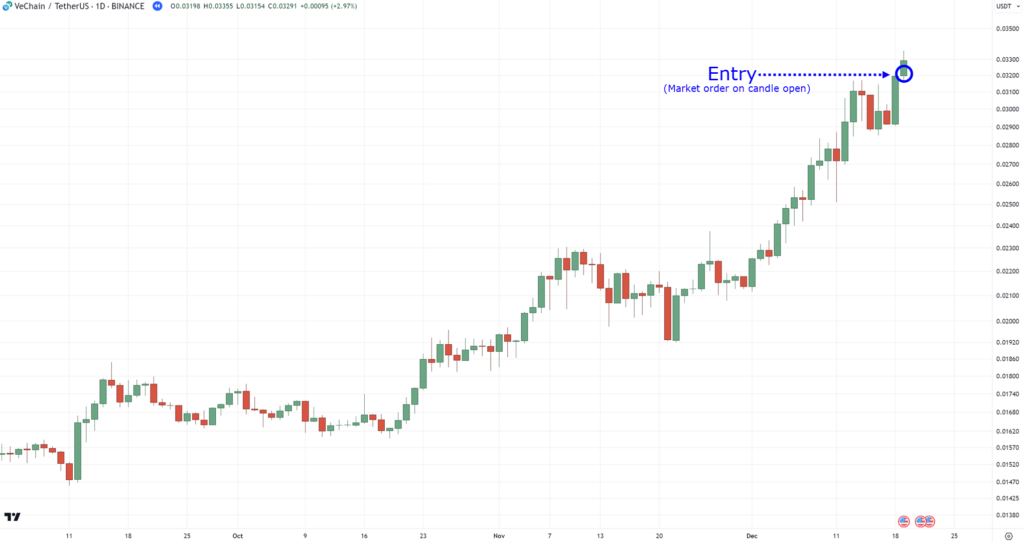
Again!
Similar to plotting trends, it can take some time to nail down plotting trend lines on pullbacks as pullbacks can vary….
Nevertheless, mastering this will give you the ability to find opportunities both in pullback and breakout!
Alright – how about I show you some exits?
How to use trend lines to take your profits
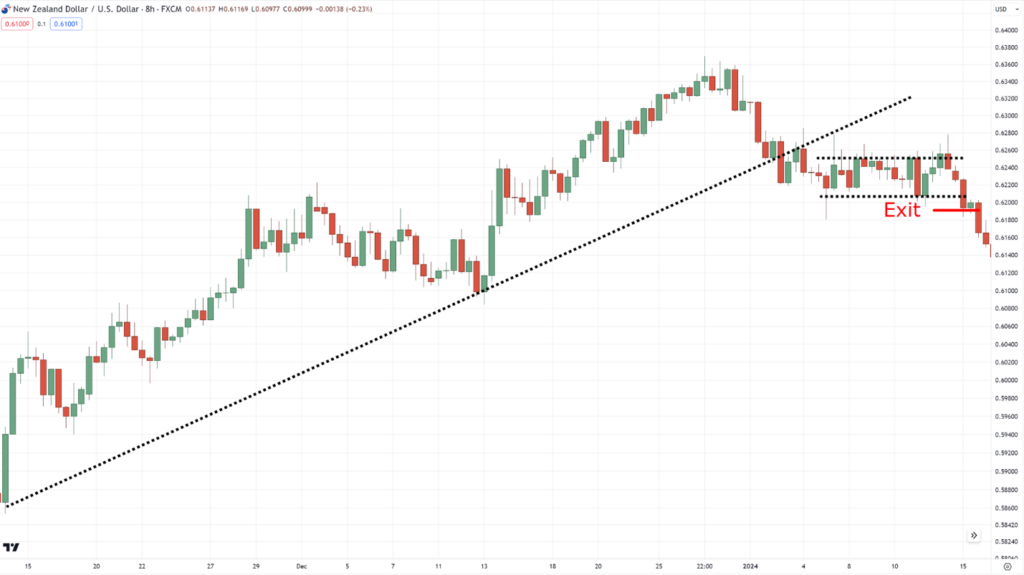
Remember the trend reversal setup I showed you a while ago?…
Good!
Because, assuming you’re in the trade, we don’t want that flag pattern.
That would take up a lot of time and plenty of hurt!
Instead, once the price closes below your trend line…
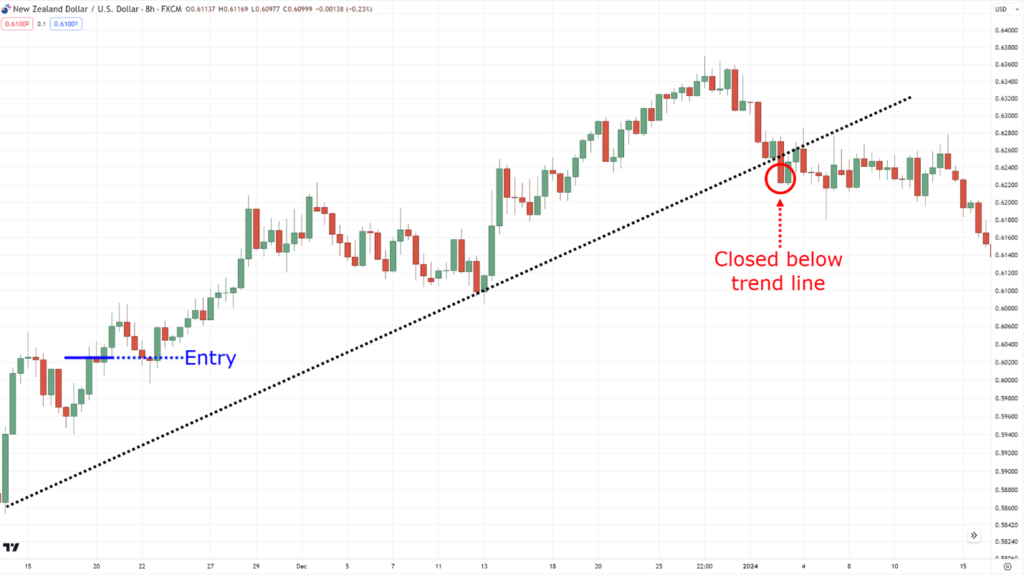
…then you exit at the next candle open!…

In the last section, I’ll teach you how you can improve on this.
But – essentially – that’s all there is to it!
You now know how to use trend lines to help enter and exit your trades!
So, now that you know how versatile trend lines can be in your arsenal…
It’s crucial you understand how NOT to use trend lines.
Because, as your coach, I’m not here to hype you up with fancy concepts and strategies…
It’s my job to help you use these ideas properly!
How to use trend lines the WRONG way (avoid doing these)
Let’s get straight to the point…
The number one sin in learning how to use trend lines is to plot too much….
Plotting too many trend lines:
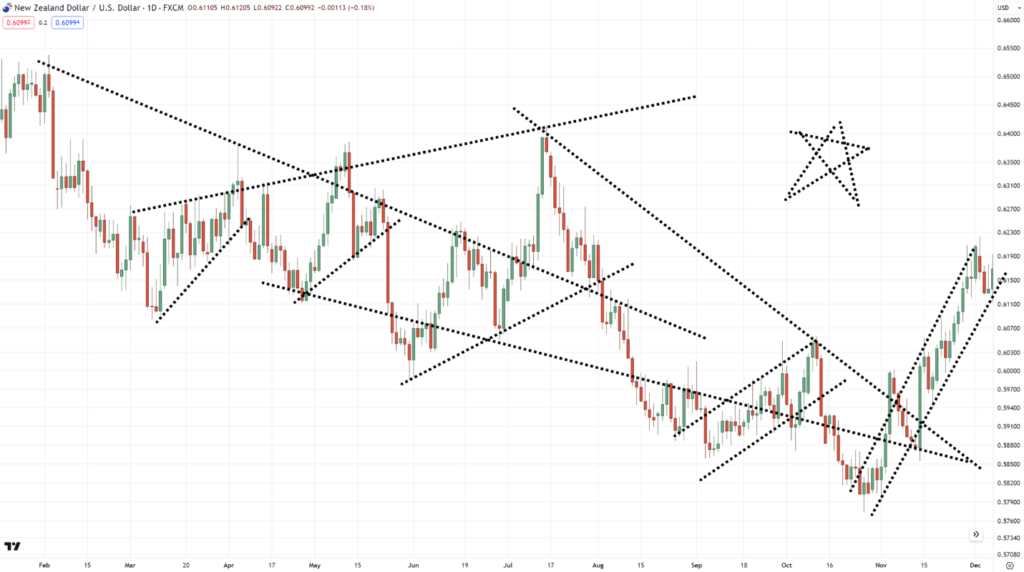
That’s a LOT of noise!
I know that it’s exaggerated, but you get my point.
So… how many trend lines should you put in your chart?
Usually, not more than three.
Why?
Because you’d only want to put trend lines that are relevant to the current price!…
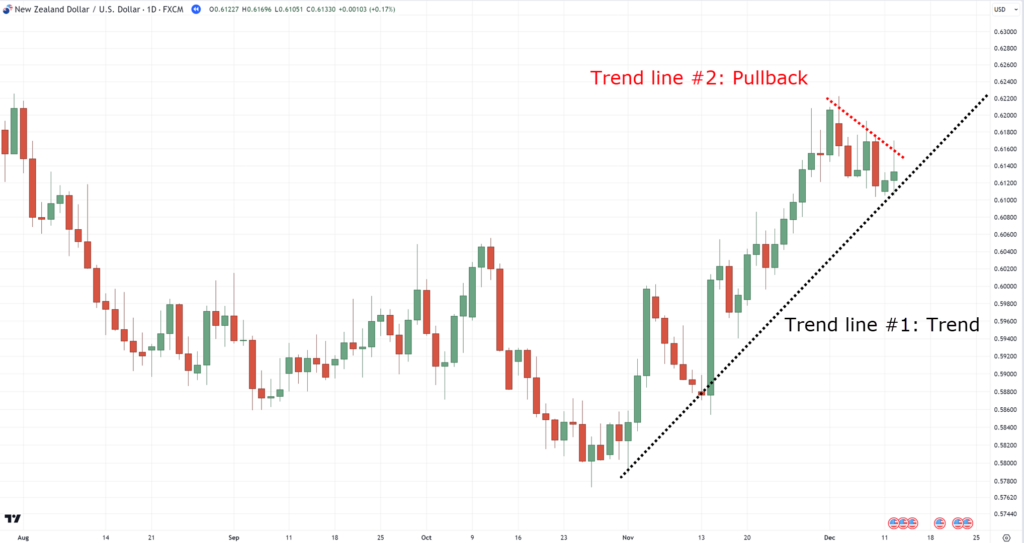
As you can see, we have one trend line identifying the trend, and another identifying the pullback.
That’s two, and each with a well-defined purpose!
So basically…
You’re free to plot as many trend lines as you like… AS LONG AS:
- It’s relevant to the current price
- You can use the information on those trend lines to manage your trades better
Don’t overplot!
Now, the next thing you should not do with trend lines is…
Treating trend lines as a single line on your chart
This concept changes everything!
Because the reality of the markets means that everything is an area on your chart.
So, it pays to see trend lines like this…
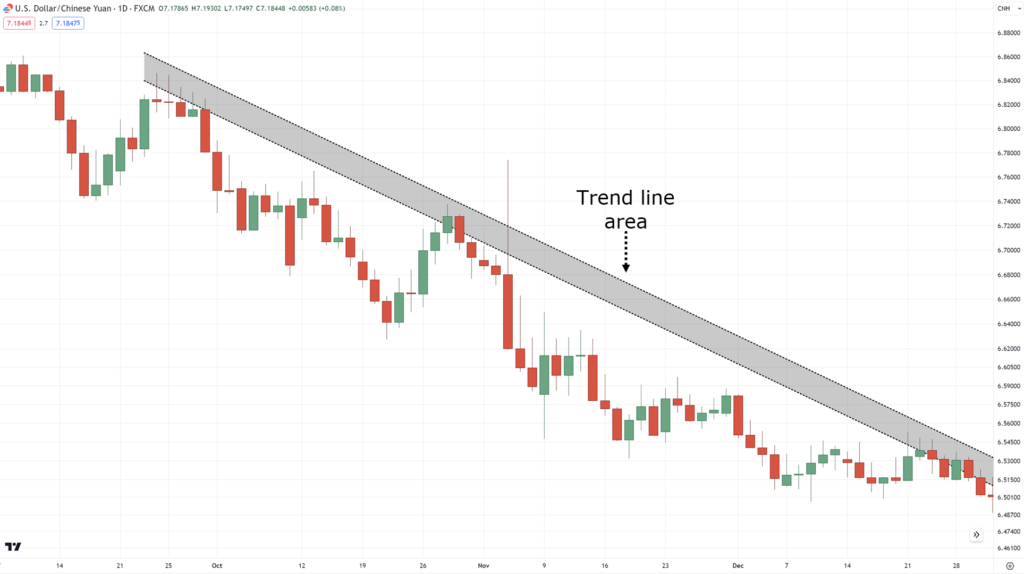
Because sometimes, the market doesn’t align with (or is too late to align with) the drawings on your chart!
But the moment the market “reacts” to your trend line-area…
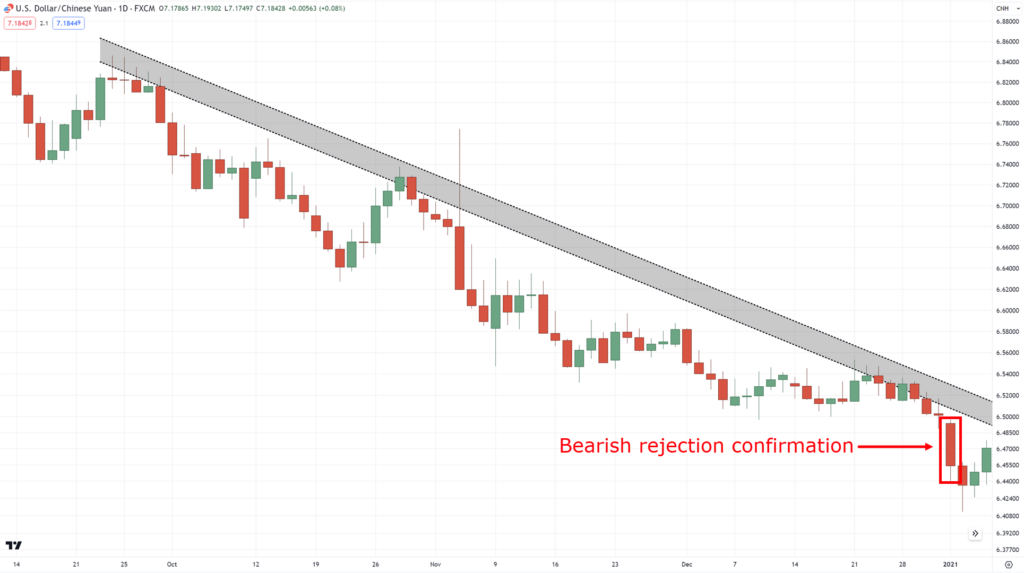
Then that tells you the market has conformed to your trend line!
This approach is another way that you can improve your entries in the market.
By treating trend lines as “areas,” you give enough room for the market to react to your trading ideas.
Got it?
OK – then let’s do a quick recap of what you’ve learned today!
Conclusion
Learning how to use trend lines is probably the first thing you learn when it comes to technical analysis.
But as your trading years go by, you realize how relevant and useful the trend line is…
…even if it’s such a simple tool!
At any rate, here’s what you’ve learned today:
- A trend line works by simply showing the areas of value in different types of trends
- Use swing slows to plot trend lines in an uptrend and use swing highs in an uptrend
- A trend line can determine if a trend is strengthening or weakening depending on the slope of its swing highs/lows
- You can enter pullbacks using trend lines by waiting for the third touch or more
- You can also enter breakouts if the price makes a breakout beyond the pullback
- Only plot trend lines relevant to your trades, and always treat trend lines as an area on your chart
…and there you go!
A complete guide on how to use trend lines!
So now, it’s your time to share.
Have you used trend lines before?
If so, how did it help you in your trading?
Or perhaps you have a better tool in mind besides the trend line?
Share your ideas with me in the comments below!


