It’s a fact that almost all traders start craving the lower timeframes.
At first, it seems like an easy way to make a quick buck…
…to start raking in those big wins…
…and fulfil your dream of making trading your main source of income!
But then, what usually follows?
Losing streaks begin…
…accounts are potentially blown up…
…you become completely mentally drained!
Eventually, you start to “outgrow” seeking lower timeframe profits and start moving into higher timeframes.
But what if you decided to give lower timeframe trading one more shot?…
…to really grasp the techniques needed to trade on the 1 hour timeframe?…
Do you think it could be worth it?
I certainly do!
That’s why in today’s guide, I’ll show you exactly how to trade price action in the 1 hour timeframe.
Specifically, you’ll learn…
- What specific price action setups you should be looking for on the 1 hour timeframe
- What you need to look out for on the daily timeframe before trading the 1 hour timeframe
- A step-by-step process on how to trade price action in the 1 hour timeframe
- The “unheard” trading tips to succeeding trading the lower timeframes
Ready?
Then let’s get started.
How to trade price action in the 1 hour timeframe: What price action setups should you be looking for?
I’m sure you have a lot of burning questions right now…
“What setups do we trade?”
“How long should a trade last?”
“Do I need to watch the charts every single hour?”
Don’t worry, my friend.
Because I’ll answer all of those in the following sections.
For now, let’s start with the basics and then work out the details.
It’s crucial to know the context and the “why” of each concept until eventually, it all comes together.
Sound good?
So, at this point…
There are a ton of videos and guides on how to trade price action, such as these:
The Price Action Trading Strategy Guide
And I agree, price action is really a broad topic to cover!
That’s why in this guide, instead of feeding you the basics of price action like a baby…
I’ll share the essential three setups you need to succeed in trading on the 1 hour timeframe.
Let’s begin with the first one…
Break of structure
Just as the illustration shows you…
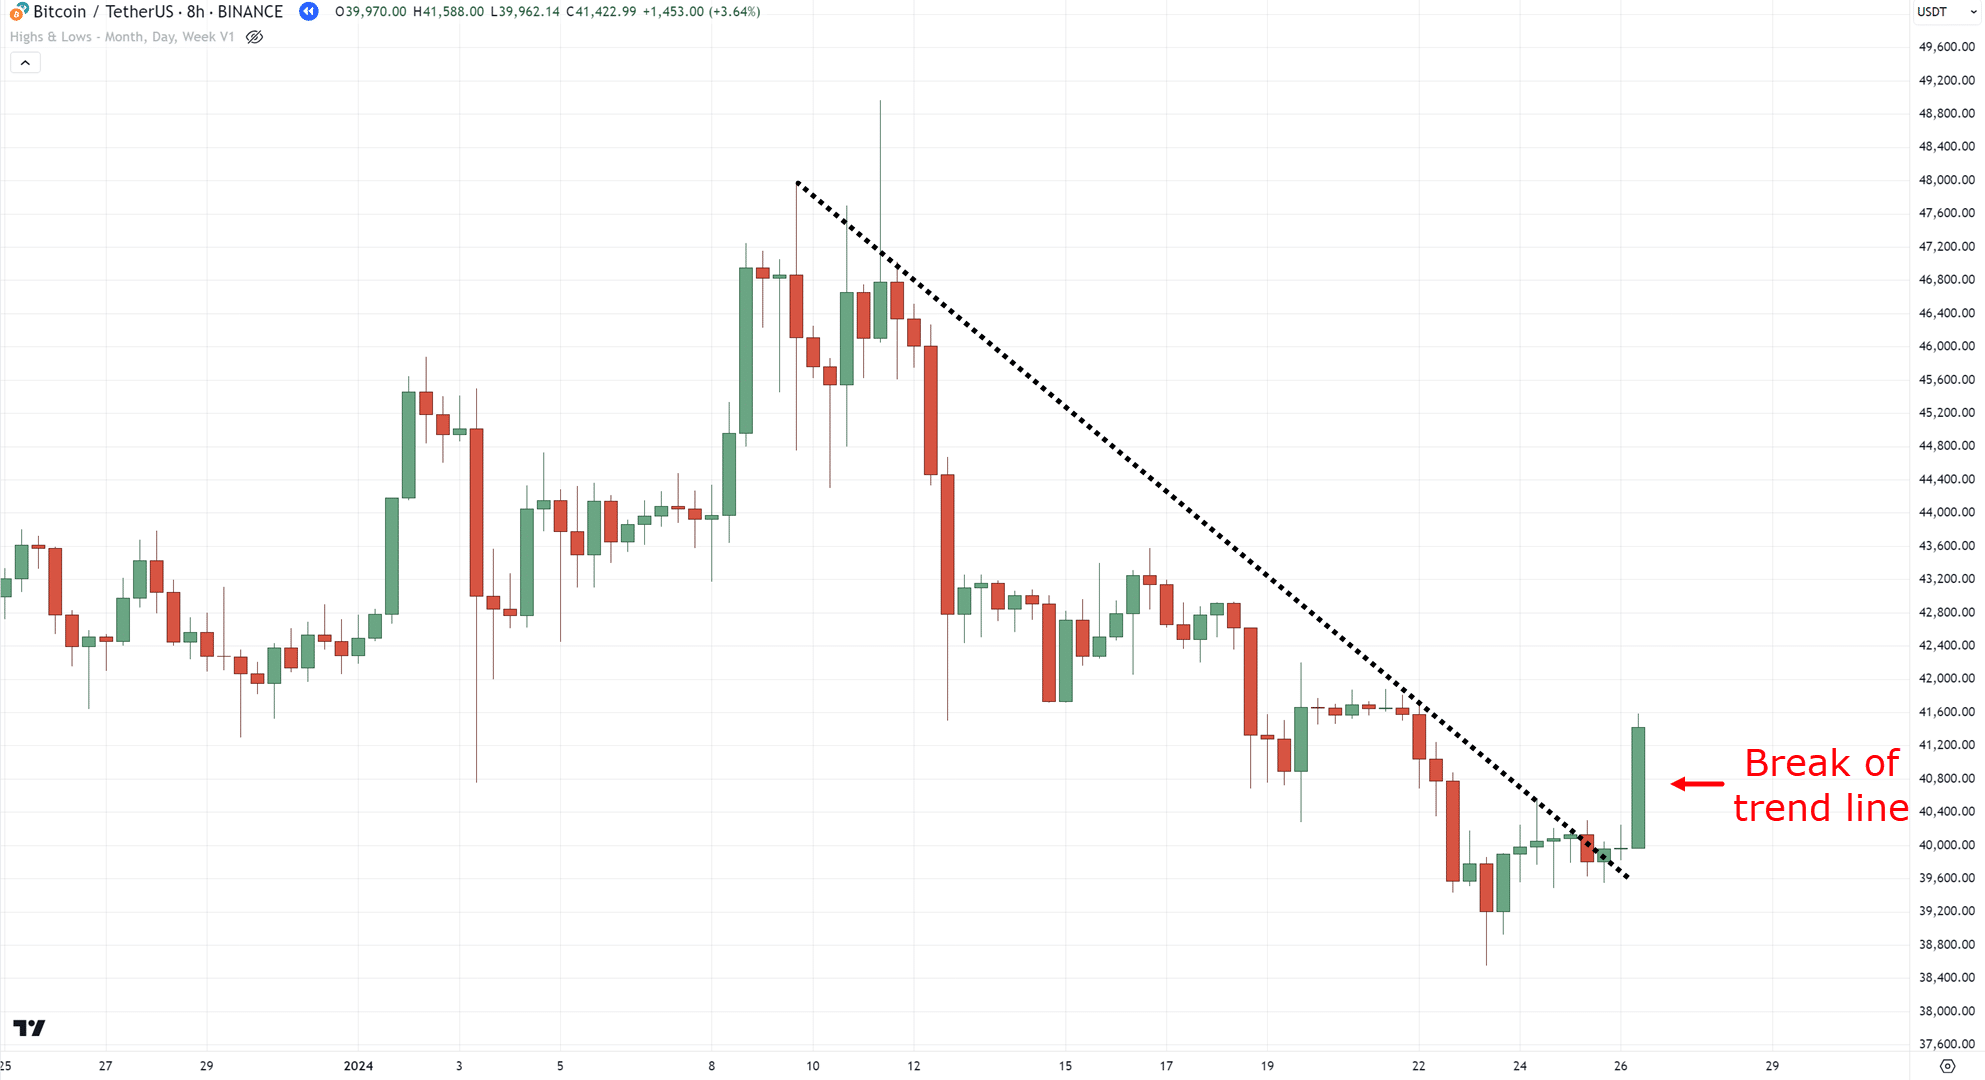
This setup is a 3-step process.
First, the price must break above a trend line area of value…
Second, the price must make a flag pattern or a consolidation…
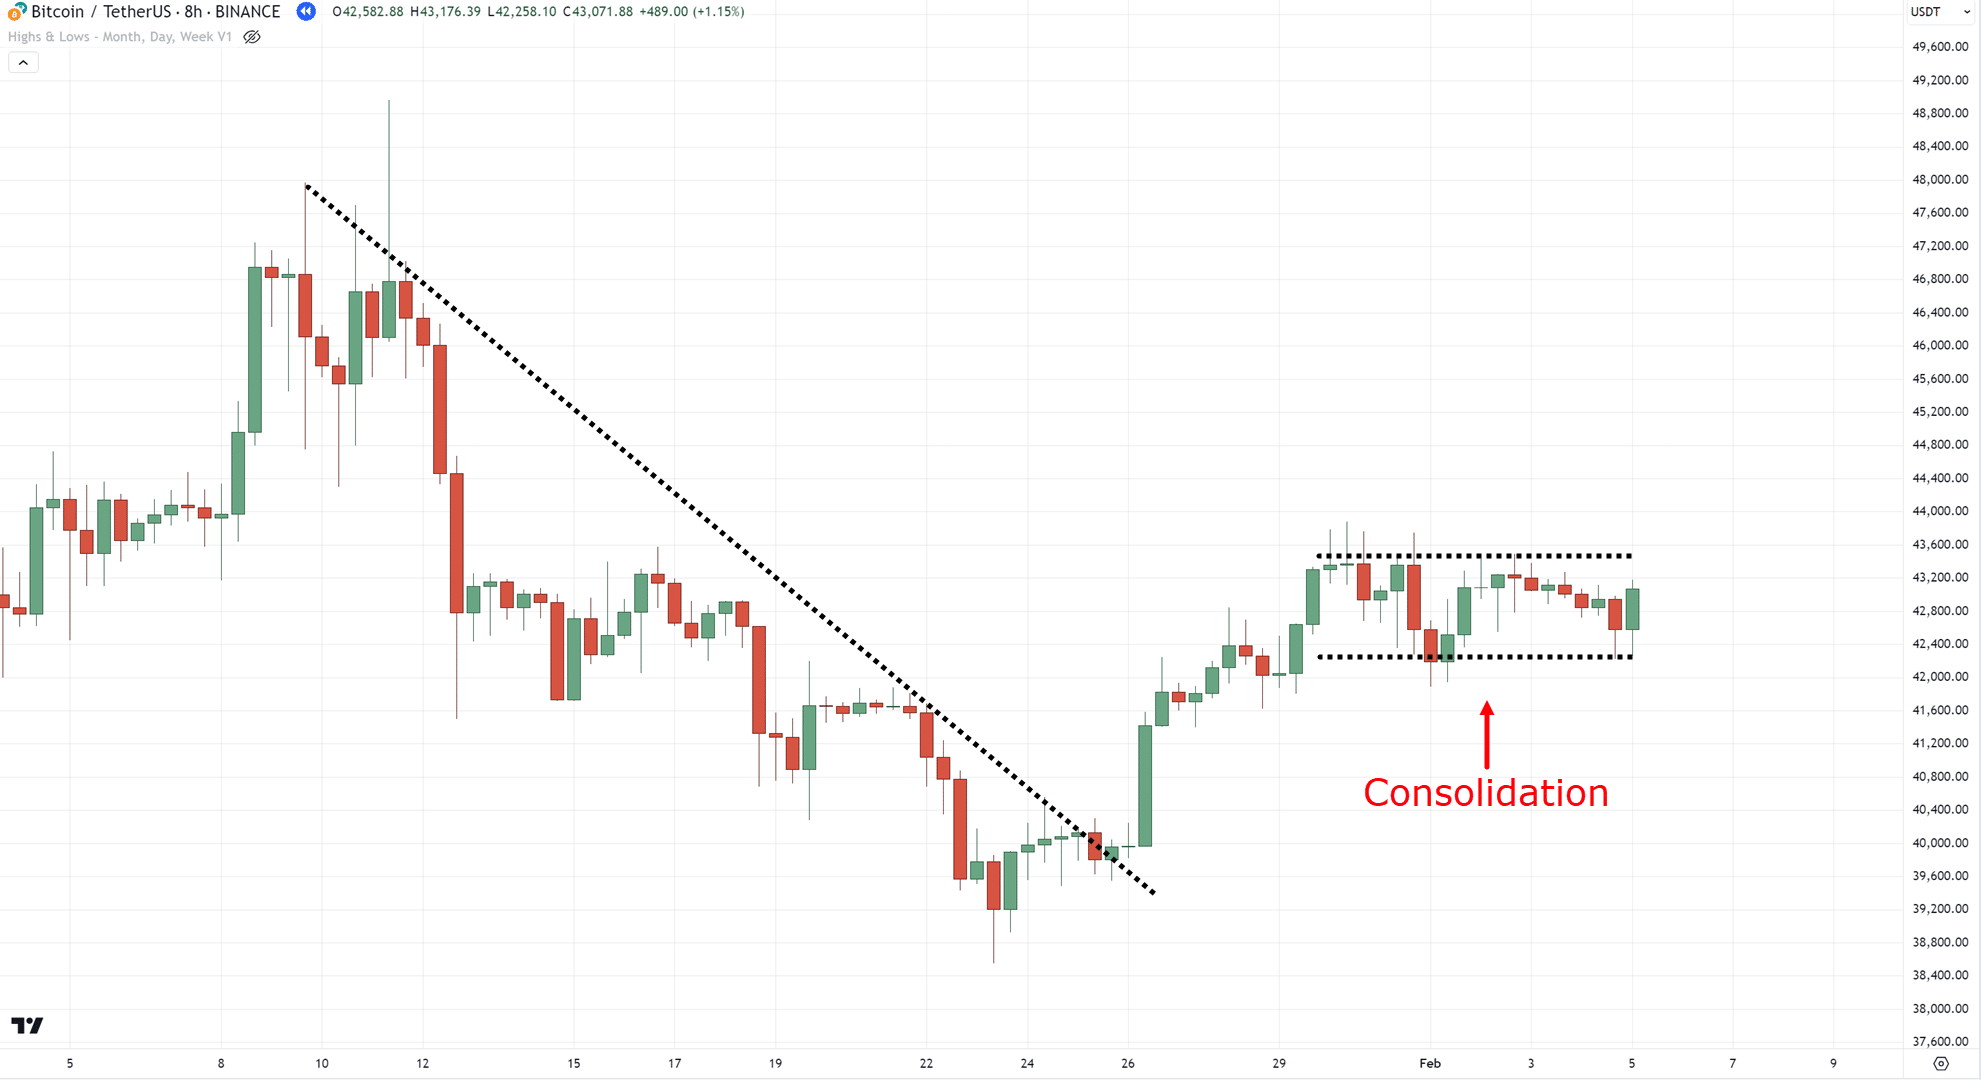
(Make sure you always remember that the second step is the most crucial to this setup!)
Third, the price must break out from that flag pattern…
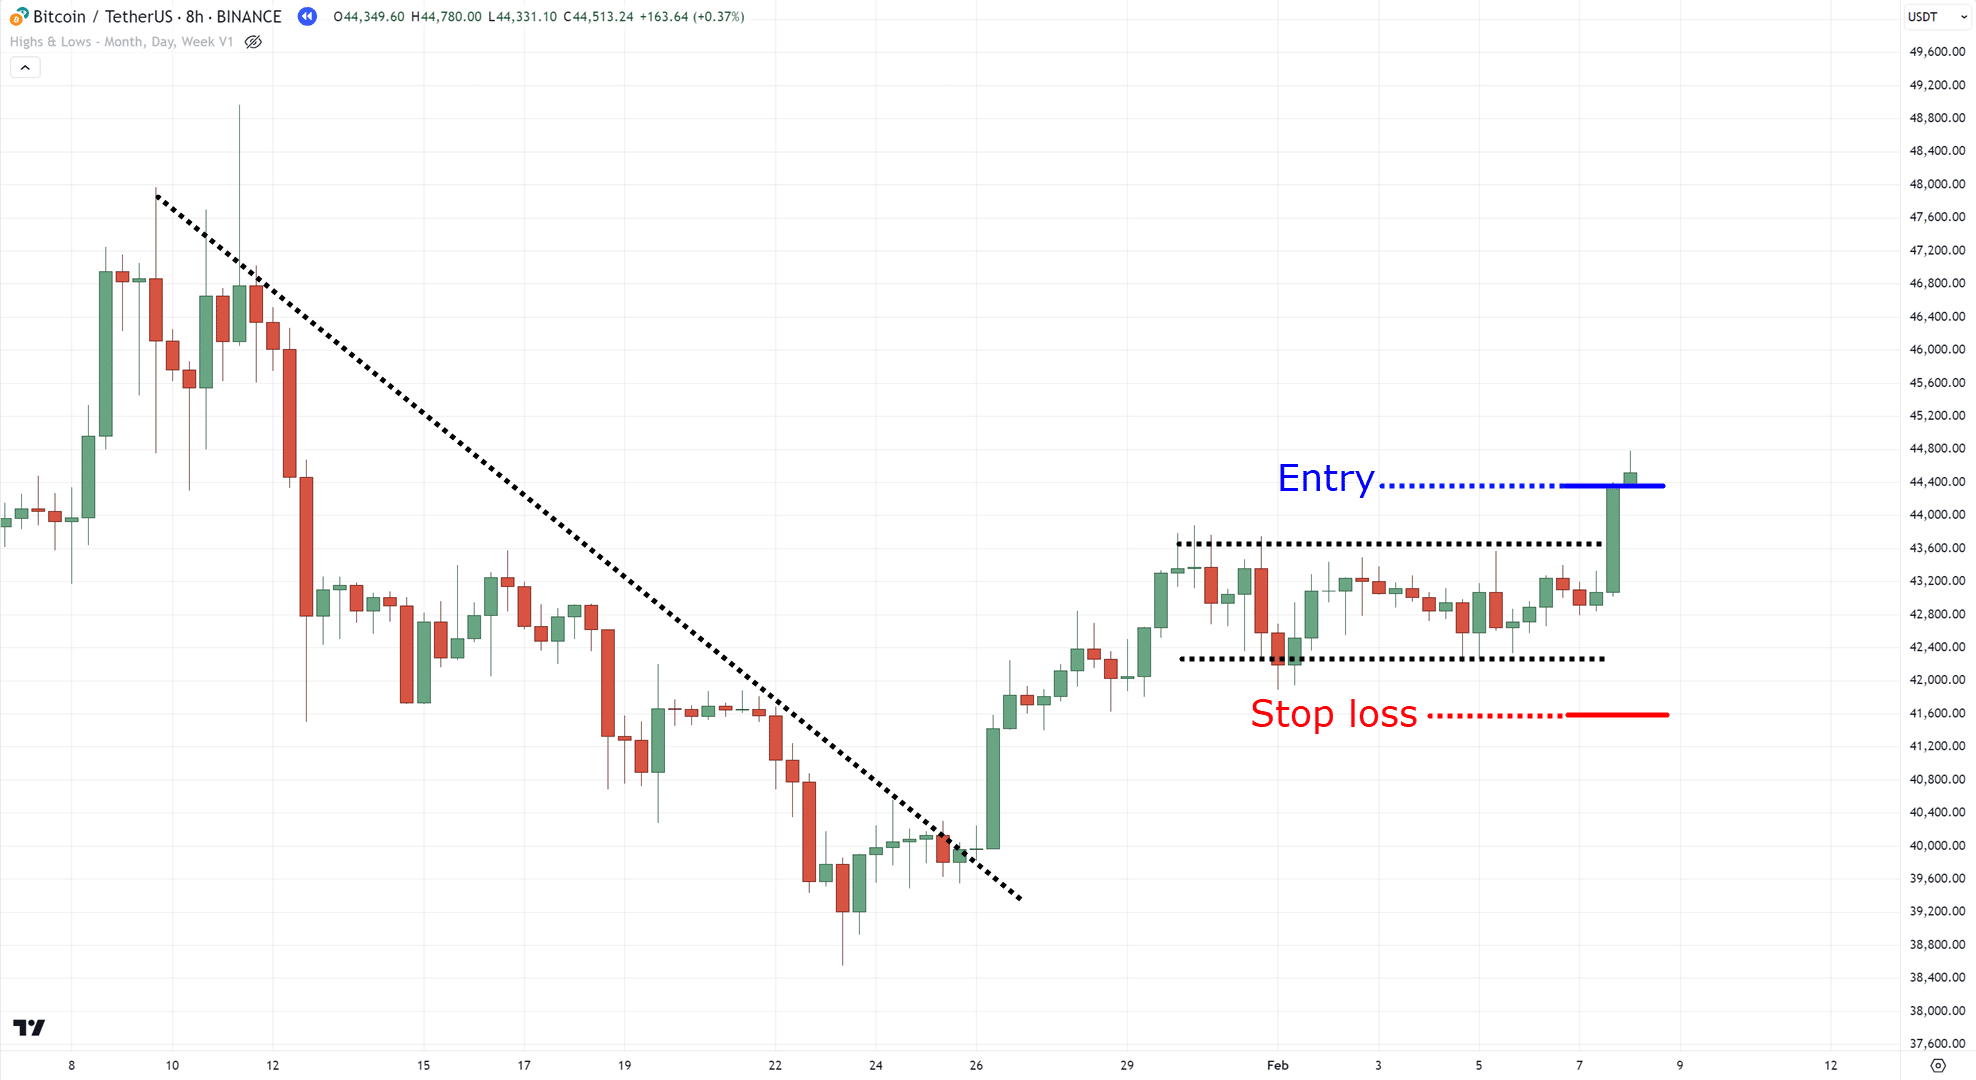
It’s here that our entries lie, as you have to wait for the candle to close beyond the flag pattern before entering the trade.
Now, you might be thinking…
“Why this setup?”
Good question!
And the answer is more simple than you’d think.
This setup not only detects market reversals but also gives you the opportunity to ride that reversal without “chasing” the market.
Check out this example of the price approaching a major area of resistance…
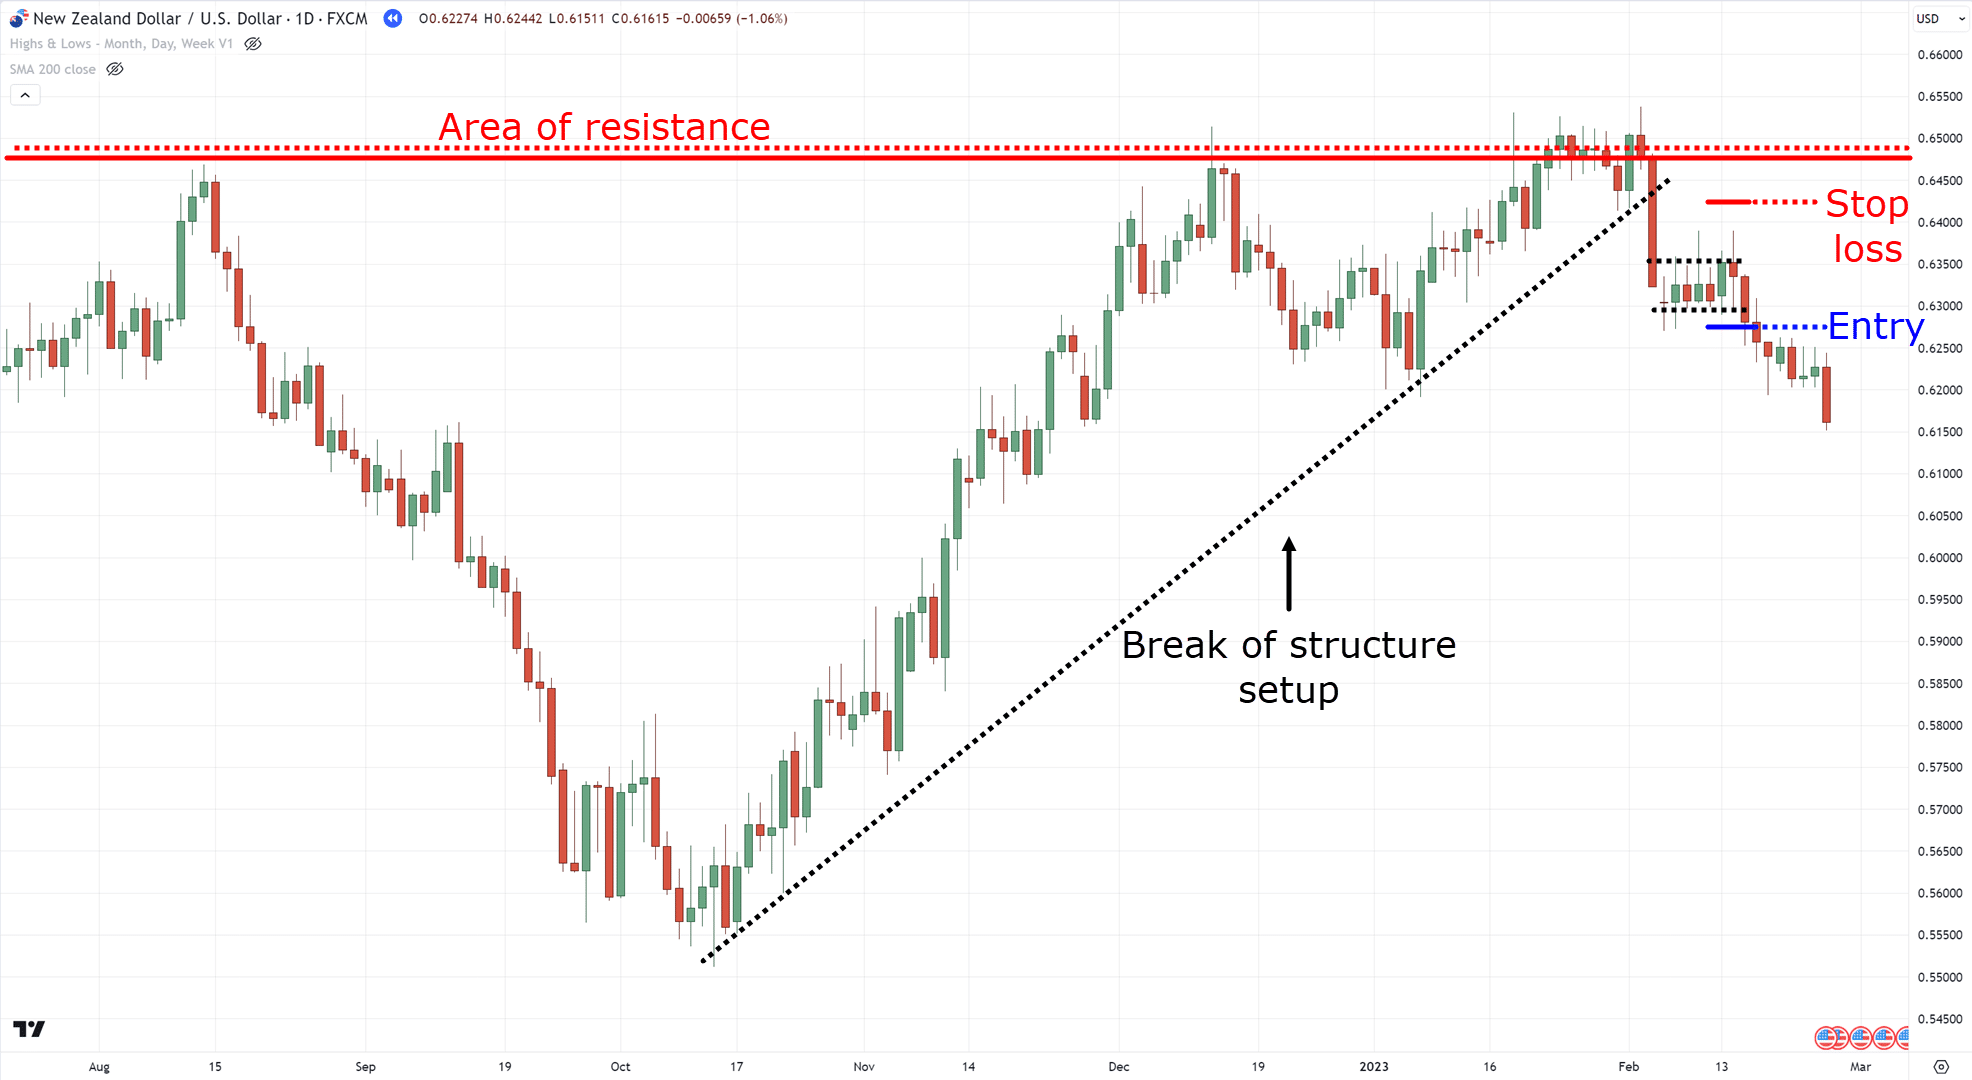
Can you see it?
Now, the second setup is something you might already be familiar with…
Buildups
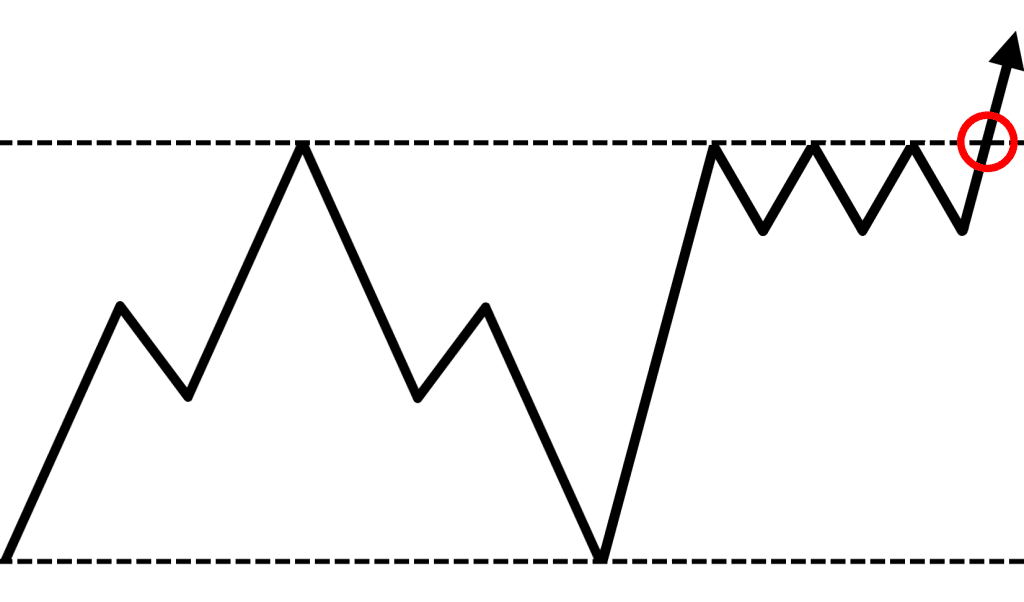
What does this mean?
Well, it’s about waiting for a flag pattern at an area of value.
Can you see a flag pattern hovering at resistance?…
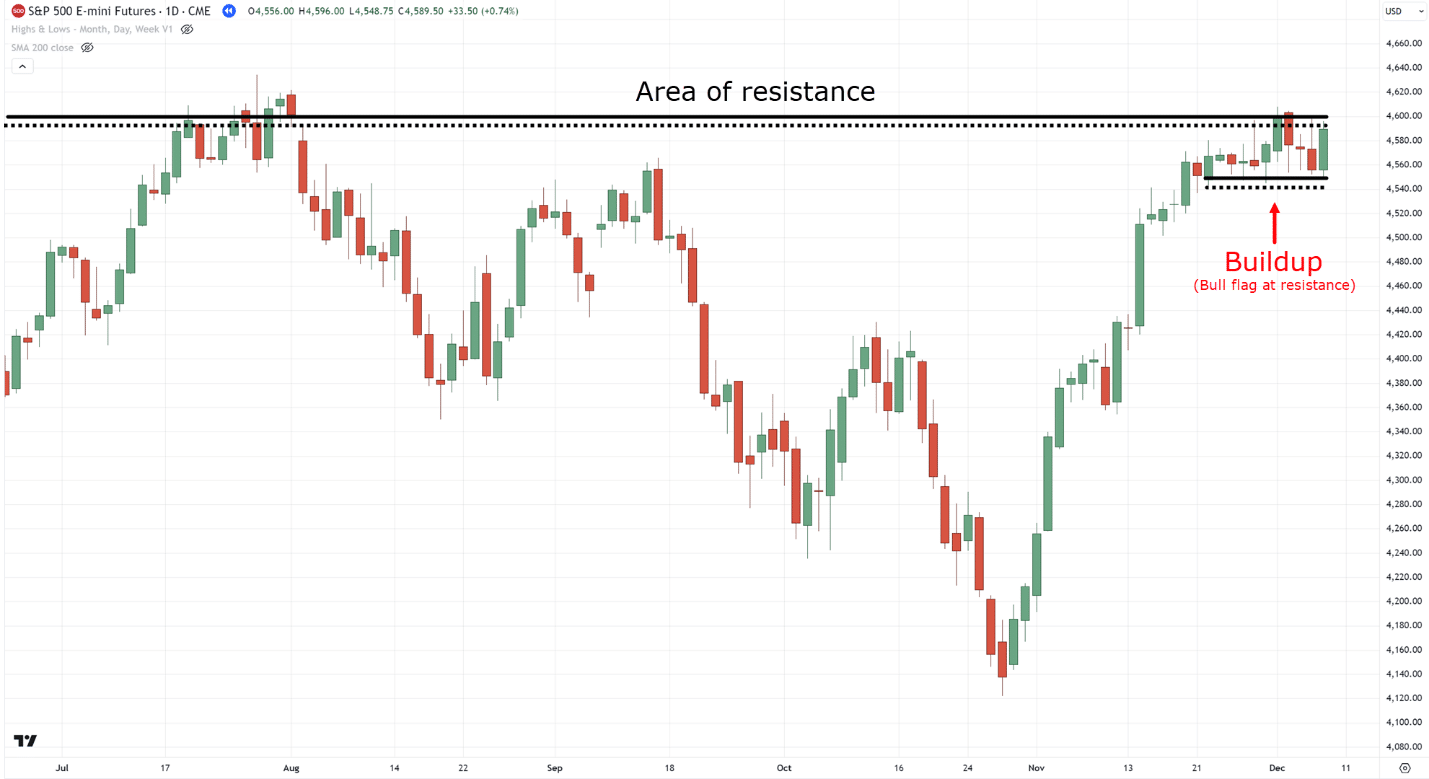
Good, because it shows that the buyers are already at the gates – about to break them open!…
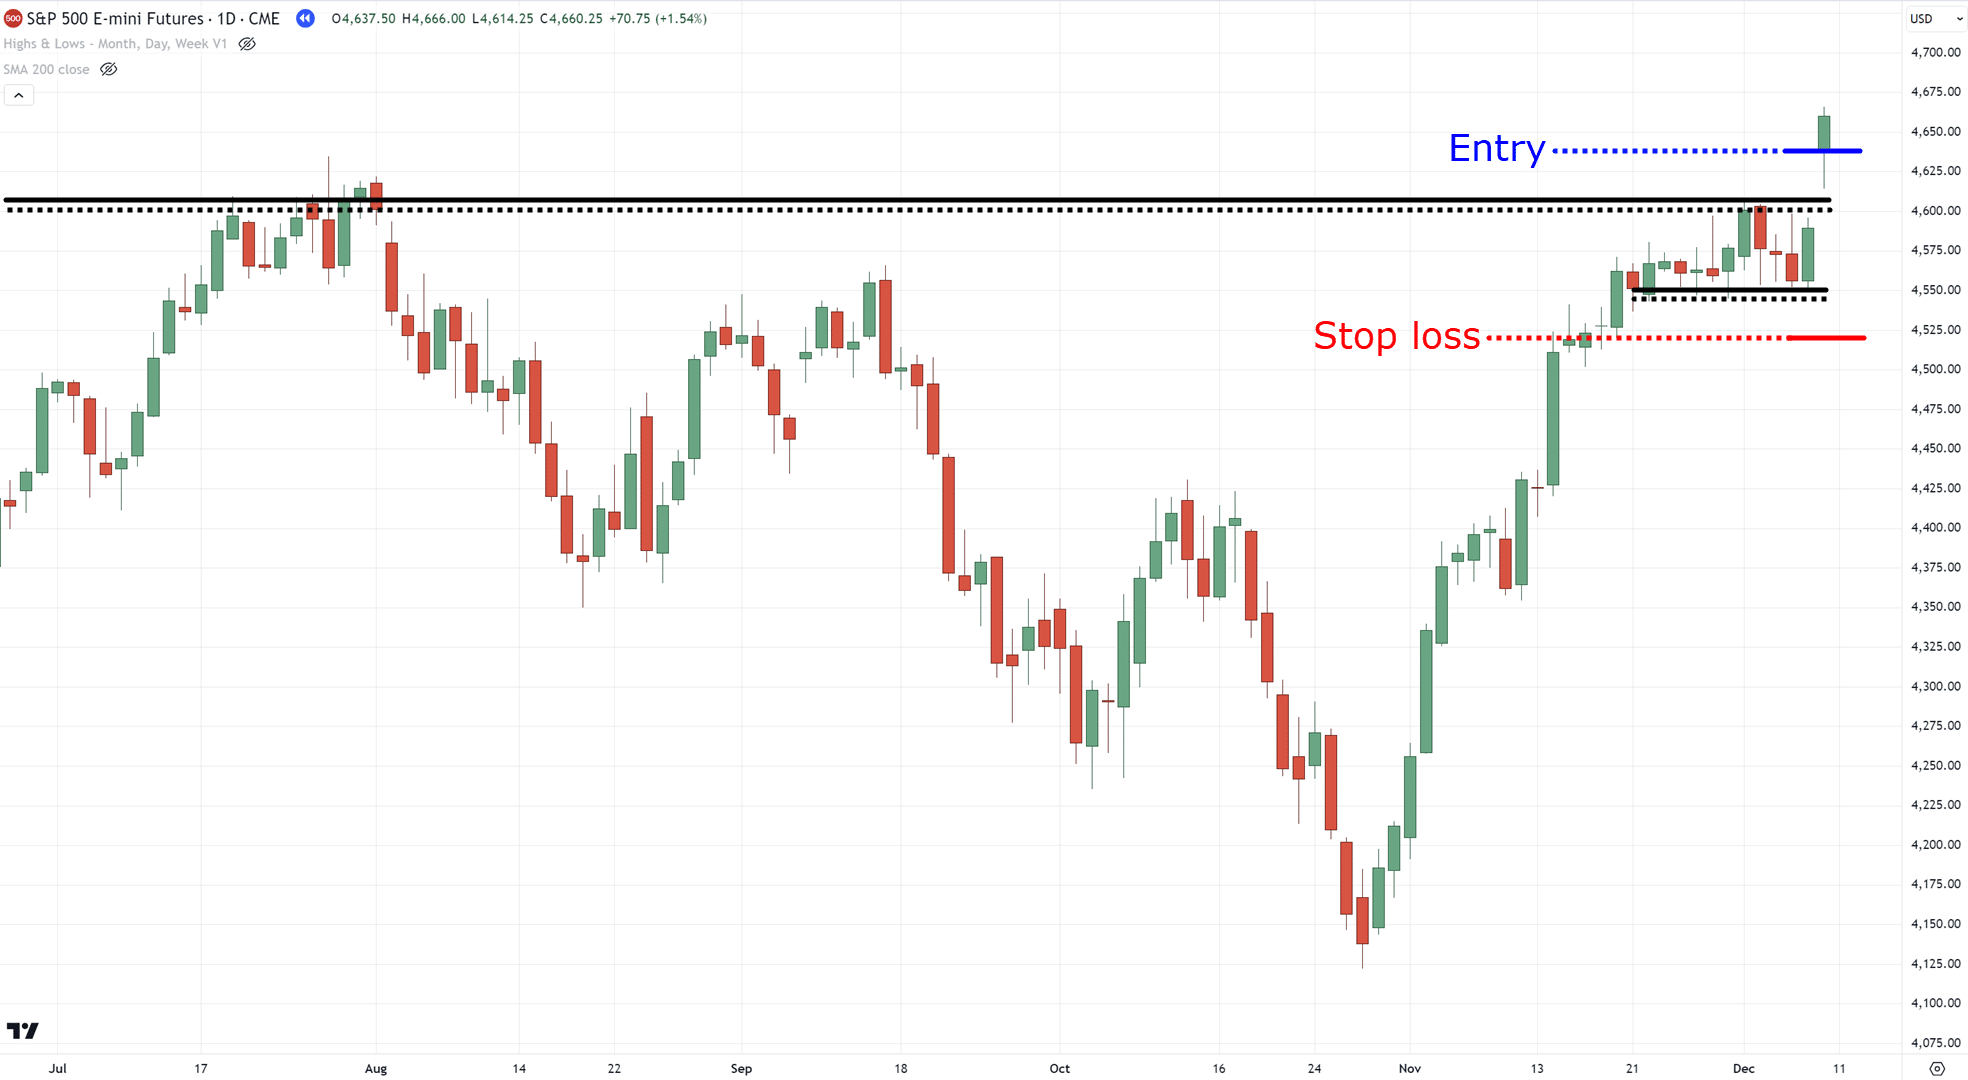
A truly bullish setup!
It’s actually the same as waiting for a “buildup” at the area of support, just in the opposite direction…
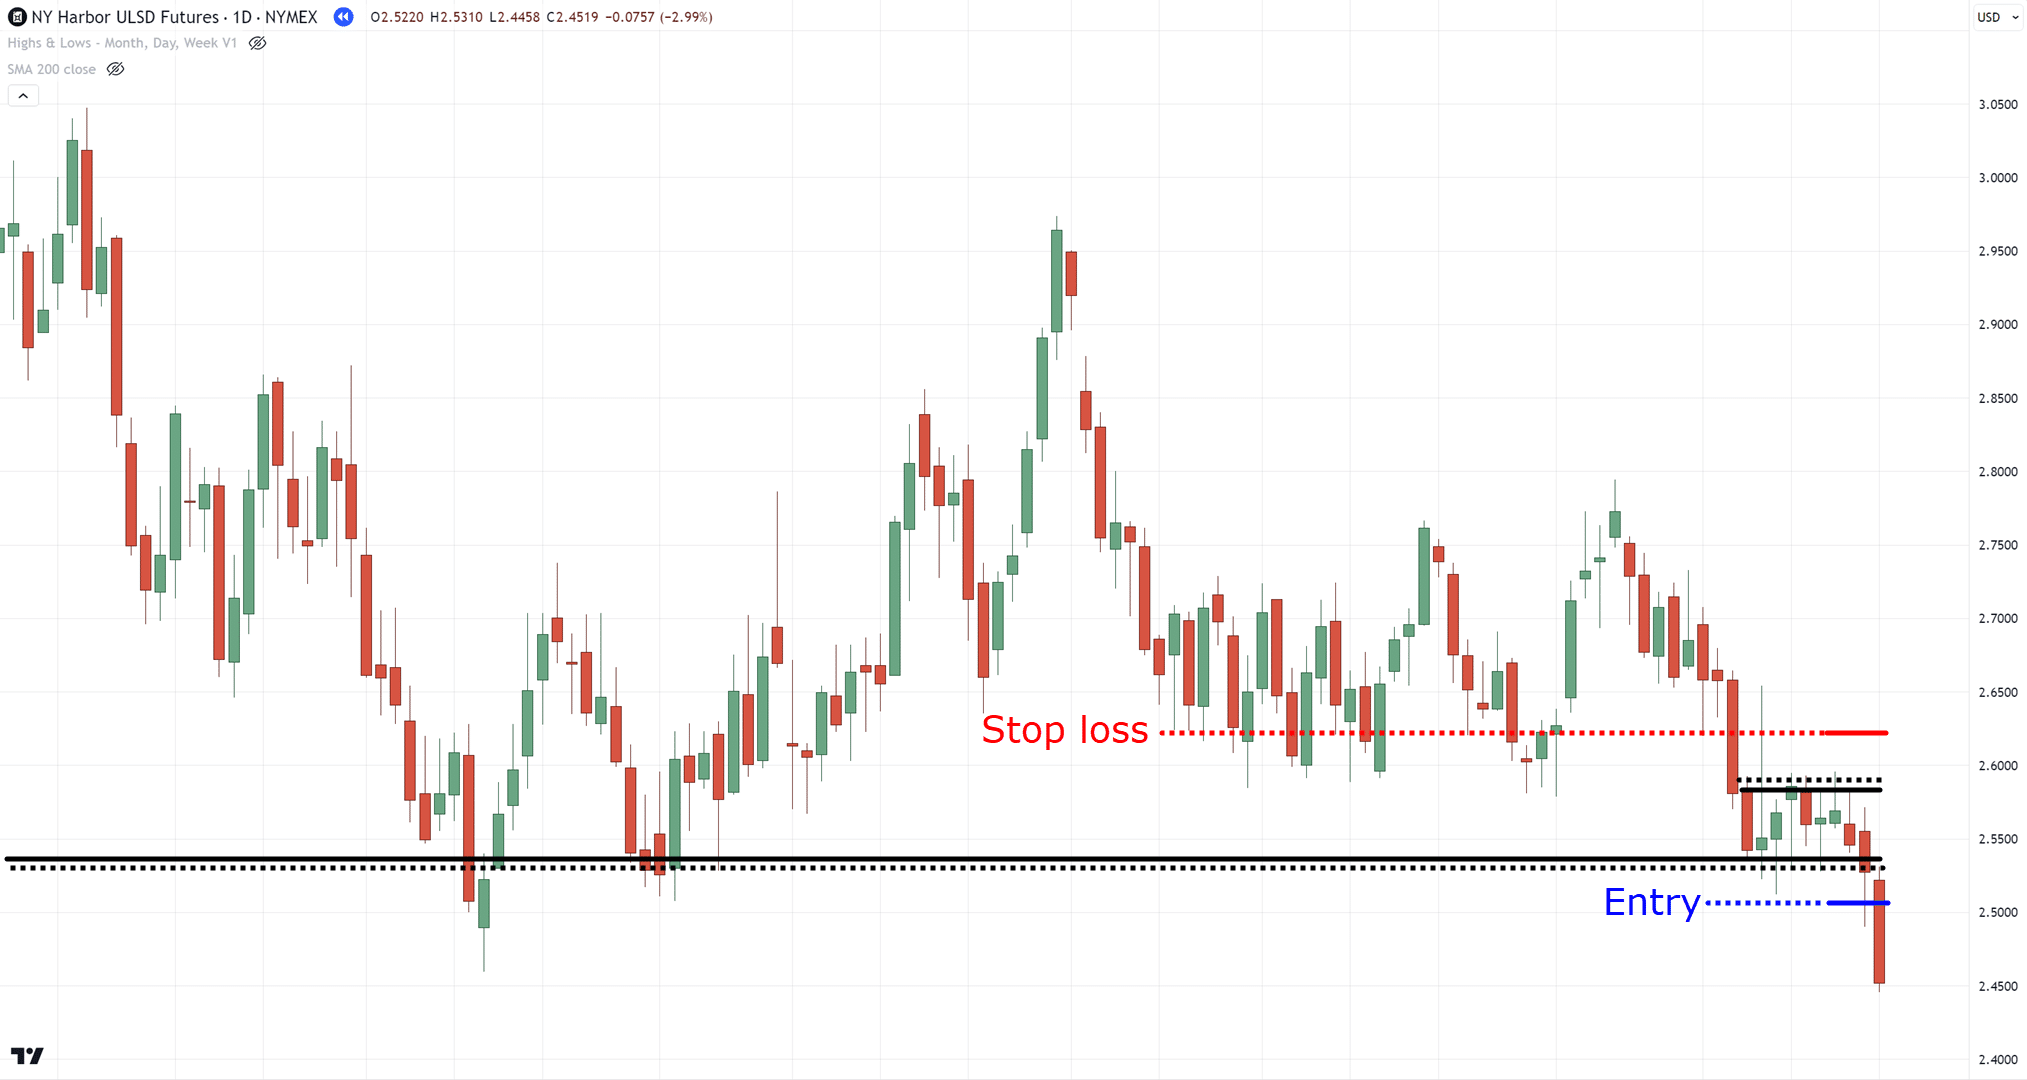
Make sense?
Alright, then why this setup?
The main reason is that by waiting for a buildup, you avoid being “prey” to false breakouts most of the time, as you let the market play its hand first by showing a buildup!
Got it?
Lastly, we have…
Trend Continuation
Whenever there’s a bear market or a choppy market, trading the markets becomes difficult, right?
Tons of false signals!
Lots of “market manipulation!”…
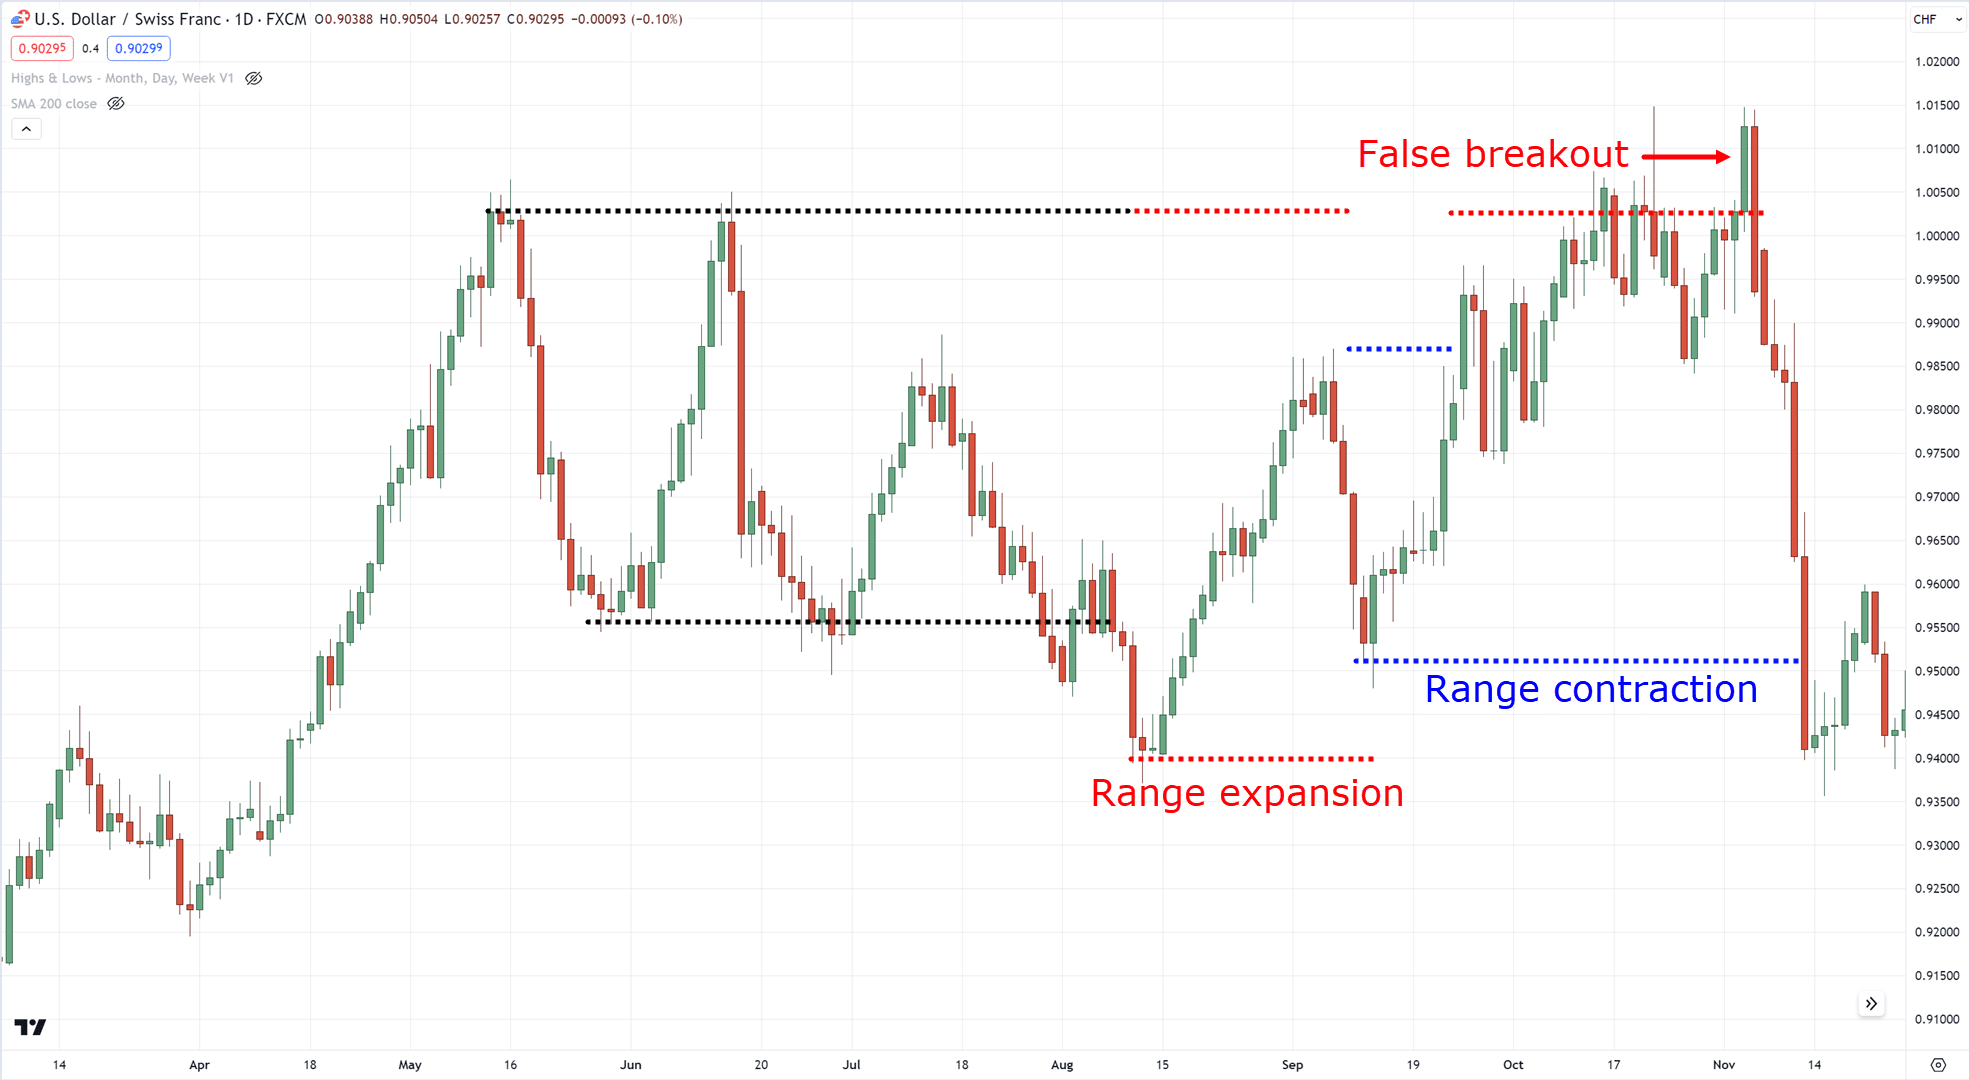
But once there’s a trend in play?…
Everything seems so simple!
It’s these market conditions that are the most ideal to trade.
However, no matter how far the trend goes, you always must enter objectively, such as by waiting for a flag pattern…
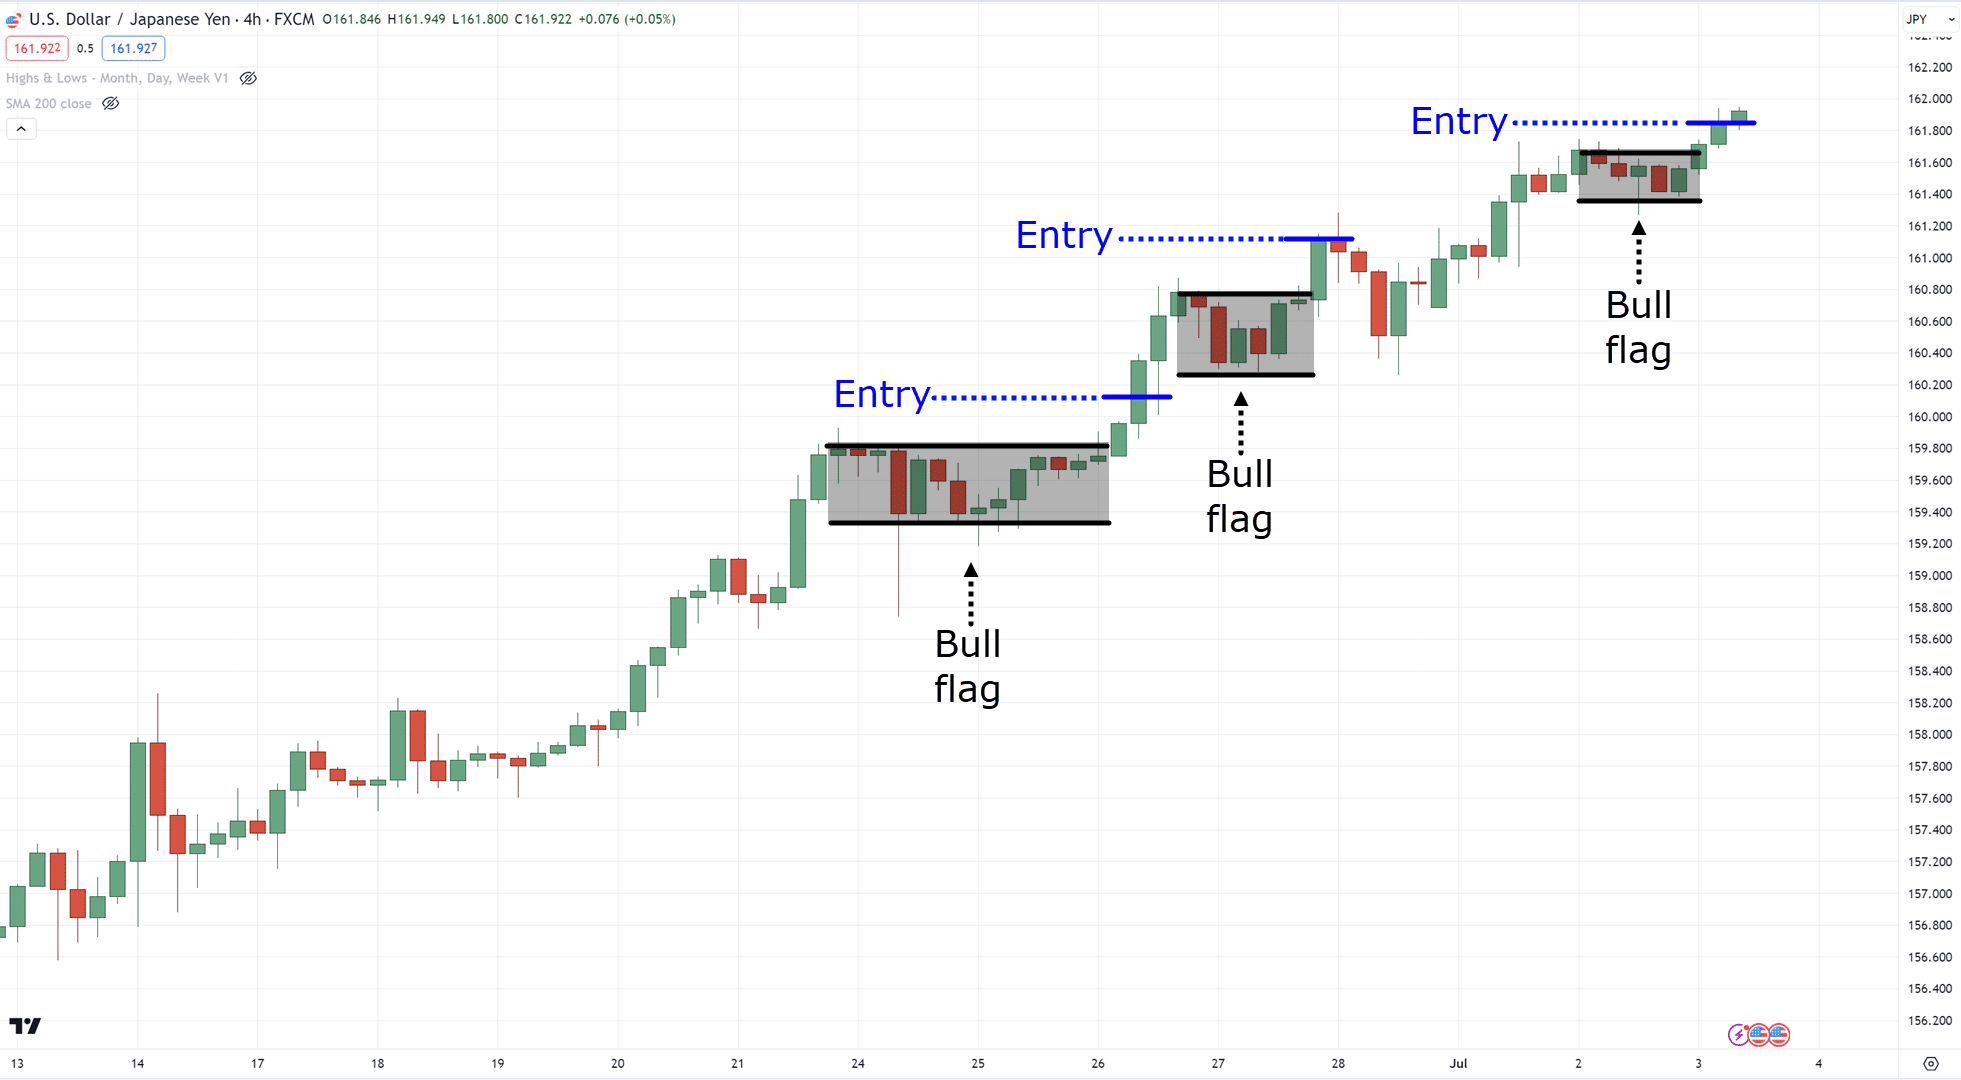
Simple trend, simple setups!
At this point, I’m sure you realize that we’re trading a bunch of flag patterns.
And you’re correct!
As simple as they are, flag patterns offer you the most objective way to enter the markets.
But most of all, they allow you to have a better risk-to-reward ratio.
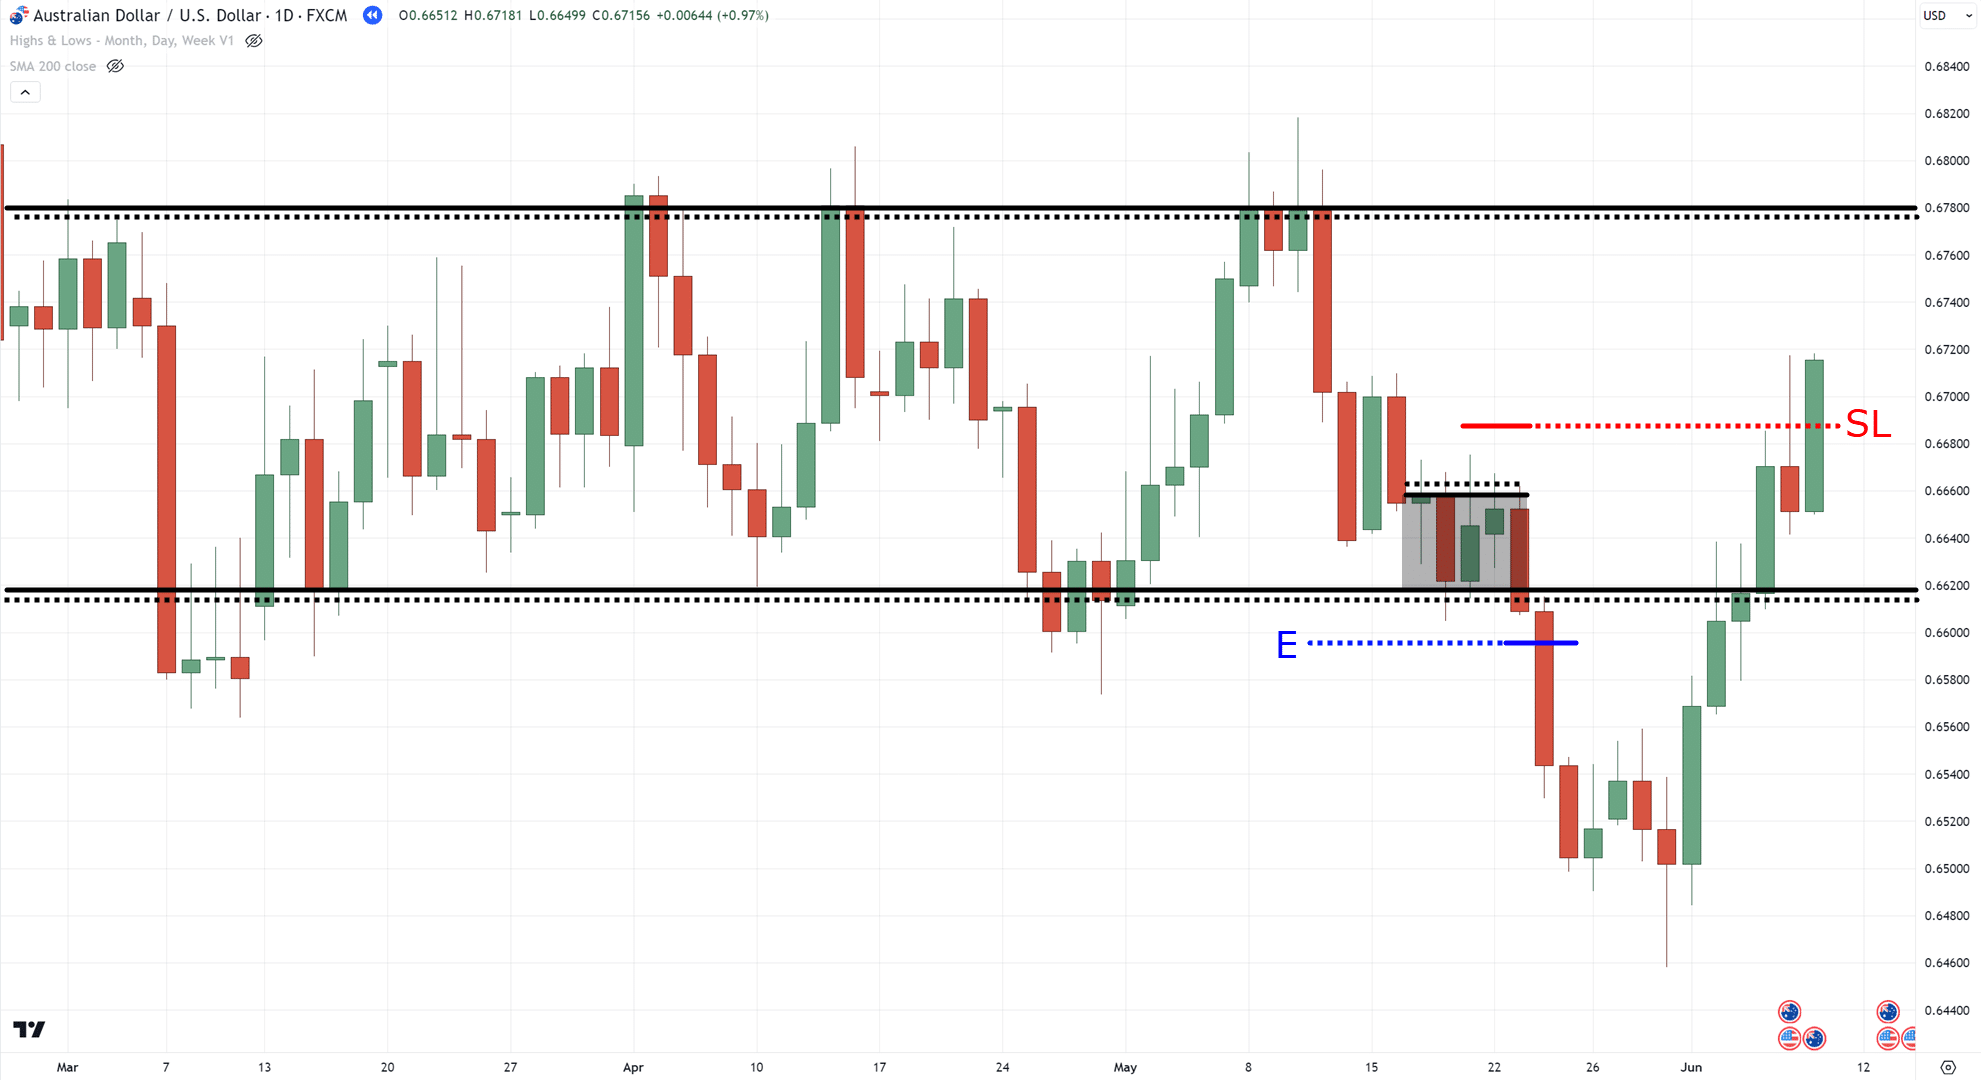
Instead of placing your stops above resistance on breakout…
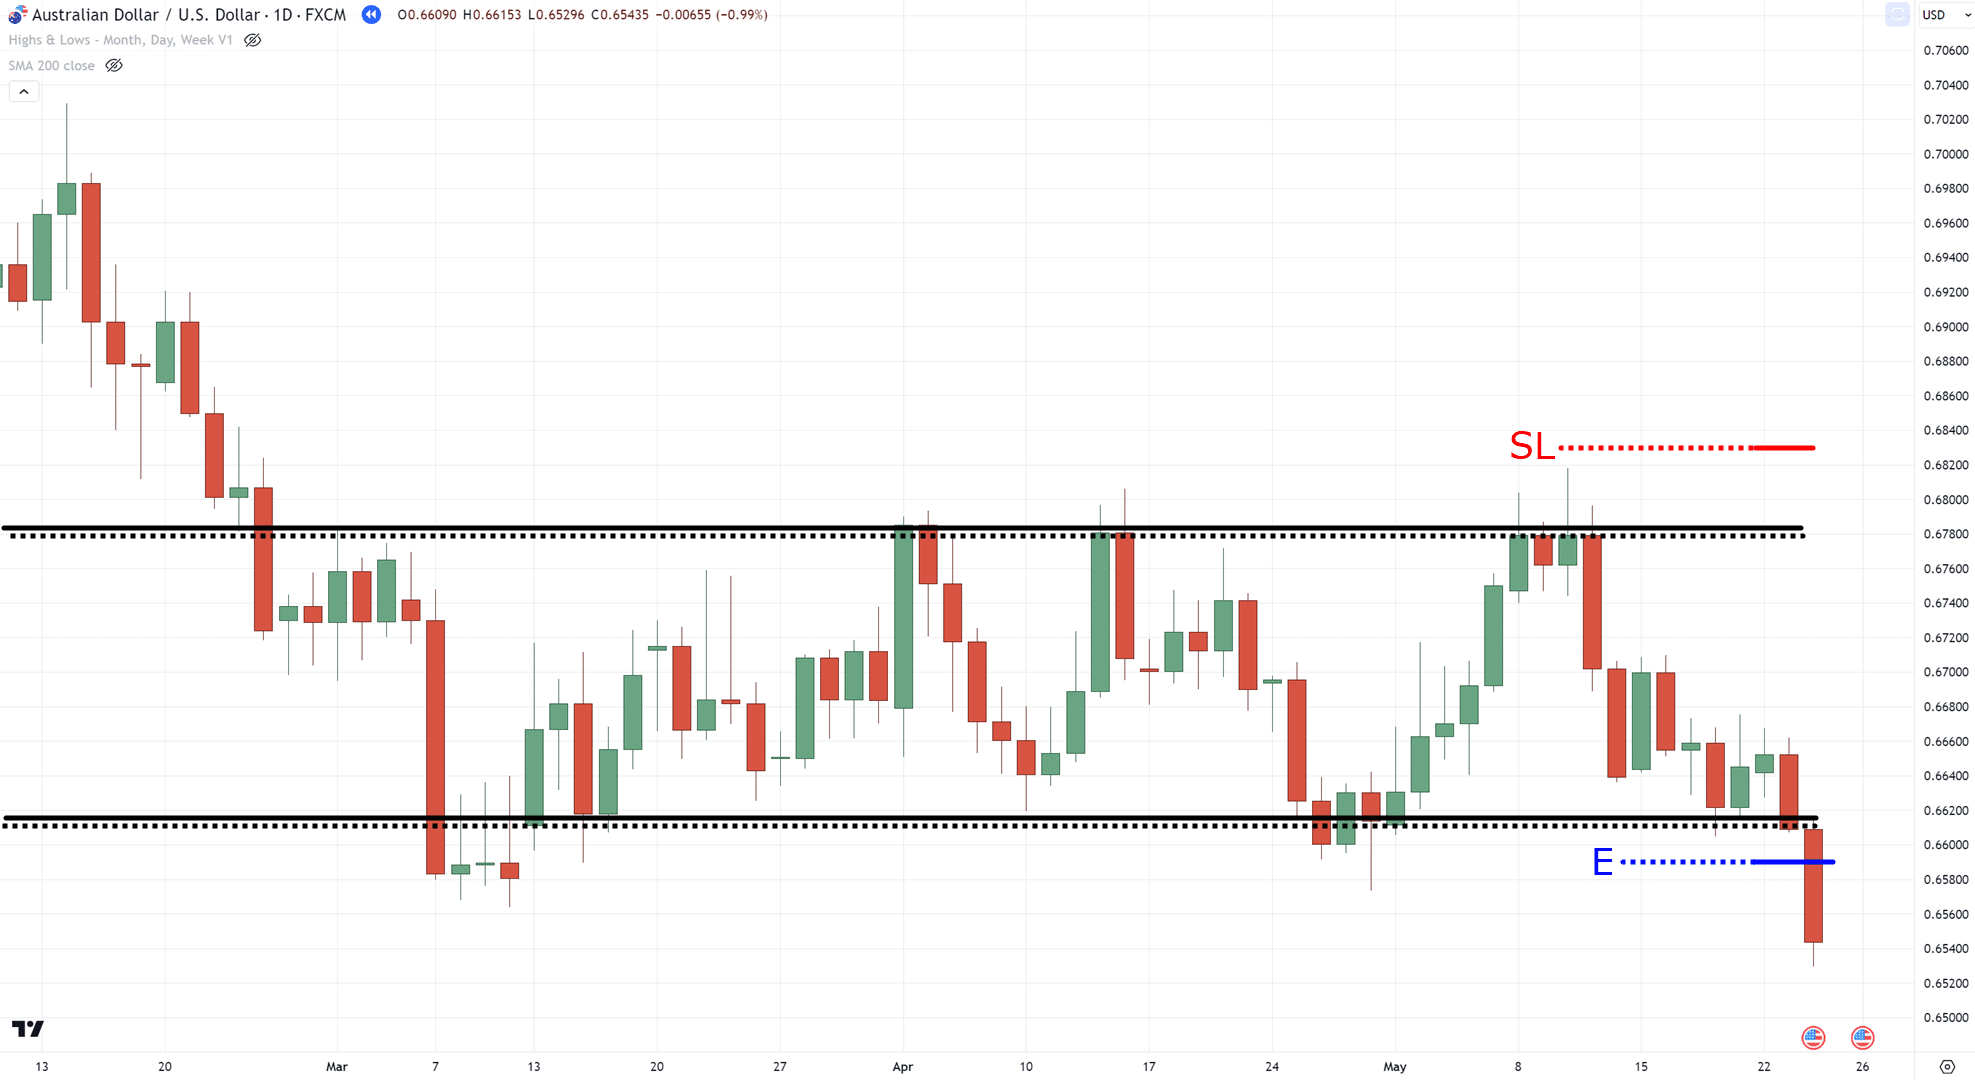
Waiting for a flag pattern would give you a better reference point on where to place a tighter stop loss…
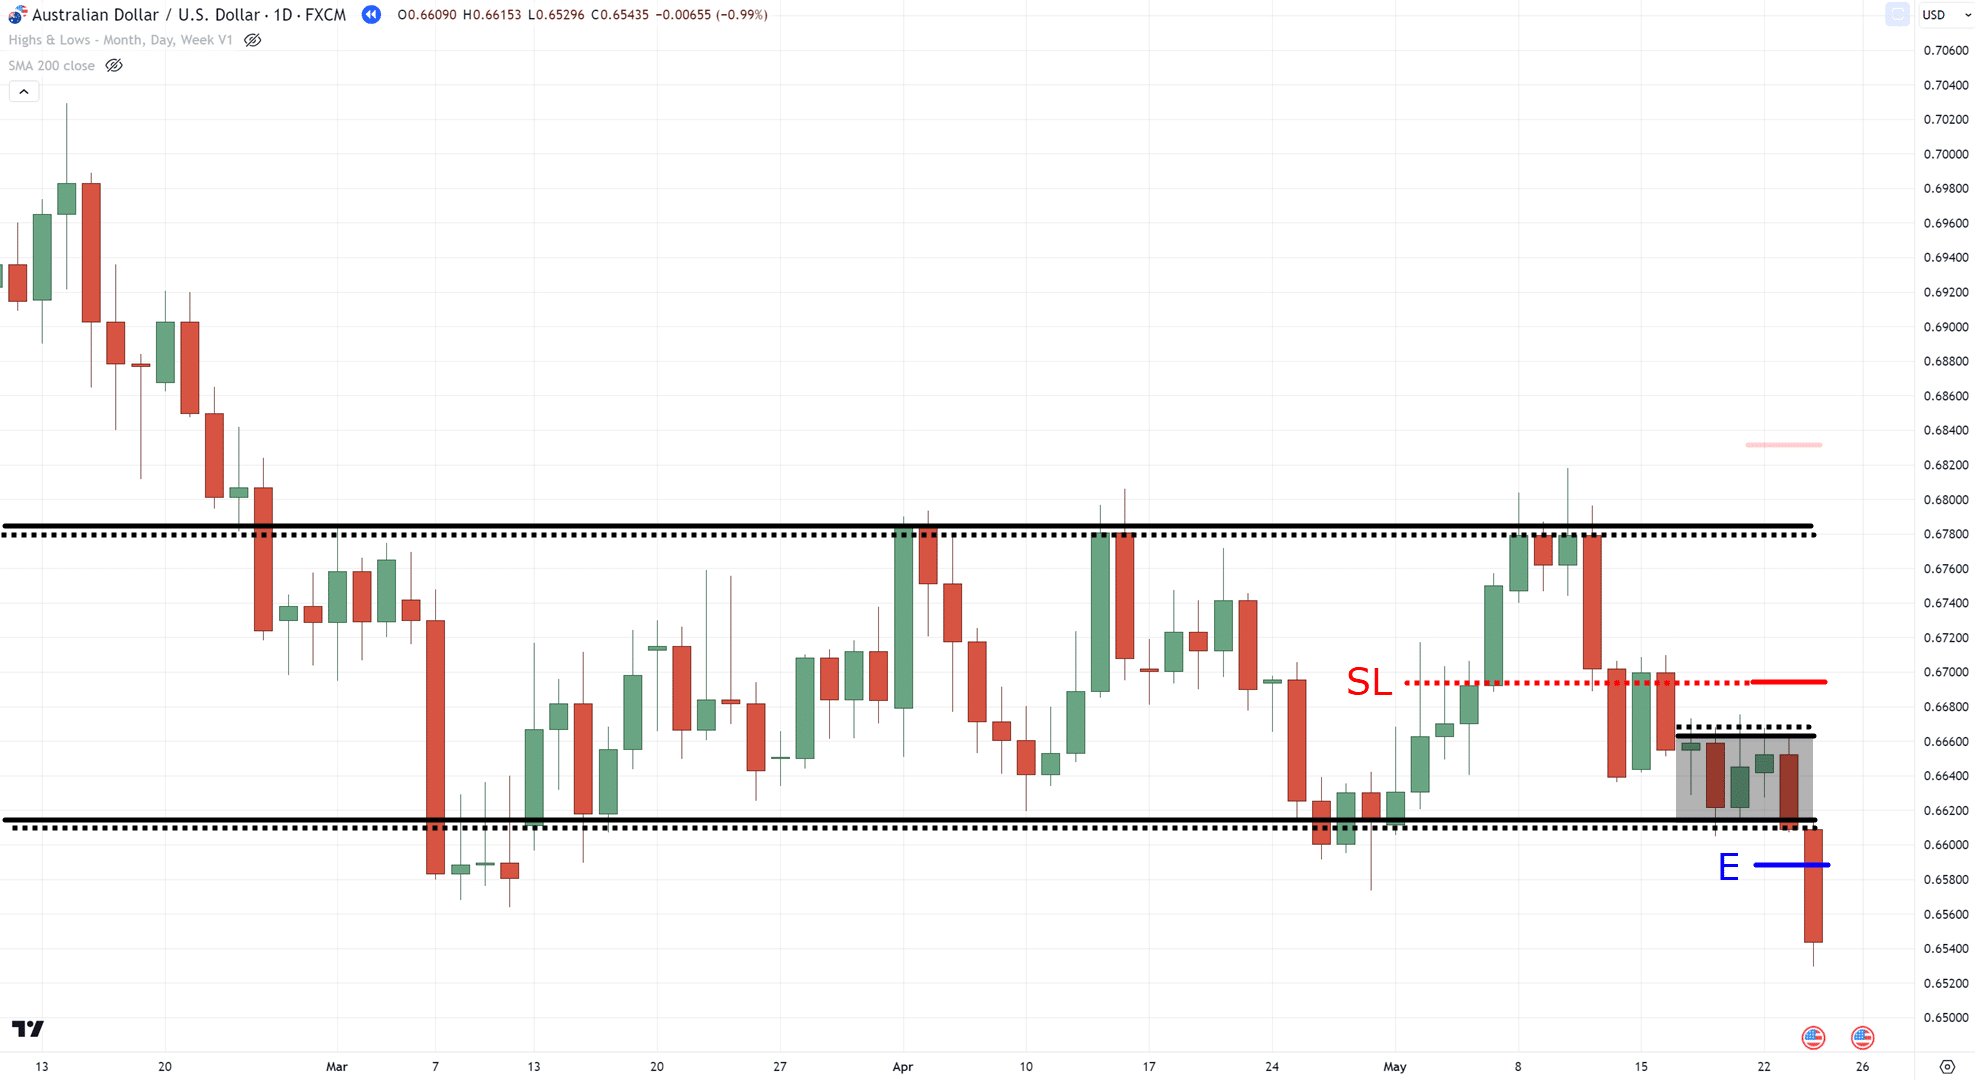
Pretty powerful stuff, right?
The flag pattern allows you to have a better risk-to-reward ratio, but at the same time, it also quickly alerts you if your trading idea has been invalidated…
One thing, though.
It’s worth remembering that “there’s no such thing as a guarantee” definitely applies here!
The flag pattern can fail as well, just like all setups out there.
But now that you have a setup that can trade trends, reversals, and breakouts…
I’ll share with you why integrating the daily timeframe into your 1 hour trading is important (and what you should be looking for)
Why you need to look at the daily timeframe for how to trade price action in the 1 hour timeframe
One word…
Market selection.
At times, you might hear traders ask:
“Out of all the thousands of stocks out there, how do you choose which ones to trade?”
A stock filter, of course!
“How do you choose which forex pairs to trade?”
In this case, a currency strength meter!
“How about crypto?”
You can choose to trade crypto based on market capitalization!
There can be many ways to select markets to trade, but the main takeaway is this:
You can’t just choose which markets to trade based on other people’s opinions or analysis.
You must have a market selection rule…
…a consistent way to select markets to trade!
So, how do you choose which markets to trade on the 1 hour time frame?
Look at the daily timeframe
The lower the timeframe, the more crucial it is to seek confirmation in a higher timeframe!
Of course, some would argue that you can just stick to one timeframe.
However…
Looking at the daily timeframe not only gives you a consistent way to trade price action in the 1 hour timeframe, but also increases the probability of successful trades.
And you might be thinking…
“Alright, what exactly do we look for on the daily timeframe?”
Here’s the deal:
I will give you two methods that have worked for me as well as for many students and coaches.
But before trading it live on the markets…
You must do your own back testing first, as you should never take everything at face value.
With that agreed, let’s get started!
Previous day highs and lows
Of the two methods I’ll share with you, this one is the most simple.
That’s because you can execute it even without an indicator (though having one will help).
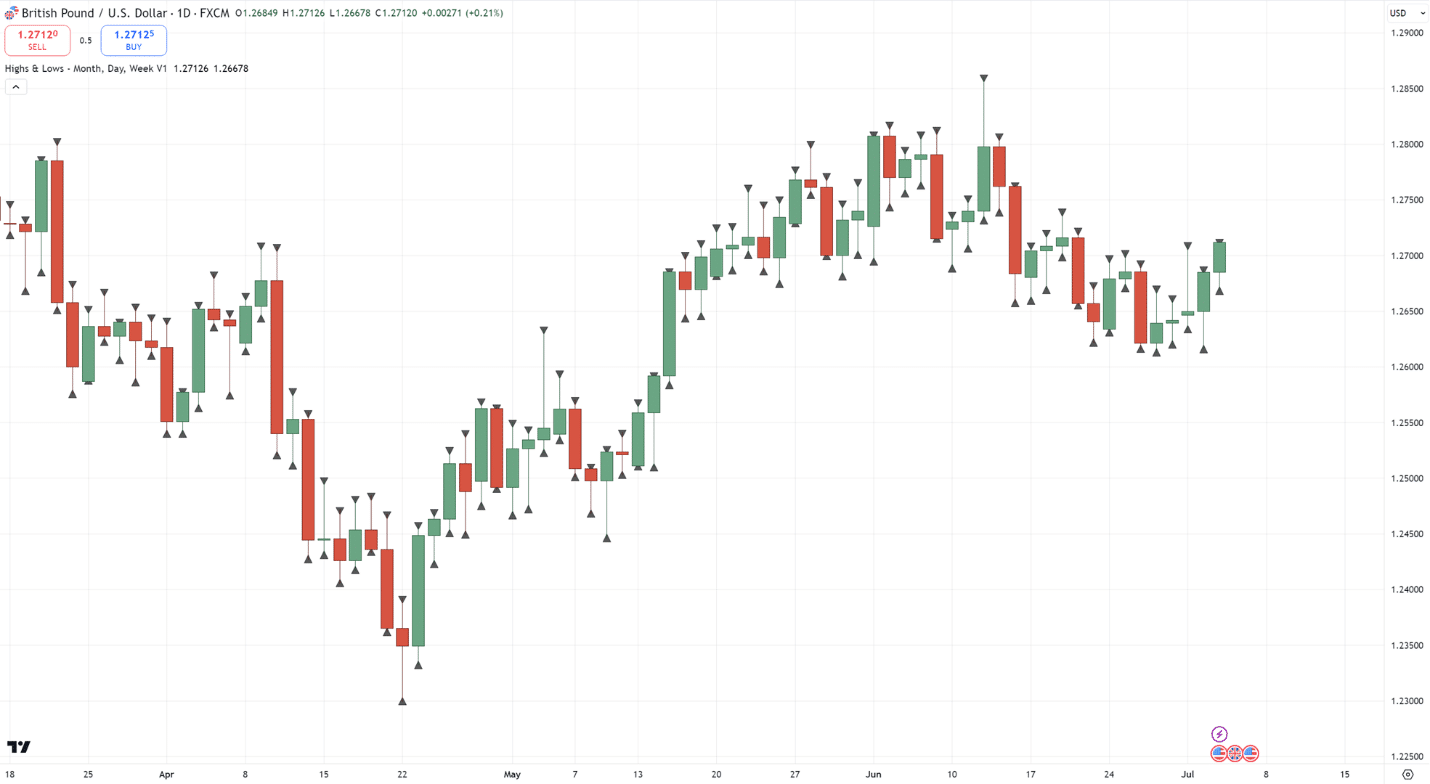
The concept is simple – just take the highs and lows of the daily timeframe…
And then simply go down the 1 hour timeframe…
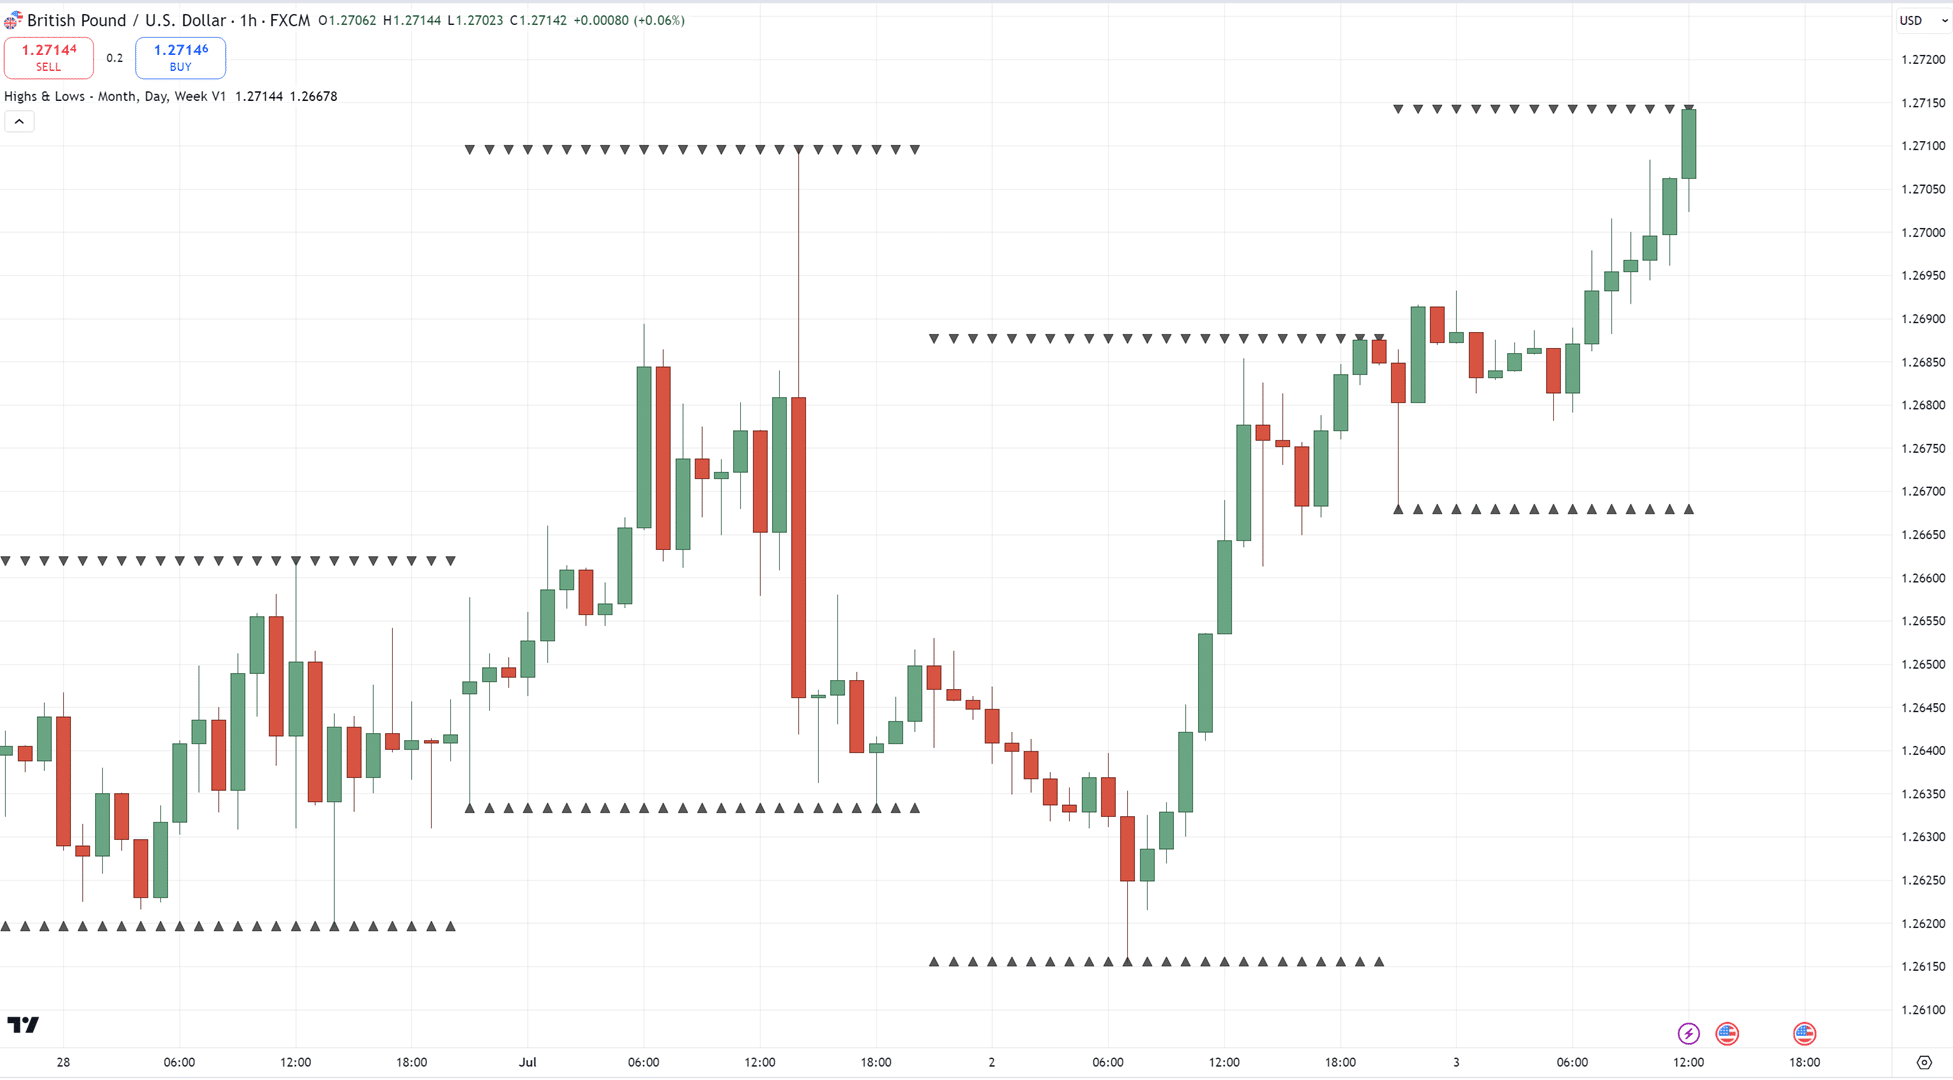
Basically, the previous daily highs and lows act as an area of value on your chart…
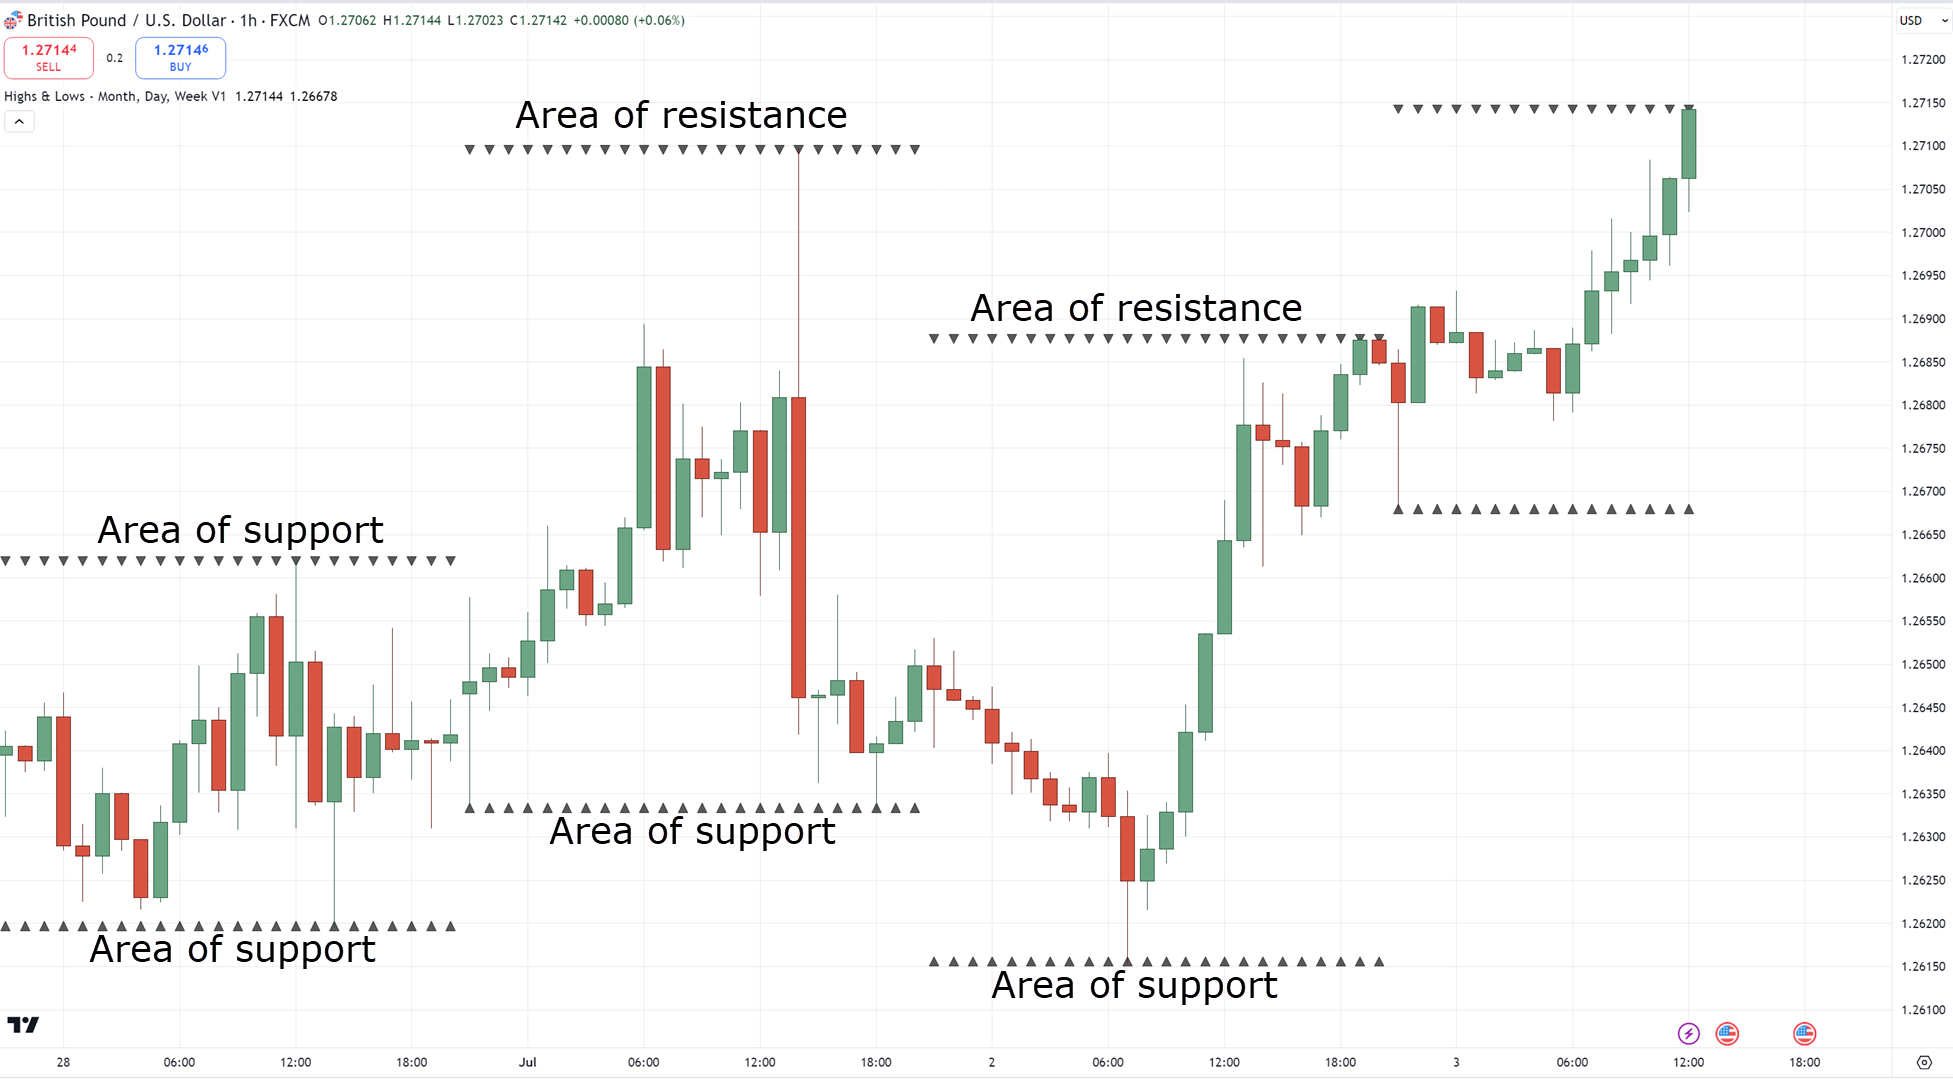
Take note that we don’t consider the “current” daily highs and lows as you’d want to reference the previous daily highs and lows!
So, how to trade price action in the 1 hour timeframe using this method?
Well – wait for reversals via break of structure!…
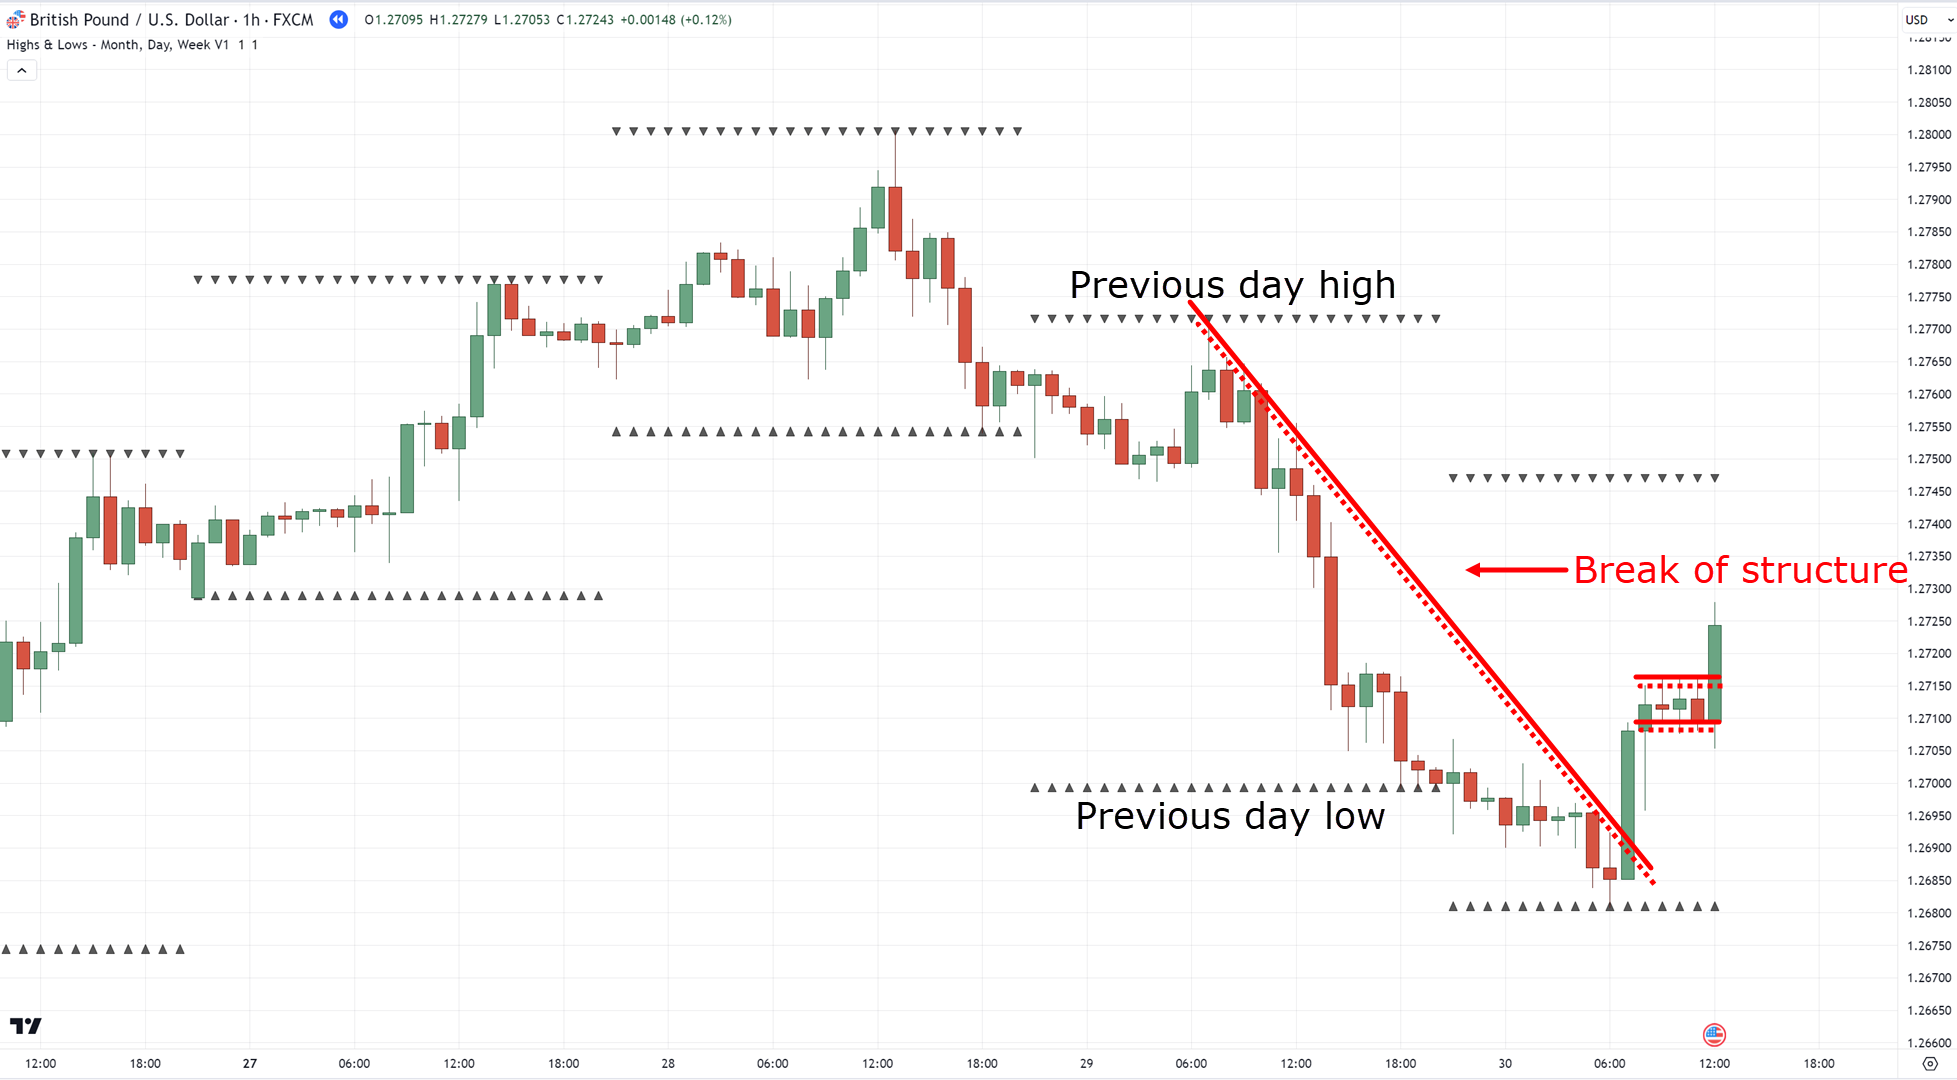
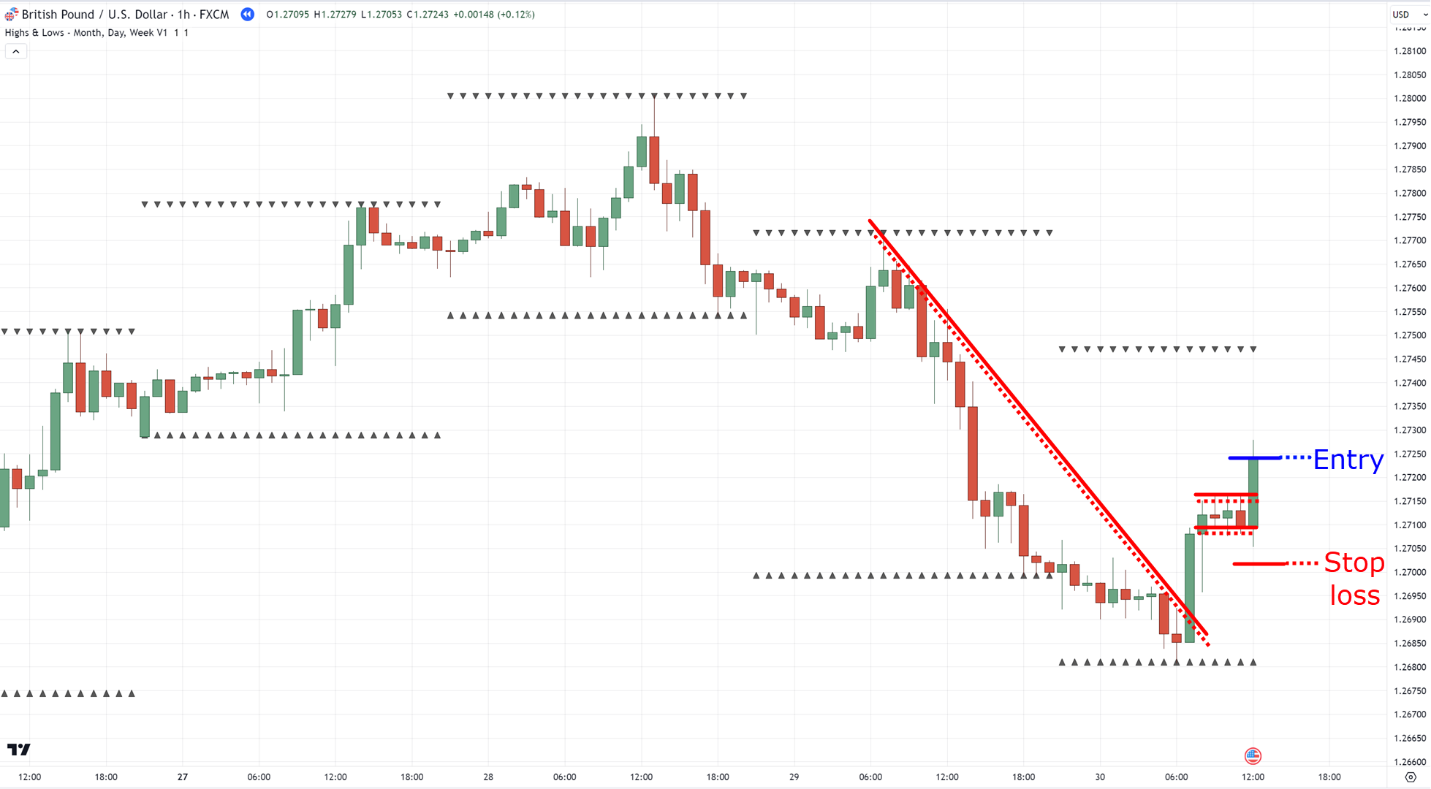
This is particularly useful, as you don’t necessarily need to look at the daily timeframe.
However, the indicator (which is called the Highs & Lows by UnknownUnicorn on TradingView) shows the data from the daily timeframe.
But there’s one caveat to this method…
During trending markets, the price will tend to break its previous day’s high or low.
In this case, you use the buildup setup around the previous daily highs…
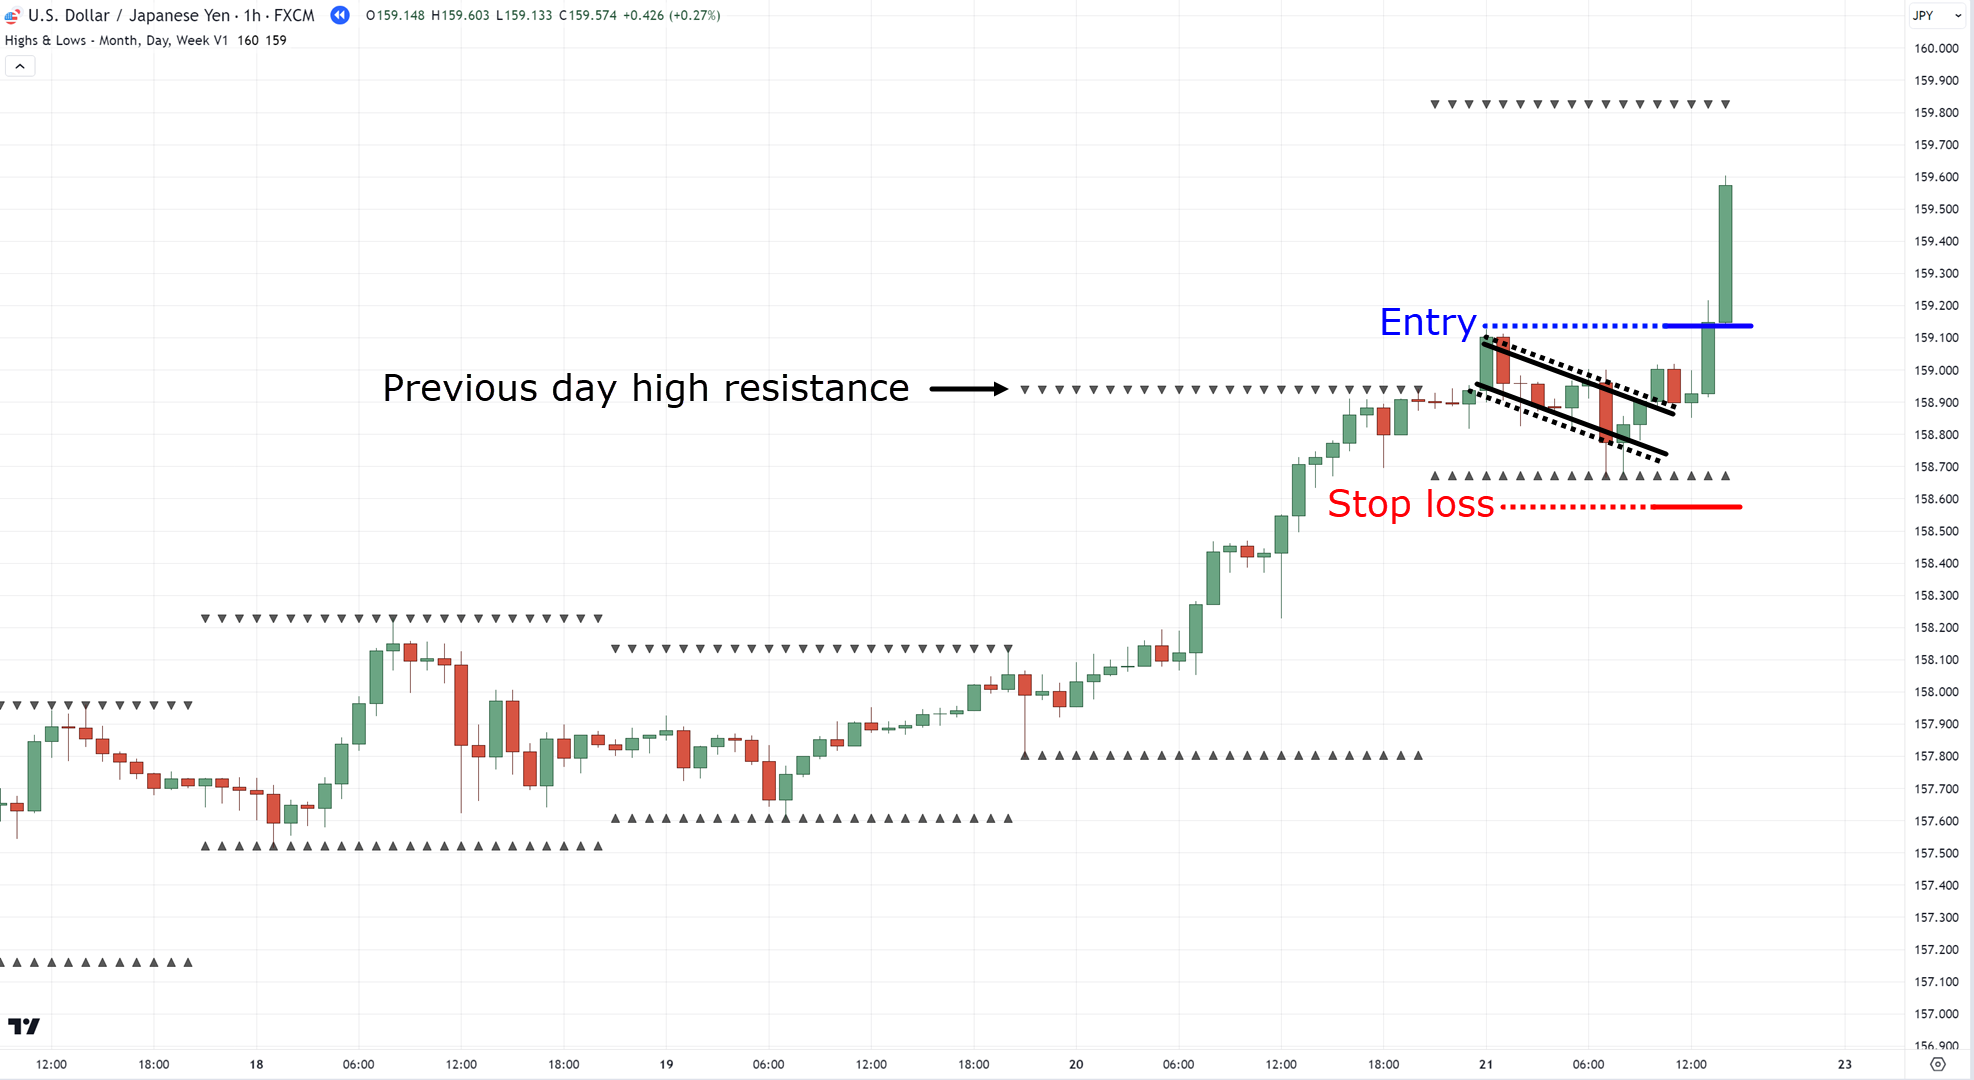
Basically, wait for a bull flag pattern forming around the previous day’s high or a bear flag pattern on the previous day’s low.
Got it?
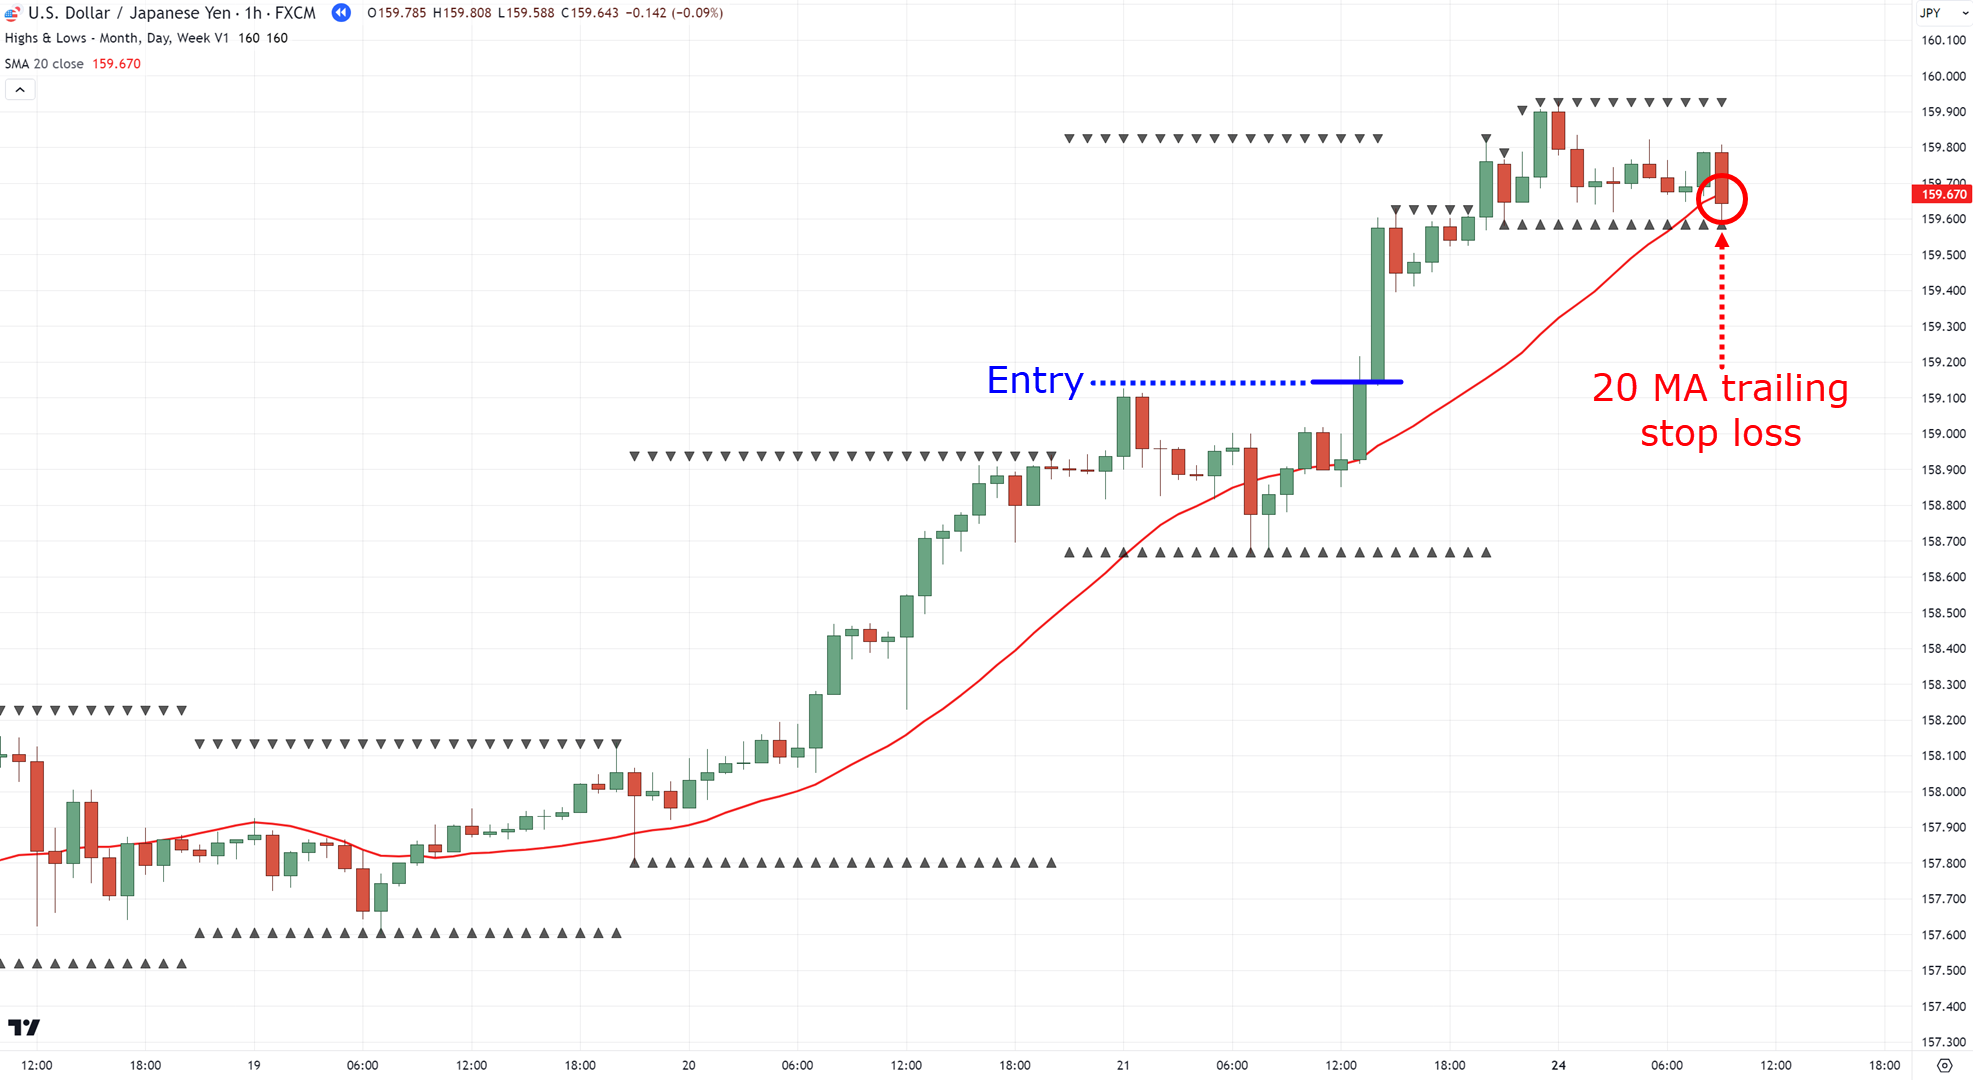
For taking profits, you can always consider placing your targets before the previous daily high (if long)…
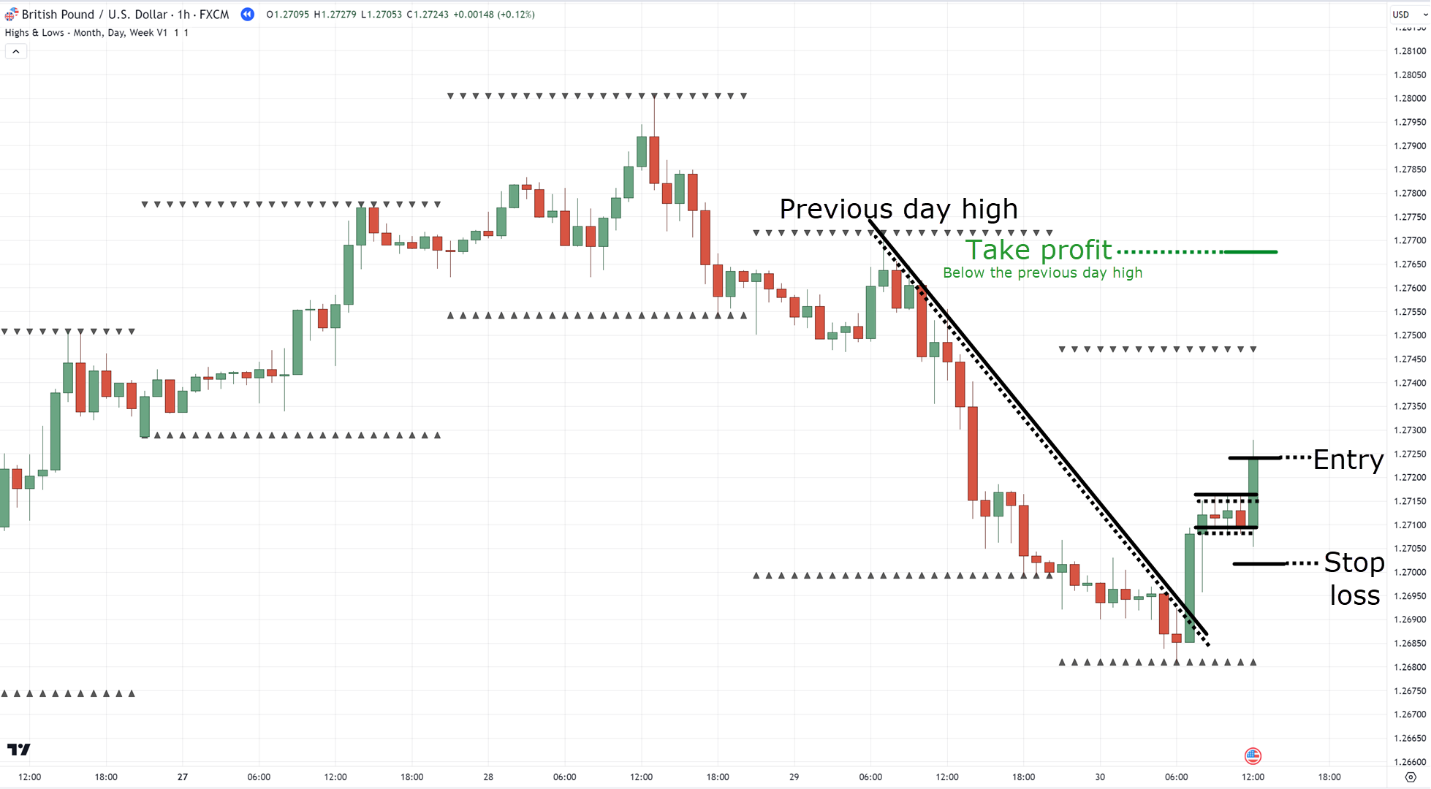
But for trending markets, consider trailing your stop loss using a short-term moving average such as the 20 MA…
Extreme MACD levels
I have to admit.
I learned this method from Darek Dargo which you can check out in his interview with Rayner here:
The Forex Trader With 86% Winning Rate (With Darek Dargo)
So, it’s only fair to give him credit for this method!
But basically…
You want to look at the “extremes” on the MACD histogram (default values) at the daily timeframe…
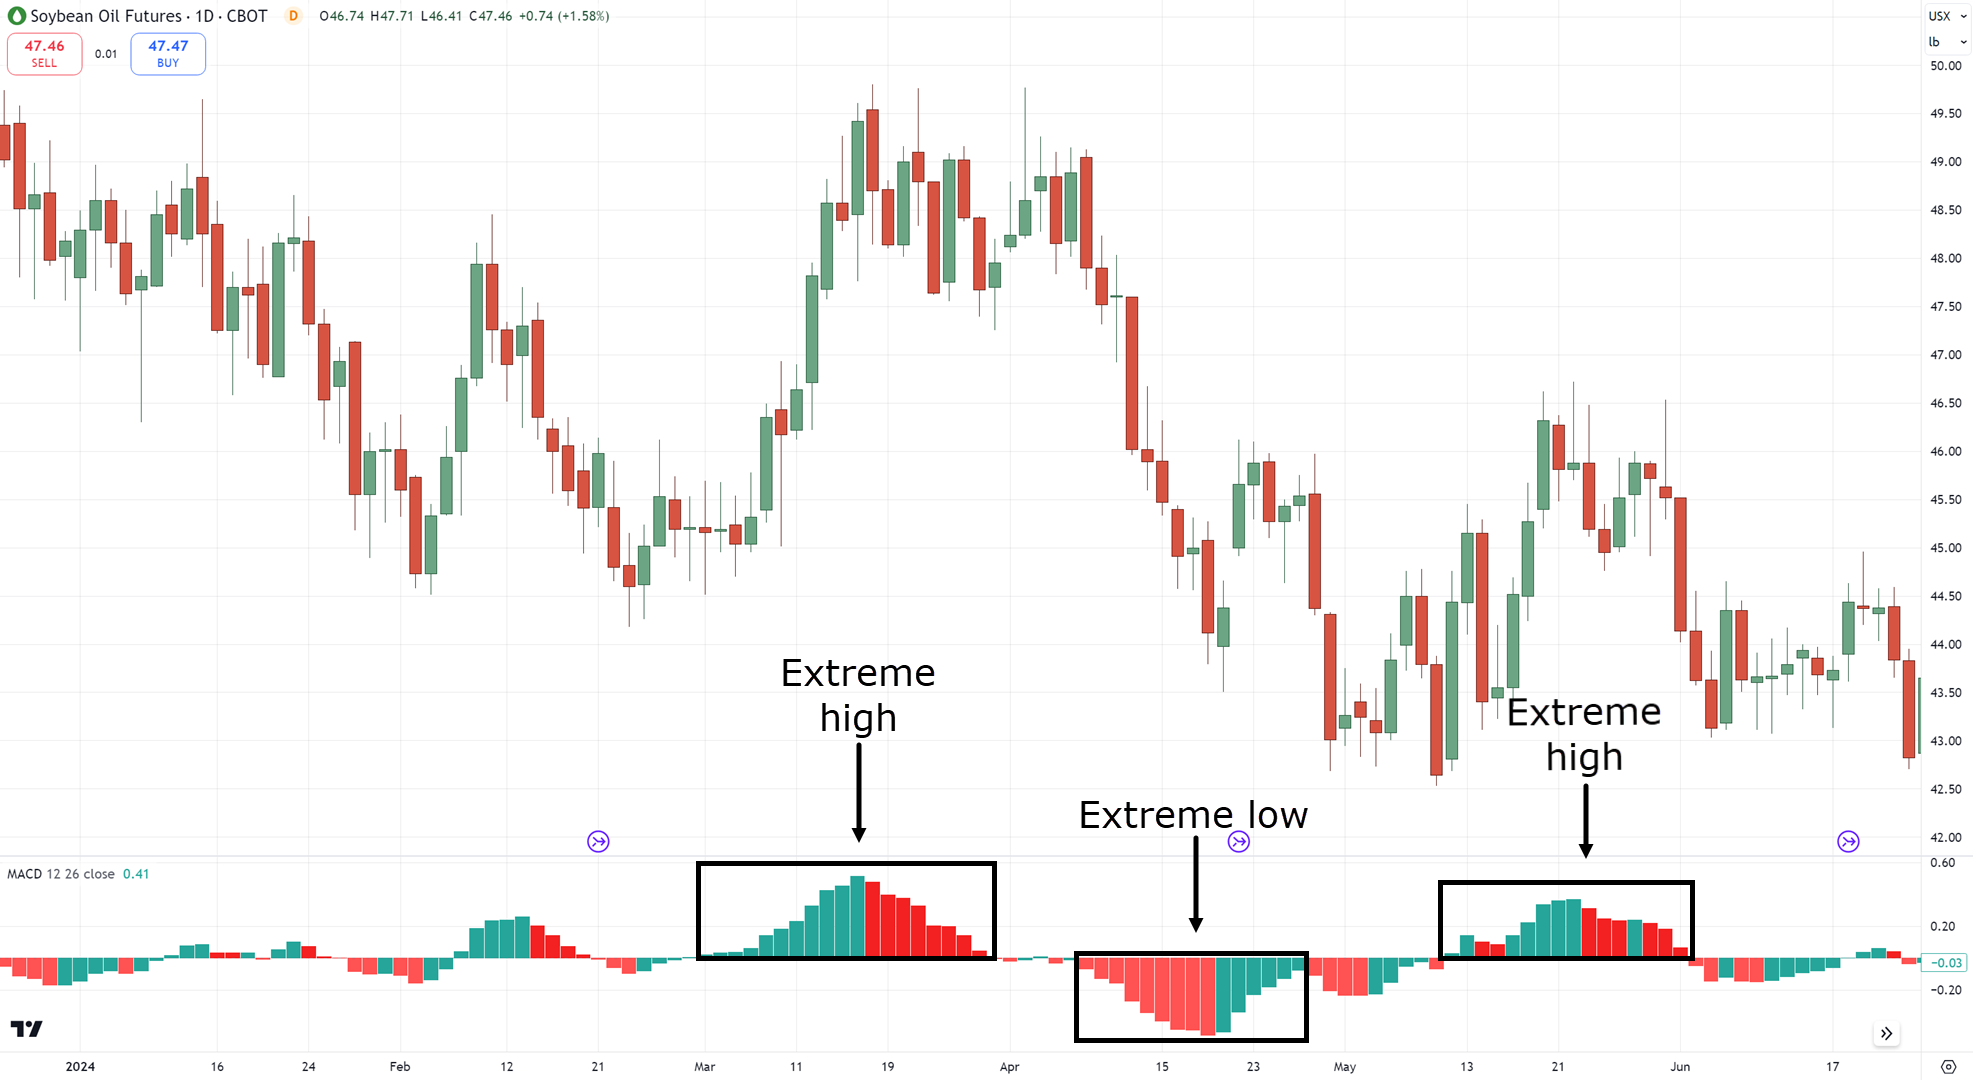
Spotting these extremes on the daily timeframe will take practice!
You need to learn what is an extreme level and what isn’t…
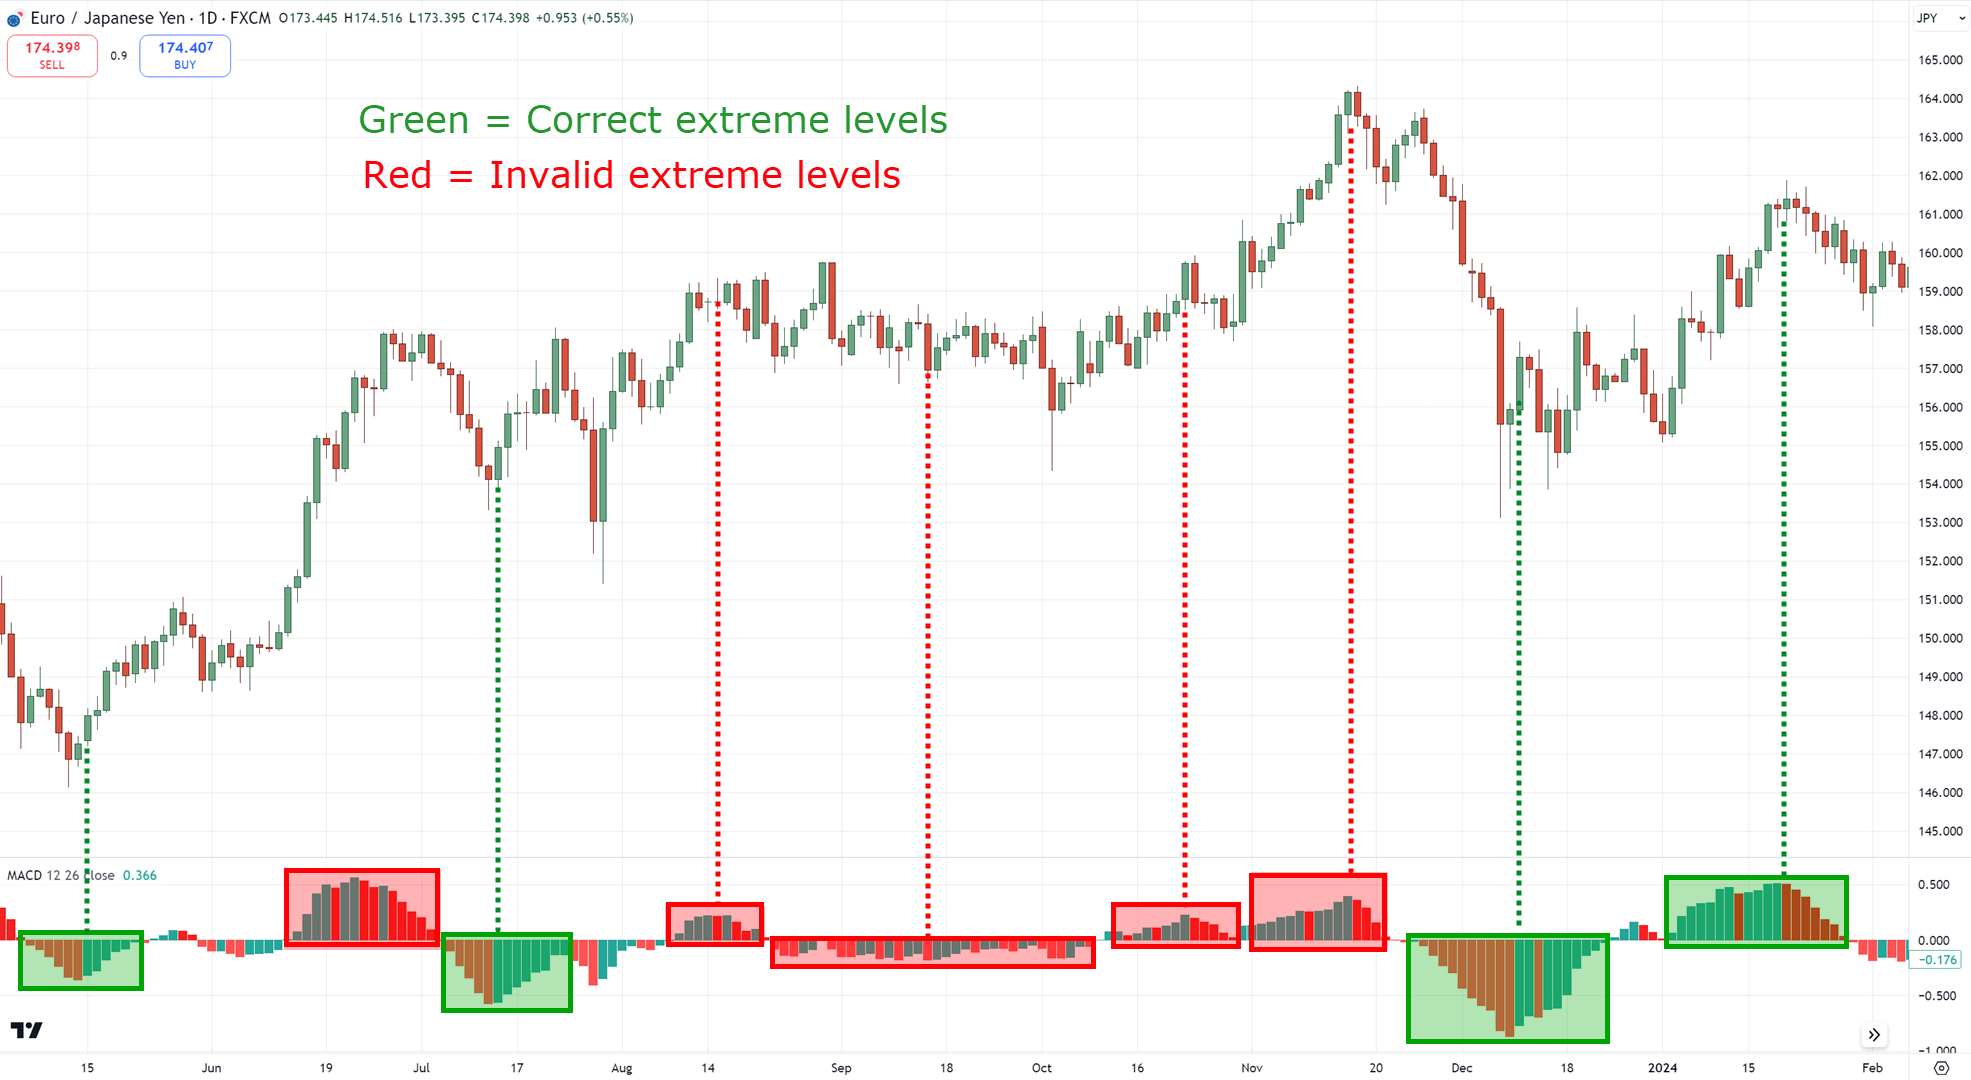
But once you spot one…
It’s only a matter of time before the market snaps back, like an overstretched rubber band!
Now, how can you use this to trade the 1 hour timeframe?
First, spot an extreme level on the MACD histogram on the daily timeframe that is starting to reverse…
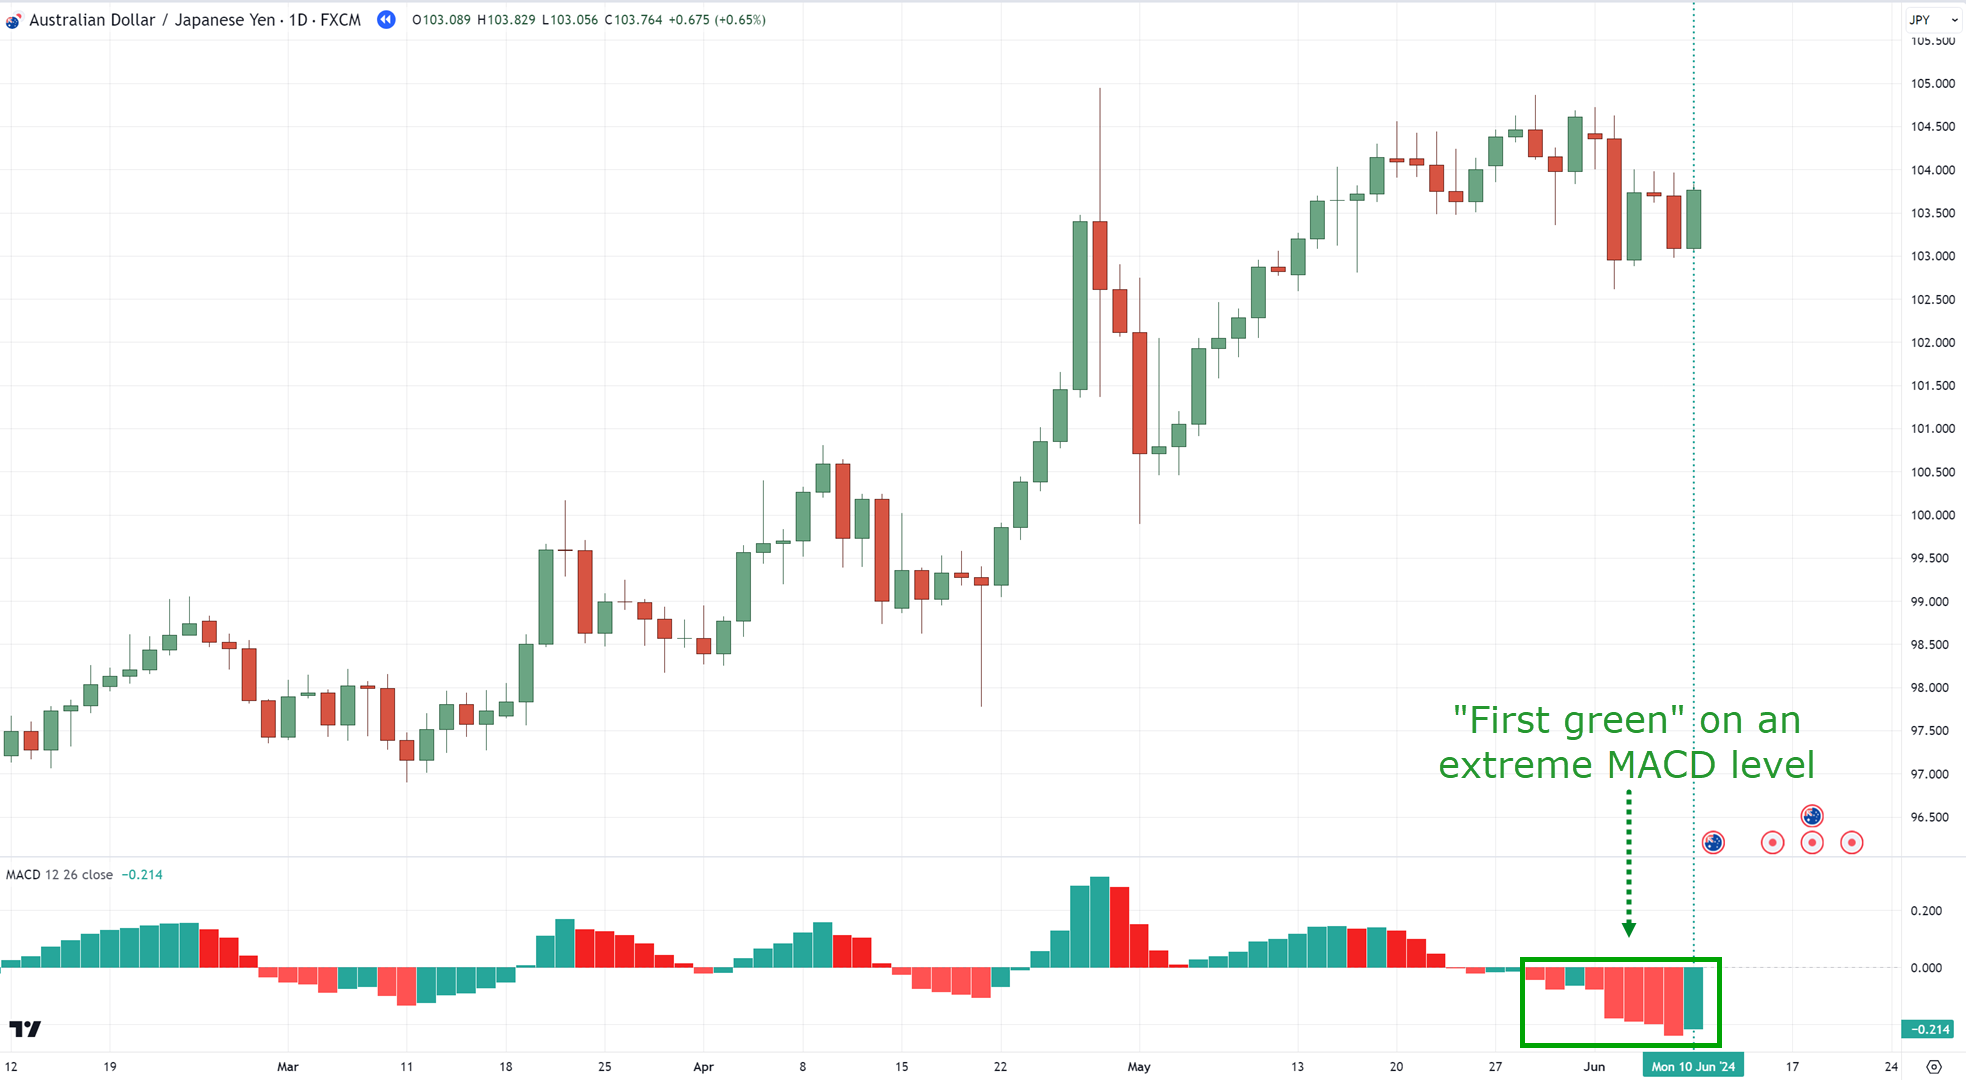
Once you see it, go down to the lower timeframe and trade price action in the direction of the potential reversal…
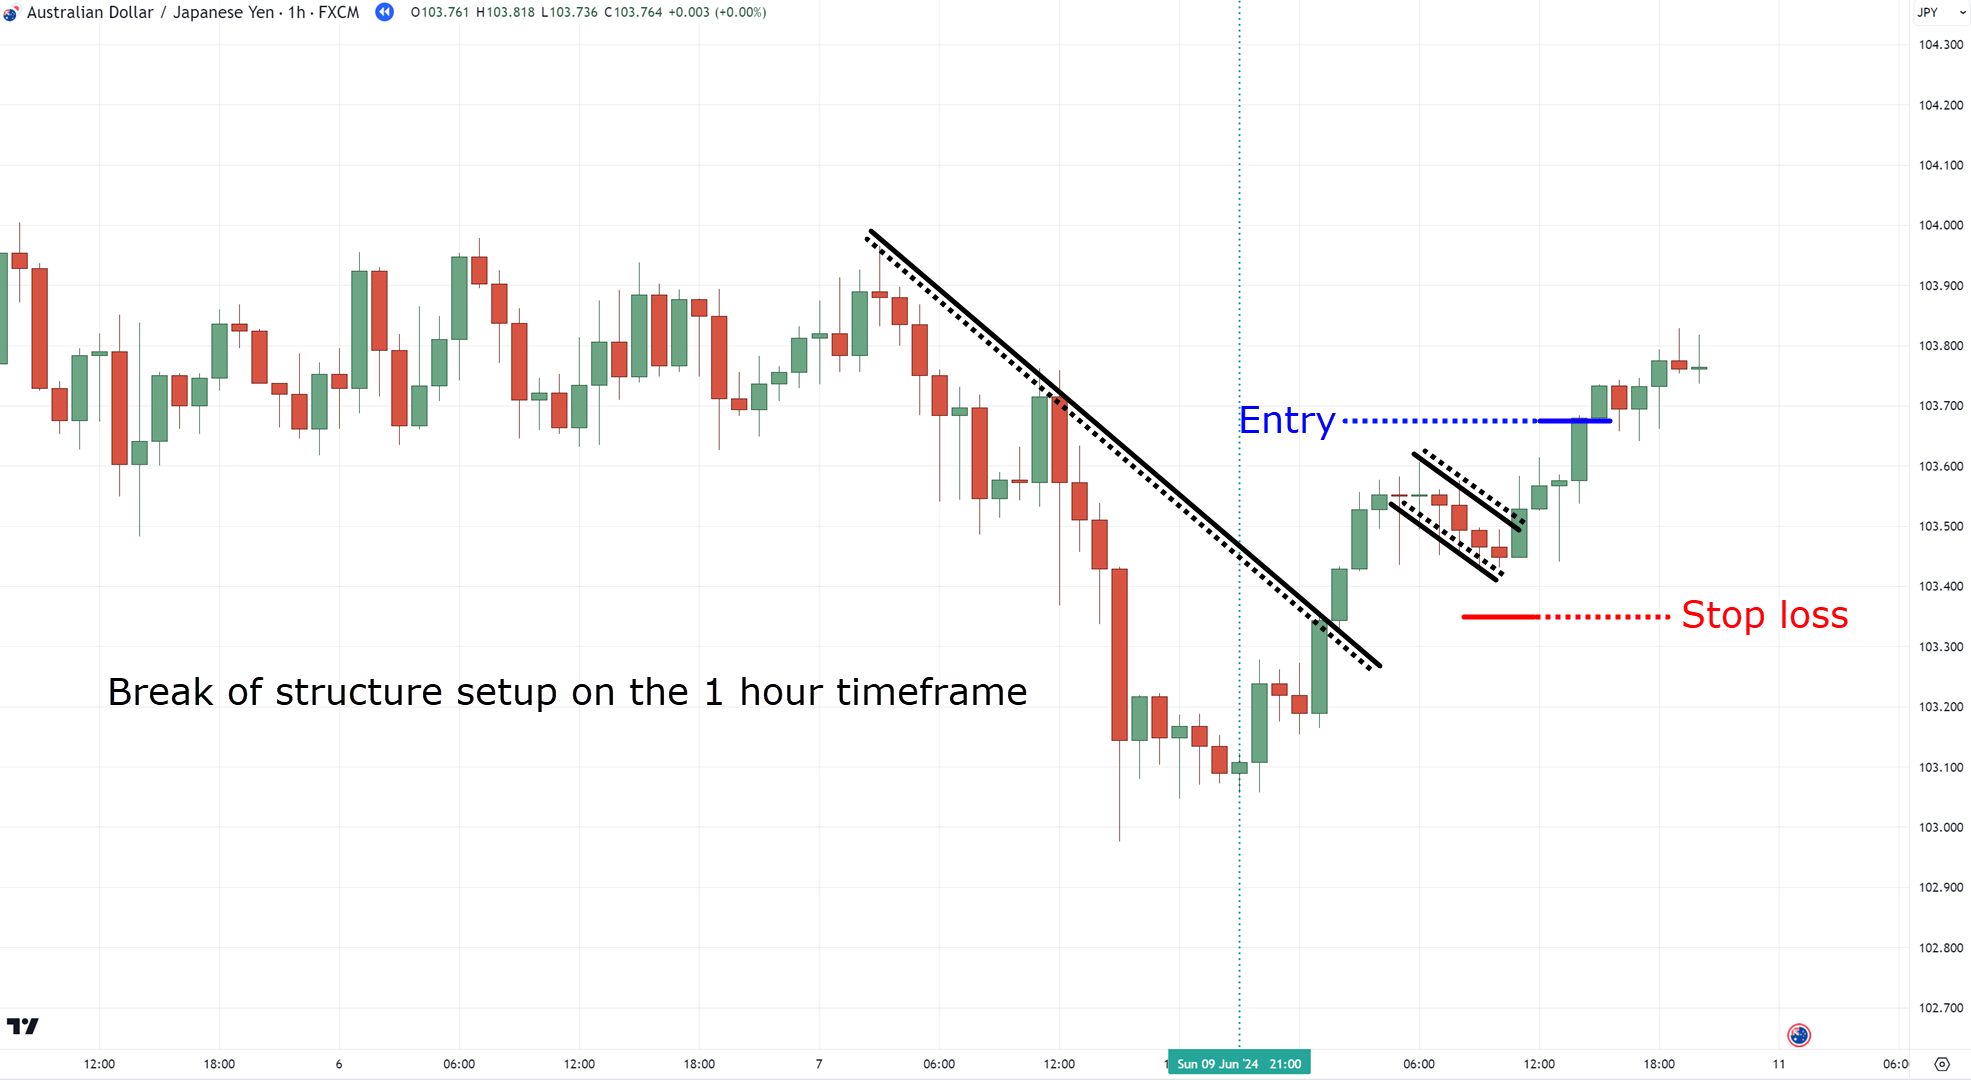
This method is particularly useful as it doesn’t just let you easily spot potential reversals in the market and helps you spot setups on your watchlist, which I’ll share with you later.
Now, as for taking profits…
Darek often uses a 1:1 risk-to-reward ratio to keep this win rate high…
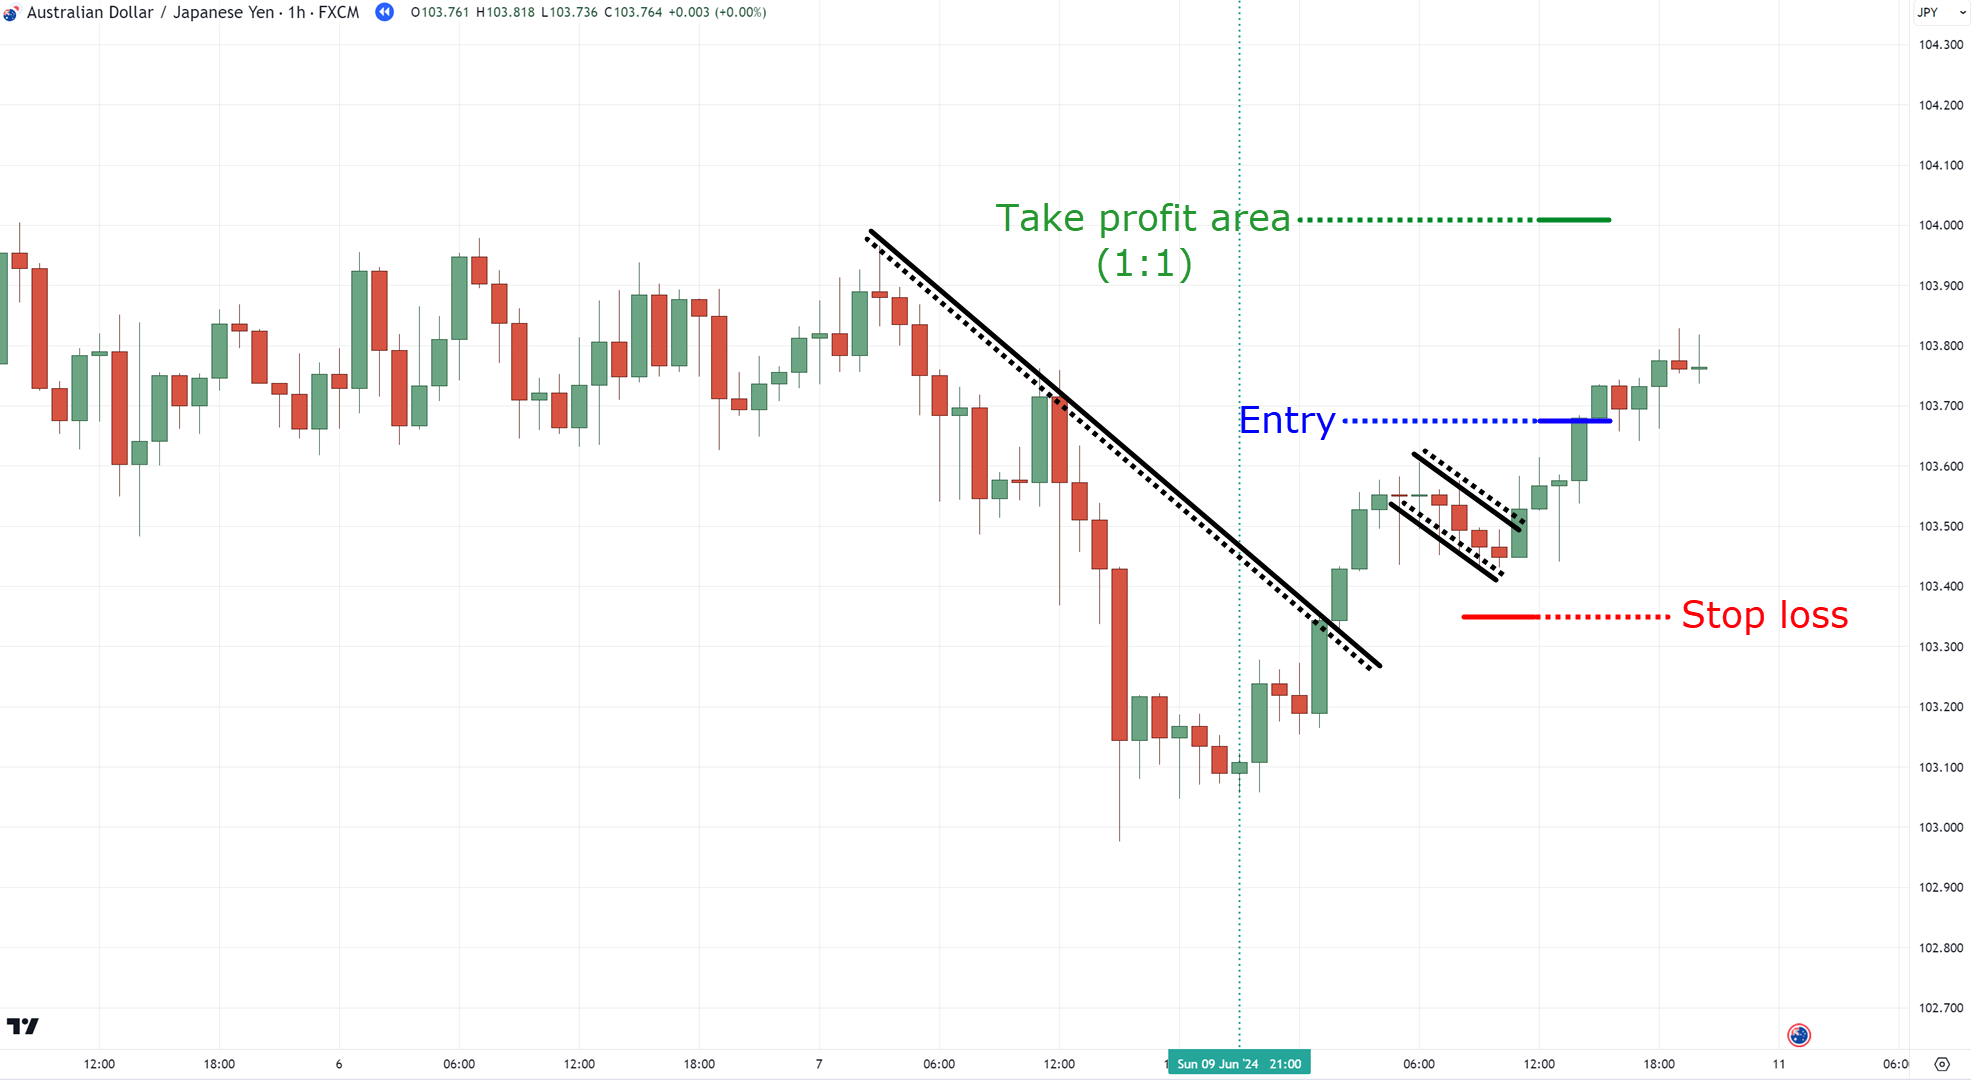
But you’re also free to compromise by having a partial take profit and then taking complete profits at the nearest area of value…
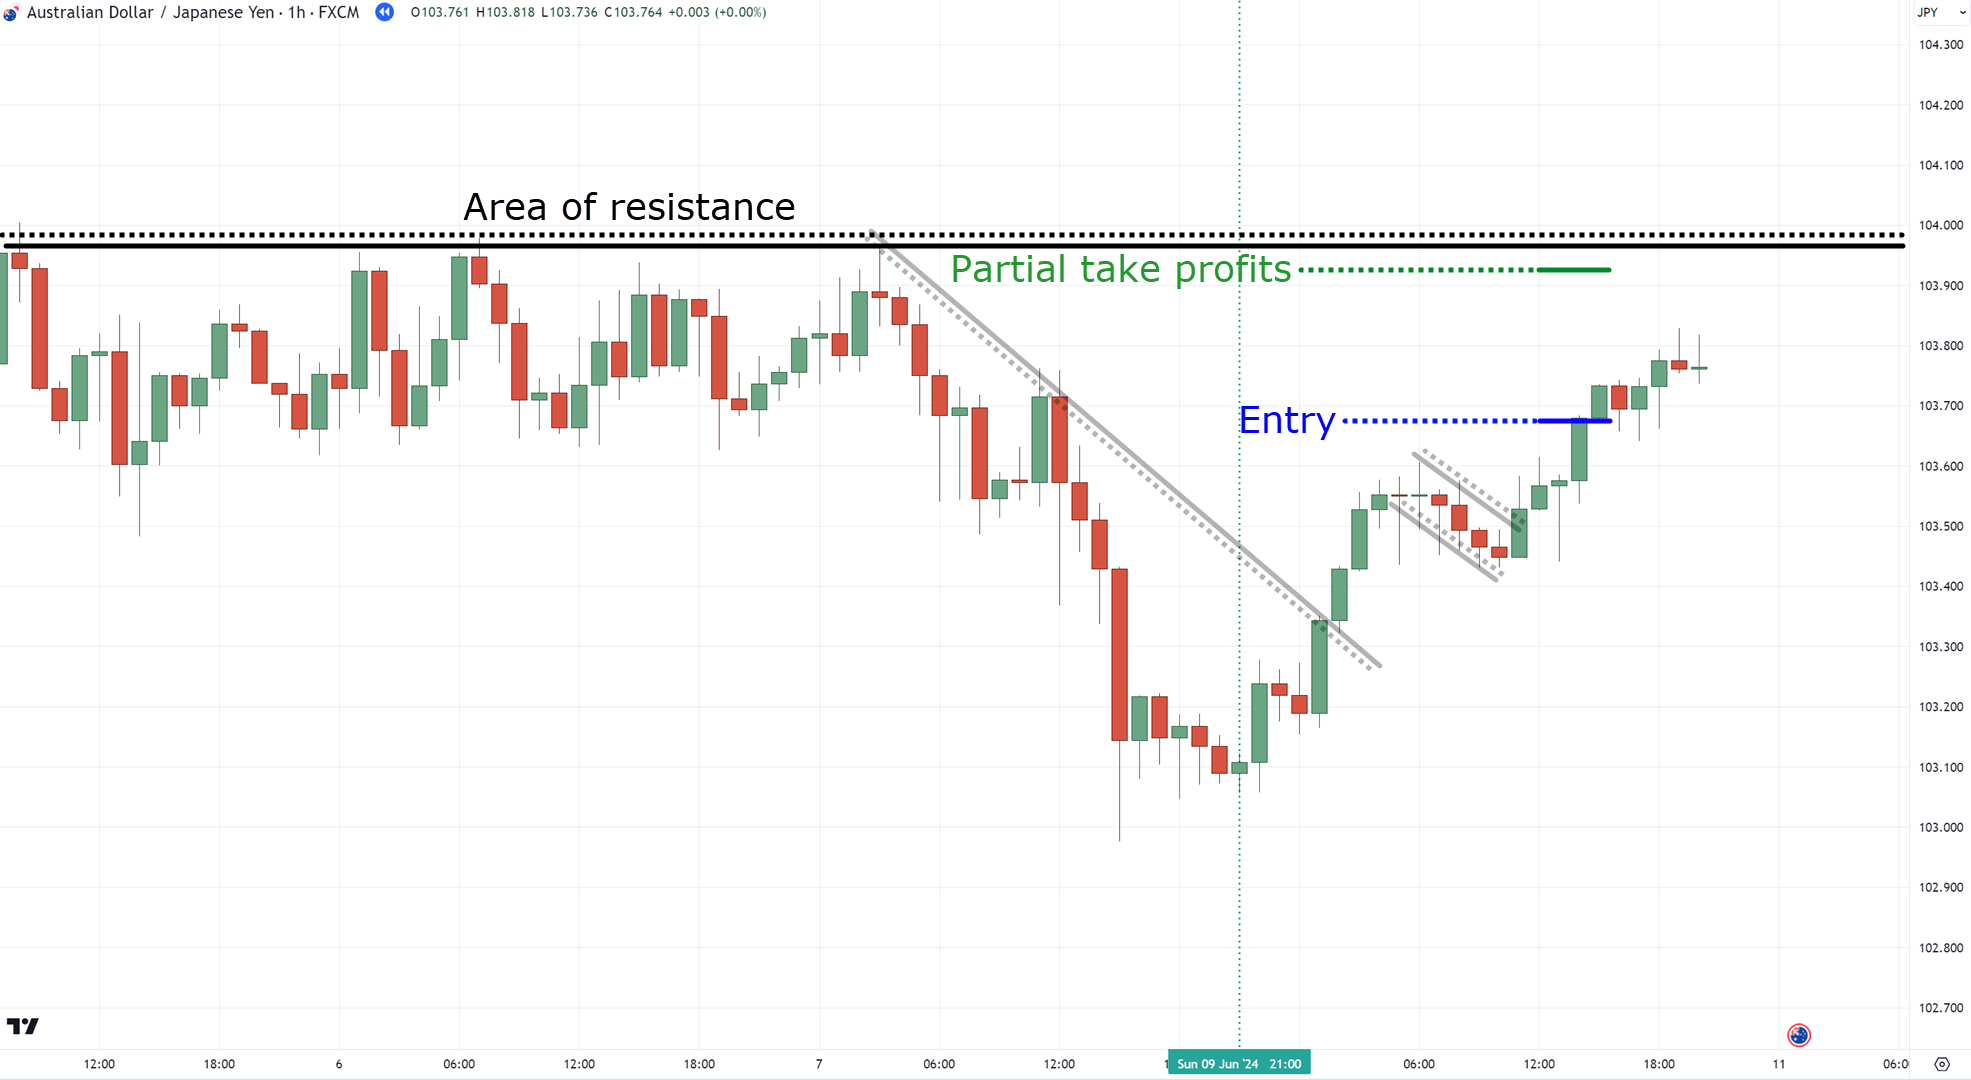
Make sense?
Great!
At this point, you’ve learned multiple price action setups to trade on the 1 hour timeframe.
Not only that!
You’ve also learned how to select markets to trade.
However, there’s one specific topic that traders don’t often talk about, if at all…
And that’s the trading routine.
Let me share more with you in the next section…
How to trade price action in the 1 hour timeframe: When should you check your charts?
This topic is often the most overlooked yet the most important.
Why?
Because you want to treat trading as a business instead of a hobby!
You need a consistent trading routine on when and when not to check your charts.
Because let’s face it…
On markets such as forex and crypto, you can’t be awake all the time!
So, going back to the question – when should you check your charts?
Well, a trading routine during a day can be segregated into three parts:
- Watchlist building (early morning)
- Execution (interval checking during the day)
- Journaling (every weekend)
Let me explain…
Watchlist building (early morning)
This is where you take a close look at your watchlist to see potential trades for the rest of the day.
I suggest you do this in the morning.
Once you’ve analyzed every market on your watchlist…
You’ll hone it to a few markets that you will monitor or execute within the day.
Let’s take forex as an example.
As you can see below, this is my watchlist for the GBP crosses…
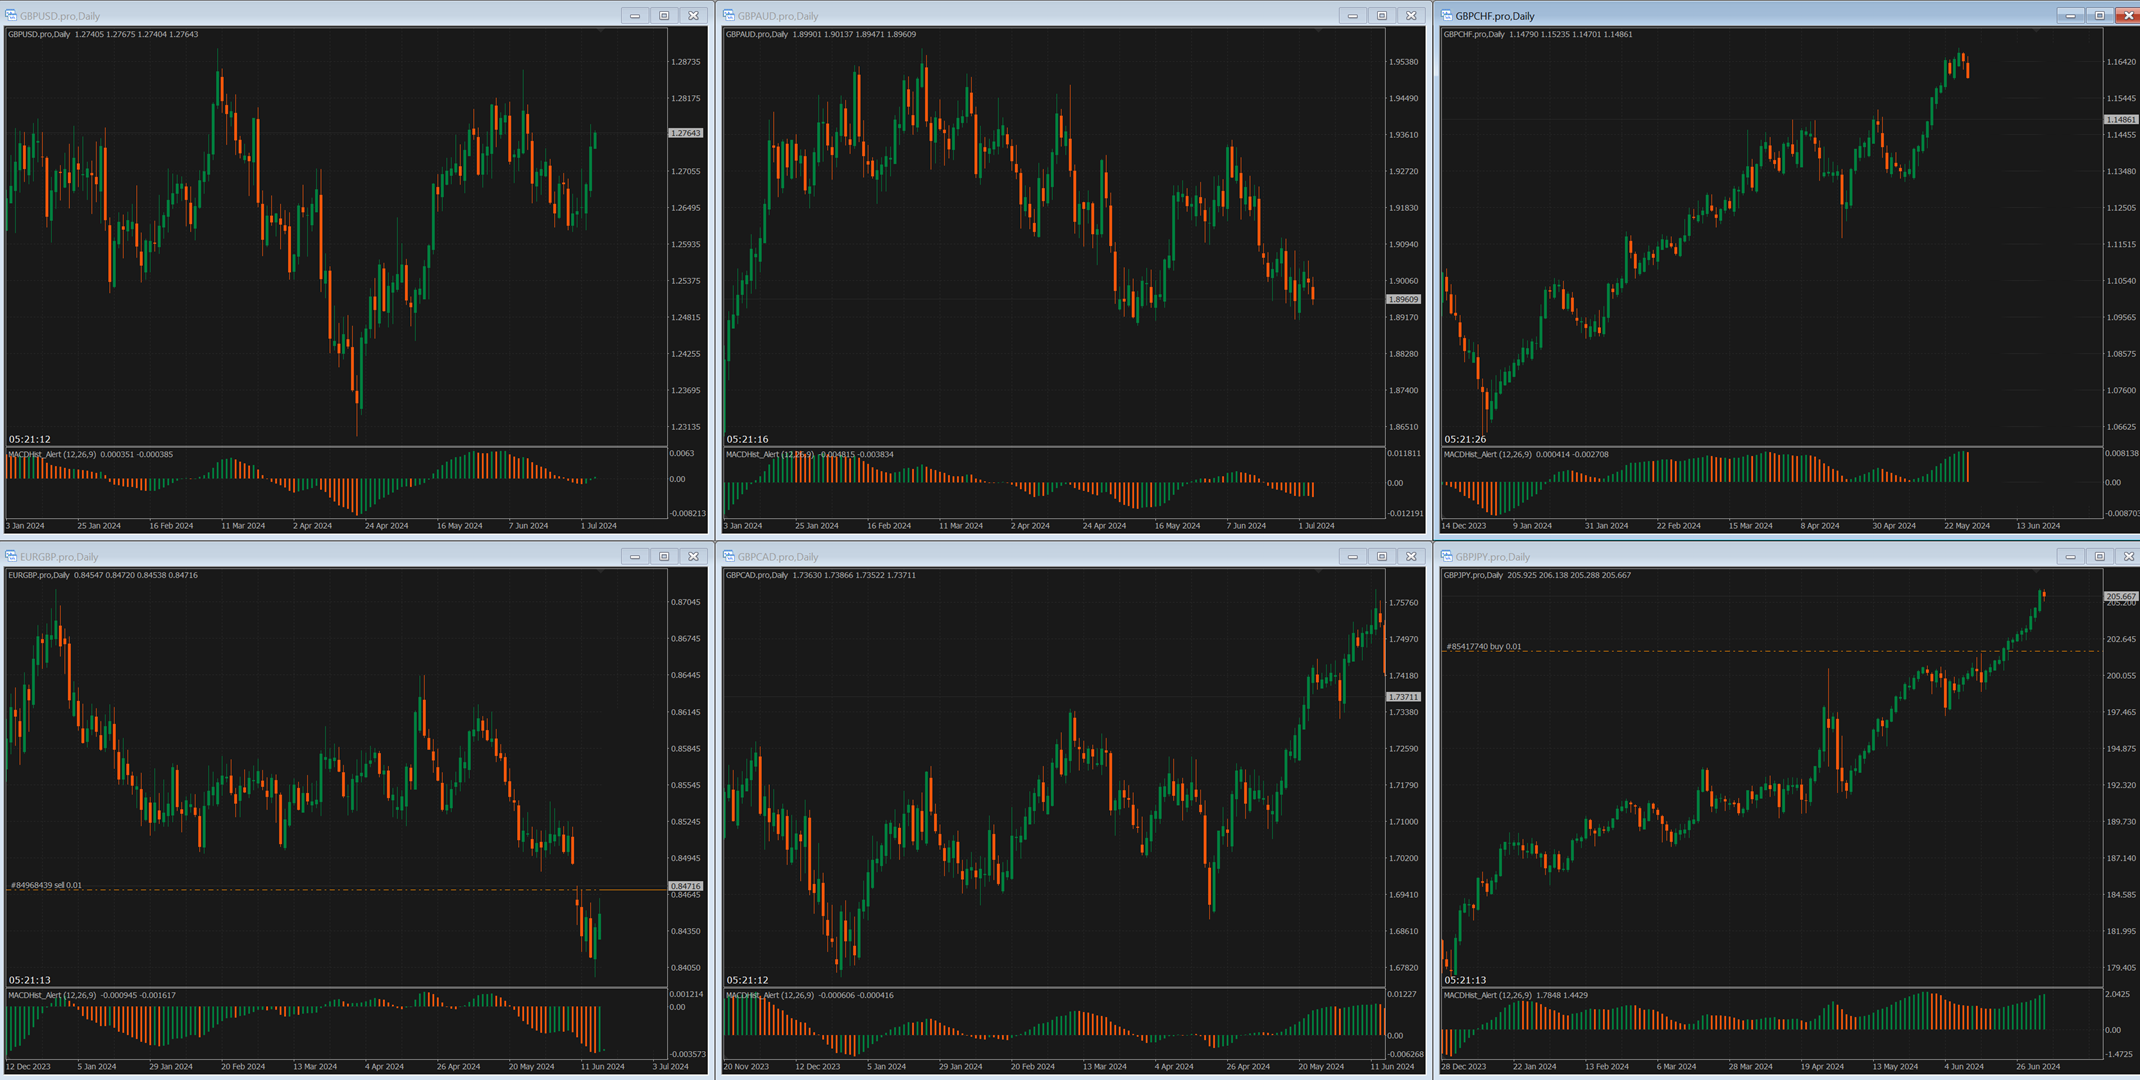
If we take Darek’s extreme MACD method as an example…
Which of the markets are currently at their extremes?
That’s right! You have EURGBP and GBPCHF…
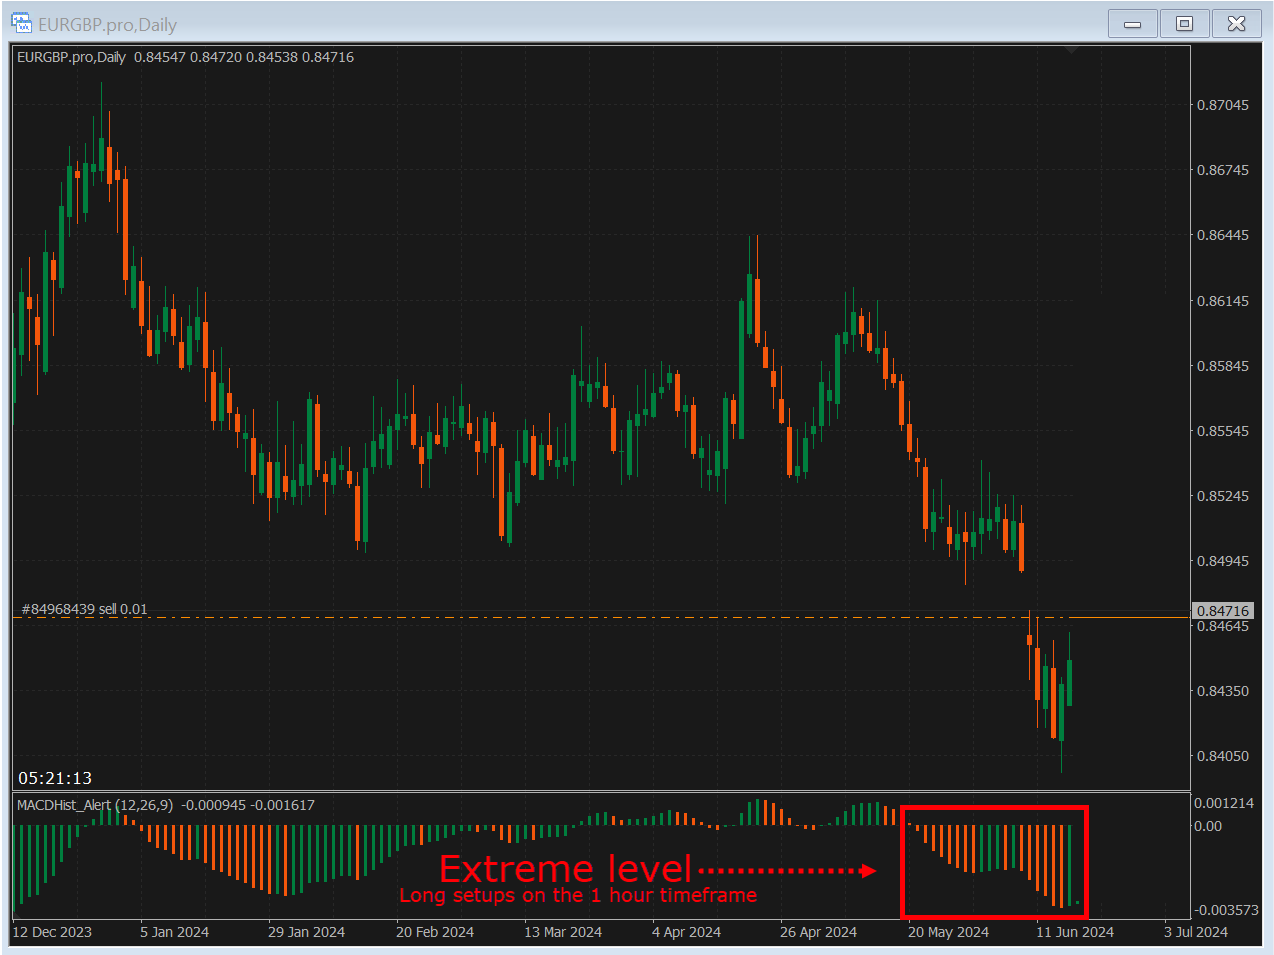
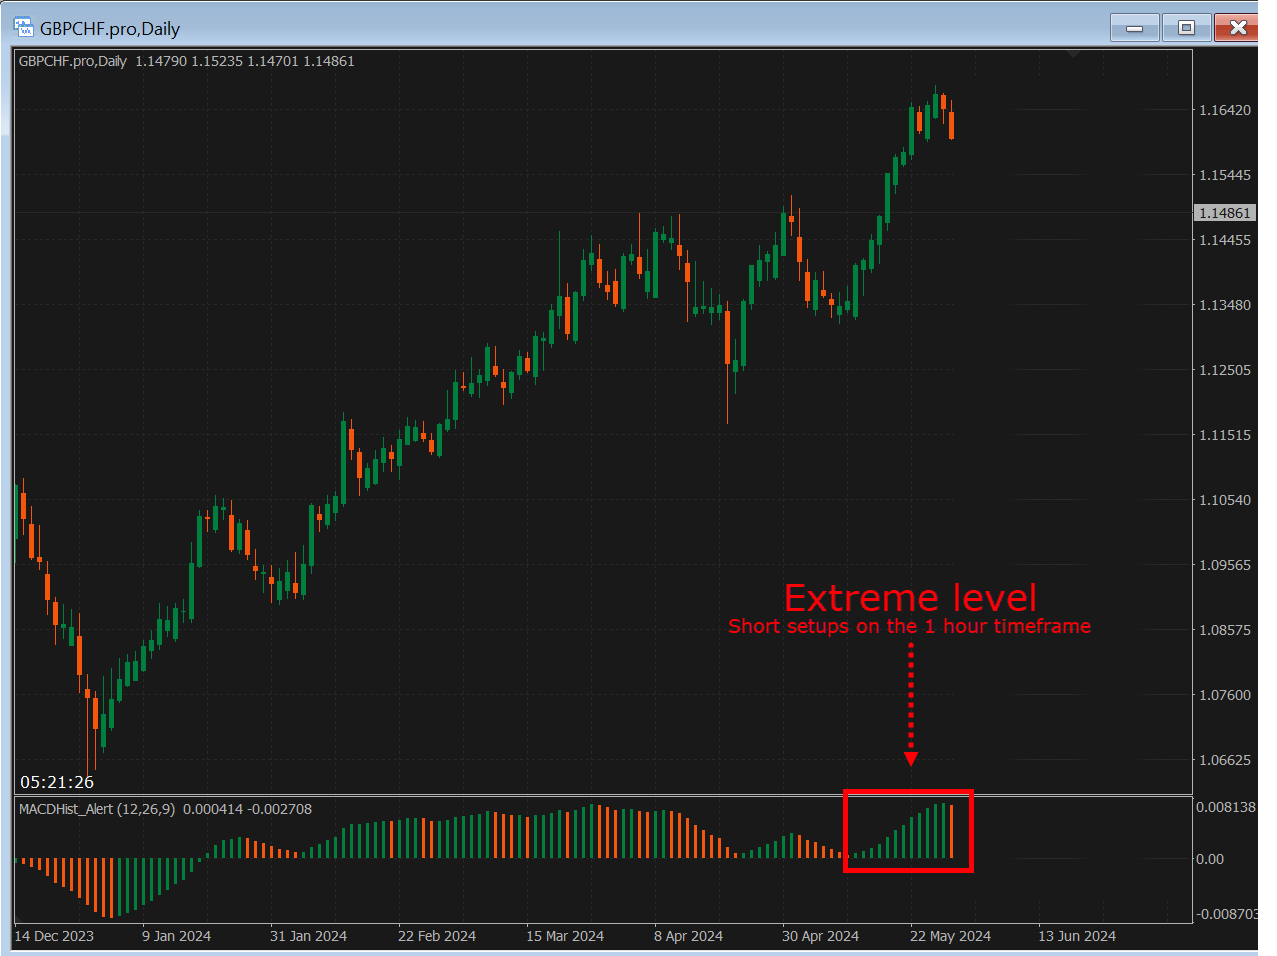
Now, what this means is that for the rest of the day, you’ll closely look at those pairs exclusively and find setups in the 1 hour timeframe!
This leads me to the next step…
Execution (interval checking during the day)
Unlike day trading or scalping timeframes such as the 5-minute or 15-minute timeframes…
…the 1 hour timeframe is less sensitive to volatile market sessions.
This means if you want to scalp the markets, you want to focus trading only on market sessions that offer the most volatility.
Such as the London and New York session overlap for Forex…

Source: ForexFactory
But since you’re trading the 1 hour timeframe, you can trade all market sessions.
Note again that you shouldn’t be checking every single hour!
Why?
Because the price action of the market takes time to develop.
This means that I suggest checking your narrowed-down watchlist once every 4-hours.
As an example…
- 8 am – watchlist building for the day
- 12 pm – execute trades or monitor honed watchlist
- 4 pm – execute trades or monitor honed watchlist
- 8 pm – execute trades or monitor honed watchlist
After 8 pm, you prepare for bed or spend time with your kids and family.
No charts during that time!
It’s important to balance trading and lifestyle
Of course, you’re free to modify this schedule depending on the markets you trade, but you get the idea.
Journaling (every weekend)
Luckily, there are some detailed guides on how you can journal your trades here:
A Complete Guide To Creating And Using A Forex Trading Journal
But the main takeaway is this…
Don’t overcomplicate it
You want to journal your trades in a way that is simple enough for you to repeat the process over and over again.
If you have to input 20 details on each trade, can you realistically maintain it for the next 1,000 trades?
Very tedious, right?
So, keep it simple by:
- Taking a picture of your trade as you enter it
- Taking a picture of your trade once you’ve exited it
That’s it!
If you want more advanced metrics, then let automated trading journals record them for you, such as Myfxbook or Fxblue.
Finally, you need to learn how to use your trading journal!
This means that every weekend you want to collect data of at least 10 finished trades and ask these questions…
- Out of all your trades, for what percentage of them did you follow your rules?
- If you broke your rules on most of your trades, how can you improve your trading routine, or is your mental health okay? Should you take a break?
- If you didn’t break your rules but the week turned out negative, how can you improve from your losses? Tighter stops? Fixed targets?
From there, you’ll want to make changes to your trading plan for the coming week.
Again, slight changes only – you are trying to optimize your trading plan instead of rewriting it!
Another thing to take note of is to only do this over the weekend when the markets are closed.
A closed market keeps your mind focused on your trading journal instead of being attached to your open trades.
Important stuff, right?
So, as you can see, having the right trading routine is about trying to achieve a balance…
…between maintaining your lifestyle and having a trading business…
…in a way that they don’t interfere with each other!
You are free to modify these processes to your liking, just make sure to have the three phases of a trading routine in mind.
In the next section, things are going above and beyond as you look at the business aspect of trading!
How to trade price action in the 1 hour timeframe: How should you manage your risk and when should you add capital?
Here’s one thing to keep in mind…
The lower the timeframe, the lower your risk per trade should be.
Why?
Because lower timeframe trading means that you’ll have higher frequency trading activity…
…which in turn means that you’ll have constant feedback on your trades.
It’s exactly this kind of feedback that can affect your emotions the most easily.
So, to counter this, you want to risk 0.5% per trade or lower.
The reason is simple!
The lower your risk per trade is, the less volatile your trading portfolio will be overall…
…as you increase the frequency of your trades compared to trading only on the 4-hour or daily timeframe.
And if you have a huge account or are managing funds, then you may even want to consider risking 0.25% per trade.
Speaking of trading accounts…
When should you add capital?
Ideally, you want to start small.
Whether that’s $50, $500 or $1,000 to you, that doesn’t matter!
By starting small, there’s less emotional impact.
Now, if you find you’ve been consistent in your actions for at least 2 months…
…then it might be time to consider adding more funds to your account!
Basically…
You don’t want to trade on a big account without confidence.
So instead, build your confidence on a small account.
Once your trading confidence arises, it will become easier mentally to handle a larger account.
Make sense?
Good, because that’s all there is to it!
I have laid down everything I know to help you not only build your trading account in the 1 hour timeframe but to also help you sustain it.
So, with that said…
Let’s have a recap of what you’ve learned today!
Conclusion
Don’t get me wrong.
It’s totally okay to only trade the higher timeframes if you wish!
But if you’ve reached this far, it means that you’re well on your way to trading the 1 hour timeframe.
This guide is designed to make sure you achieve consistency.
Here’s what you’ve learned today:
- Trading the 1 hour timeframe can be as simple as having three price action setups: break of structure, buildups, and trend continuation
- On the daily timeframe, you can either choose to look at the previous daily highs or lows or look for the extreme MACD levels as a way to select and filter markets to trade during the day
- A trading routine consists of building your watchlist every morning, executing or monitoring your charts once every 4 hours, and journaling your trades
- On the lower timeframes, consider risking less than 0.50% per trade, as well as starting with a small account, and then adding more funds as you build confidence and consistency in trading
So there you go!
A complete guide on how to get started in 1 hour timeframe!
Now here’s what I want to know…
Do you already trade the 1 hour timeframe?
If so, have you learned something new here today?
Or perhaps you feel the 1 hour timeframe just isn’t for you?
At any rate, share your thoughts in the comments below!


