Yesterday:
I’m concerned about tariff policy impacting the economy. Usually fiscal, executive and trade policy decisions wouldn’t lead to an immediate recession, but these tariffs are a huge blunder. There have been other unforced errors – like cutting basic research spending – but that is more of a long-term issue.
As an aside: Imagine a tech company announcing they were going to cut spending by eliminating R&D. Their stock would plummet. That is what the U.S. has done with some of the DOGE cuts.
To recap, nowcasts and tracking forecasts are down for Q1:
Figure 1: GDP (black), GDPNow of 4/1 (red triangle), GDPNow adjusted for gold imports (pink square), NY Fed (blue square), Goldman Sachs (inverted green triangle), SPGMI (orange inverted triangle), Survey of Professional Forecasters (light blue), all in billion Ch.2017$ SAAR. Source: BEA, Atlanta Fed, Philadelphia Fed, NY Fed, Goldman Sachs and authors calculations.
NBER BCDC indicators plus SPGMI’s monthly GDP (formerly Macroeconomic Advisers’ monthly GDP):

Figure 2: Nonfarm Payroll incl benchmark revision employment from CES (bold blue), implied NFP from preliminary benchmark through December (thin blue), civilian employment as reported (orange), industrial production (red), personal income excluding current transfers in Ch.2017$ (bold light green), manufacturing and trade sales in Ch.2017$ (black), consumption in Ch.2017$ (light blue), and monthly GDP in Ch.2017$ (pink), GDP (blue bars), all log normalized to 2021M11=0. Source: BLS via FRED, Federal Reserve, BEA 2024Q4 3rd release, S&P Global Market Insights (nee Macroeconomic Advisers, IHS Markit) (4/1/2025 release), and author’s calculations.
Monthly GDP and civilian employment (which has high volatility) are essentially flat, while consumption is down relative to peak.
What about employment? Still growing strongly by most accounts.
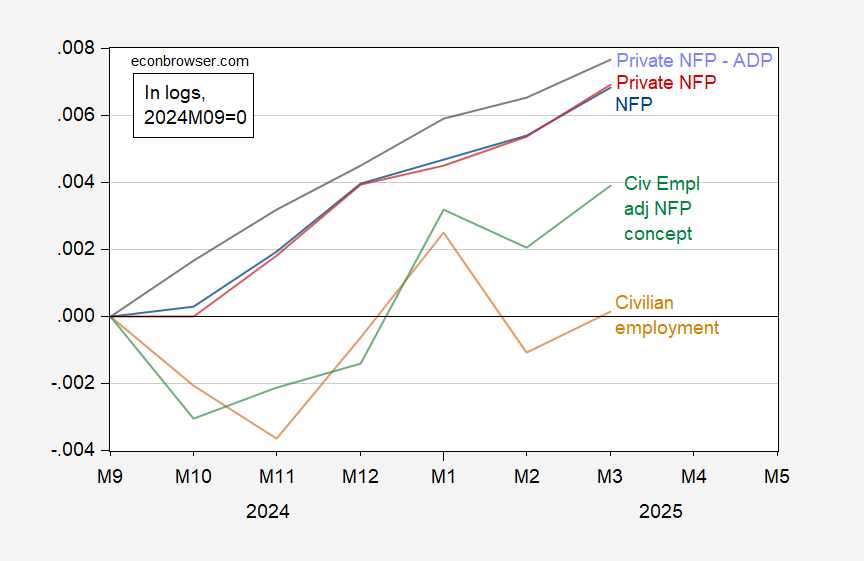
Figure 3: Nonfarm payroll employment from BLS (blue), private NFP from BLS (red), private NFP from ADP (lilac), civilian employment adjusted to NFP concept, experimental series spliced to official (green), civilian employment, experimental series spliced to official (tan), all, s.a., in logs=2024M09=0. Source: BLS, BLS and ADP via FRED, and author’s calculations.
Aside from civilian employment (which has lots of volatility), employment is still growing, albeit more slowly.
Hence, the anxiety is based mostly on “soft data”, of which many indicators are looking *very* soft.